You need visibility into pod-level costs because AWS billing is about as helpful as a chocolate teapot - it shows you EC2 instances but not which app is eating your budget. Most teams skip this step and start randomly fucking with resource limits, then wonder why their costs went up instead of down.
Step 1: Install Cost Monitoring (Choose Your Poison)
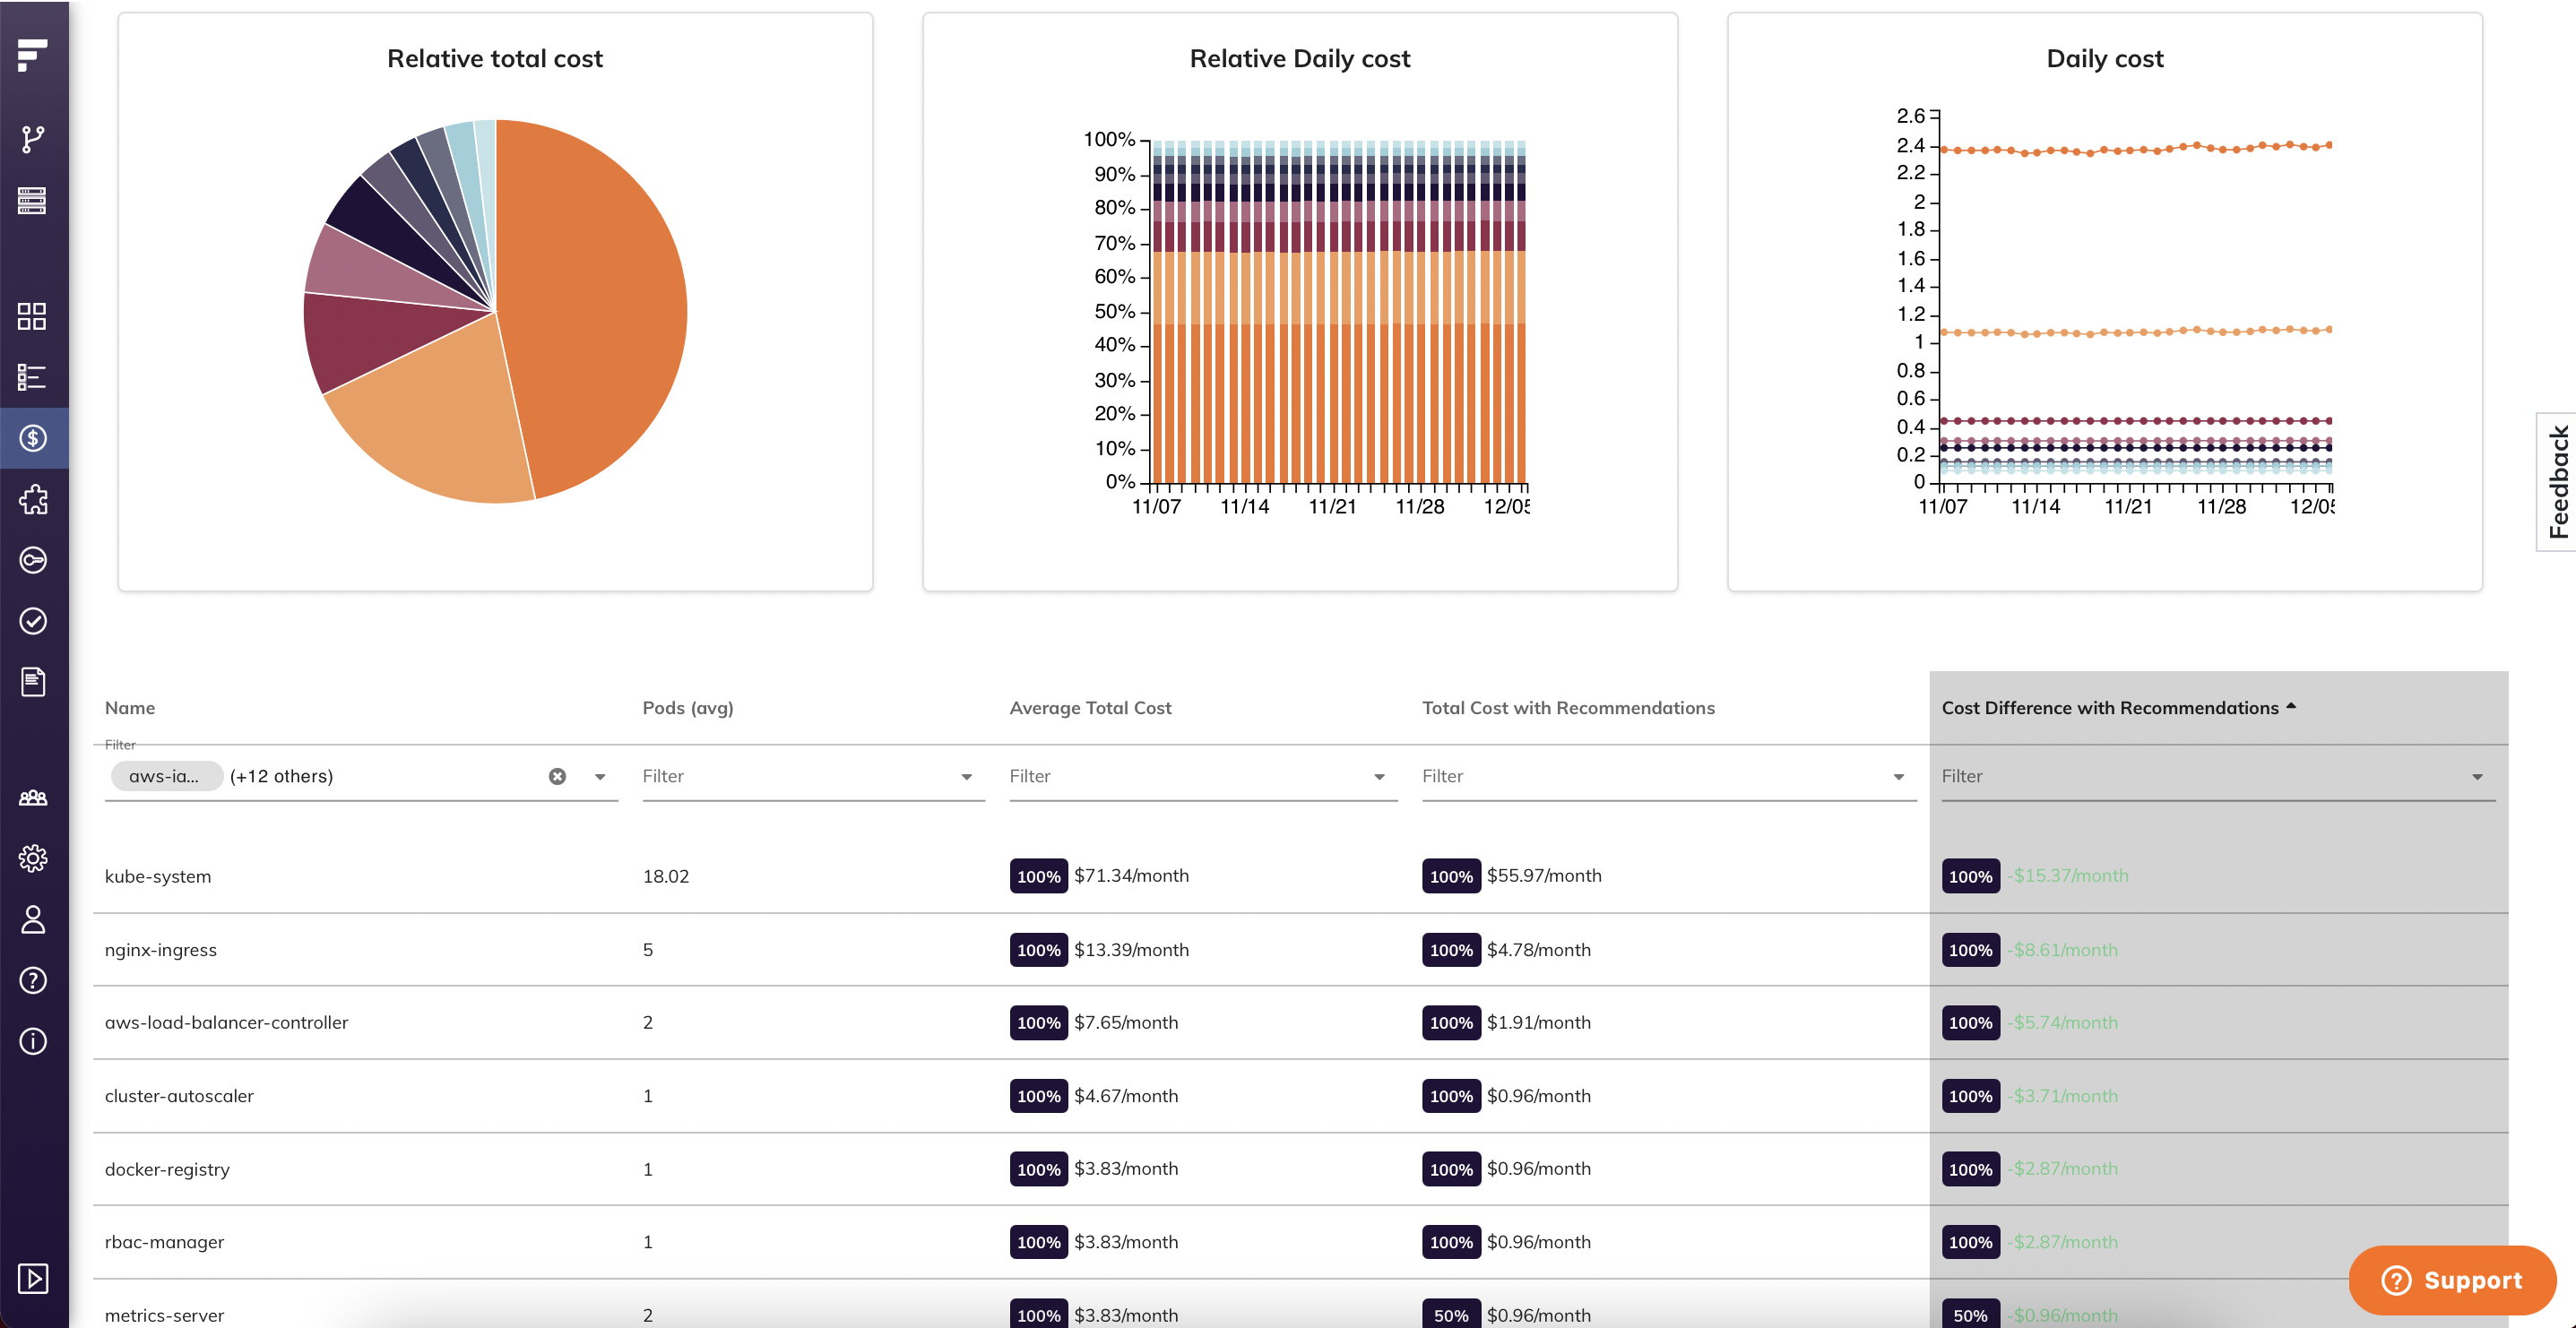
KubeCost Dashboard Overview: Once installed, the KubeCost dashboard provides detailed breakdowns of costs by namespace, deployment, and individual pods. The interface shows real-time spend, resource utilization percentages, and identifies over-provisioned workloads through intuitive charts and cost allocation views.
You need visibility into pod-level costs. Native cloud billing shows you EC2 instances but not which application ate your budget.
Option A: KubeCost (Recommended for Speed)
## Quick install for immediate visibility
helm repo add kubecost https://kubecost.github.io/cost-analyzer/
helm install kubecost kubecost/cost-analyzer -n kubecost --create-namespace \
  --set prometheus.server.resources.requests.memory=4Gi \
  --set prometheus.server.resources.limits.memory=8Gi
Option B: OpenCost (Free Forever)
## CNCF project, no licensing limits
kubectl apply -f https://raw.githubusercontent.com/opencost/opencost/develop/kubernetes/opencost.yaml
Option C: Manual Setup with Existing Prometheus
If you already have Prometheus, configure KubeCost to use it:
prometheus:
  server:
    enabled: false
  prometheusEndpoint: "http://prometheus-server.monitoring.svc.cluster.local"
Step 2: Gather Resource Usage Data (The Reality Check)
Run these commands to see your actual vs requested resources. The gap will shock you.
## Check current resource usage
kubectl top pods --all-namespaces --sort-by memory
kubectl top nodes

## Find pods without resource limits (danger zone)
kubectl get pods --all-namespaces -o jsonpath='{range .items[*]}{.metadata.namespace}{"/"}{.metadata.name}{"	"}{.spec.containers[*].resources}{"
"}{end}' | grep -v limits

## Identify biggest memory consumers
kubectl top pods --all-namespaces --sort-by=memory | head -20

## Find long-running pods that might be idle
kubectl get pods --all-namespaces --field-selector=status.phase=Running -o custom-columns="NAMESPACE:.metadata.namespace,NAME:.metadata.name,AGE:.metadata.creationTimestamp" | sort -k3
What you're looking for:
- Pods using 10% of their memory limit (over-provisioned)
- Pods with no resource limits set (resource bombs waiting to happen)
- Development/staging namespaces consuming production-level resources
- Long-running jobs that should have finished hours ago
Essential Cost Monitoring Resources:
- KubeCost Documentation - Complete installation and configuration guide
- OpenCost Project - CNCF-backed open source alternative
- Kubernetes Resource Management Guide - Official resource documentation
- Prometheus Node Exporter - Required for accurate cost metrics
- AWS EKS Cost Monitoring - Cloud provider integration
- GKE Cost Optimization - Google Cloud specific guidance
- Azure AKS Cost Analysis - Microsoft Azure cost tracking
- KubeCost API Documentation - For automated reporting and alerts
- Helm Chart Values Reference - All configuration options
- KubeCost Troubleshooting - When installation fails
- Resource Quota Documentation - Namespace-level controls
- Prometheus Querying Guide - Custom cost metrics
Step 3: Analyze Your Current Spend Patterns
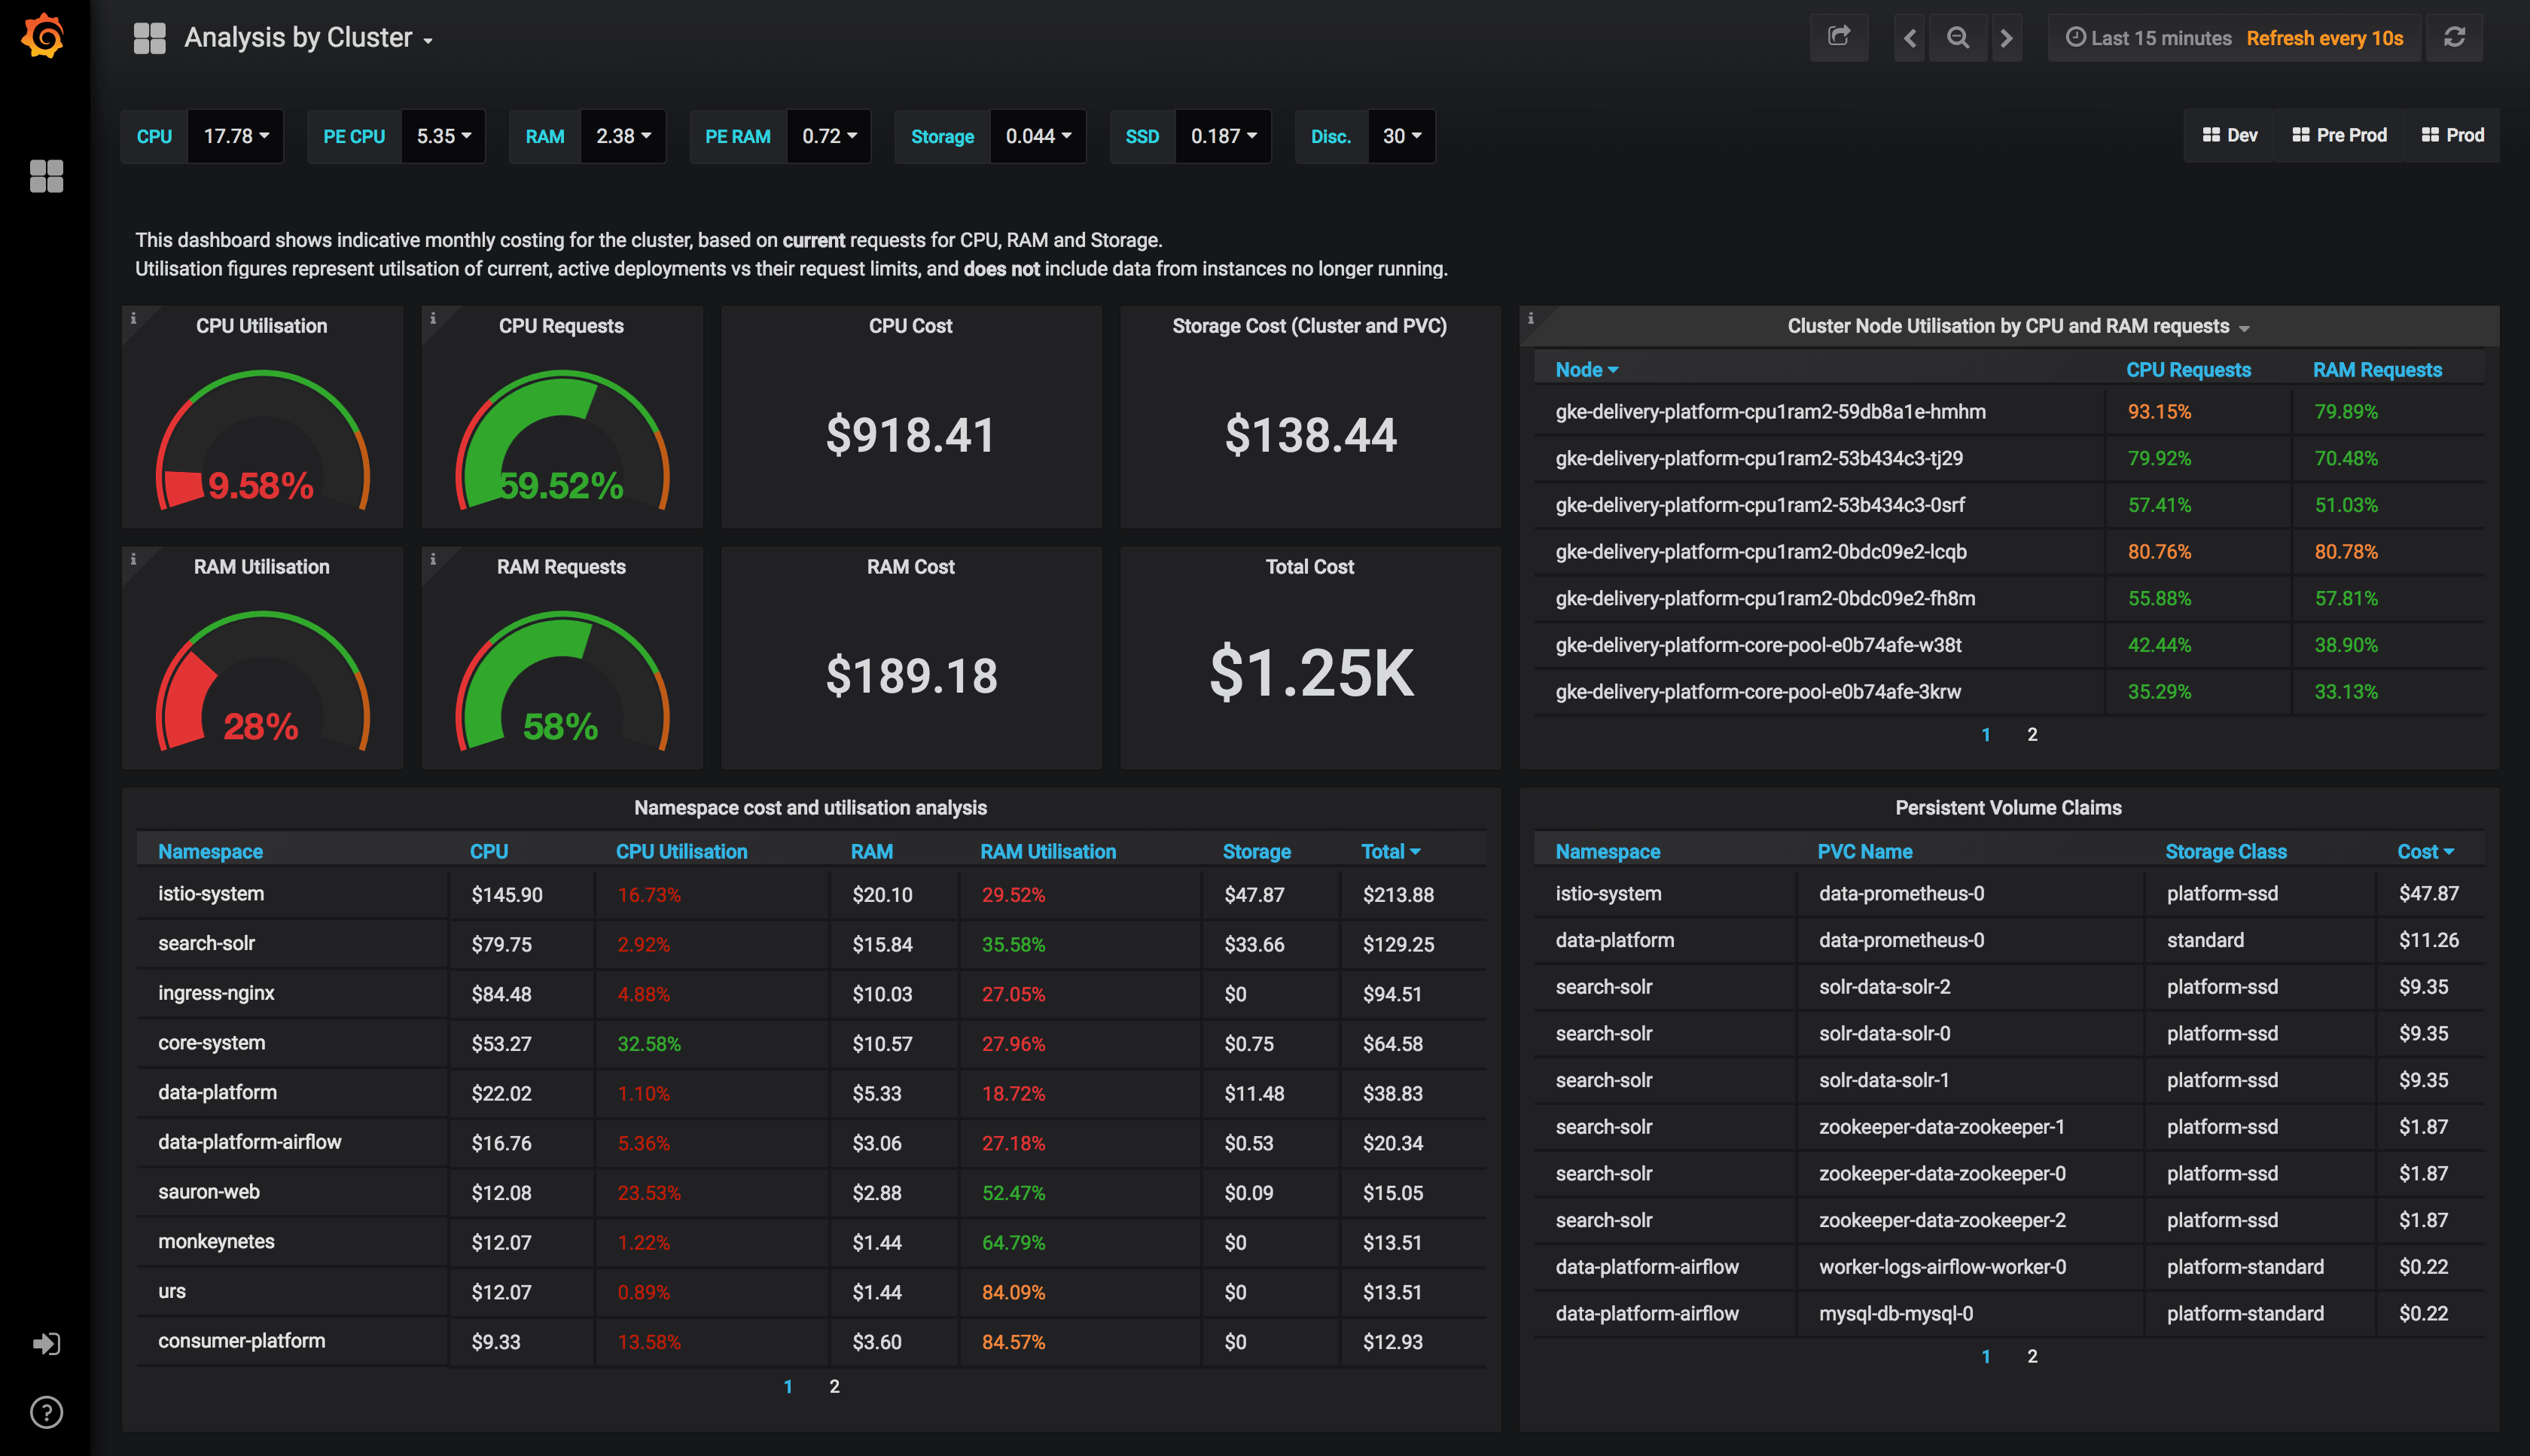
Access your cost monitoring tool (KubeCost UI is typically at kubectl port-forward -n kubecost svc/kubecost-cost-analyzer 9090:9090) and document:
Cost by Namespace (The Shock Factor)
- Which namespaces cost the most per month?
- Are dev/test environments costing more than production?
- Any rogue namespaces you forgot about?
Cost by Workload Type
- Deployments vs StatefulSets vs Jobs
- Which applications have the worst cost-to-traffic ratio?
- Identify batch jobs that never finished
Idle Resource Detection
- CPU utilization under 20% consistently
- Memory utilization under 50% consistently
- Network traffic near zero
Step 4: Document Your Baseline Numbers
Create a spreadsheet with current monthly costs:
| Namespace | Monthly Cost | Pod Count | Avg CPU % | Avg Memory % | Notes |
|---|---|---|---|---|---|
| production | $12,000 | 45 | 65% | 78% | Acceptable |
| staging | $8,500 | 52 | 12% | 23% | WASTE |
| dev-team-1 | $3,200 | 28 | 8% | 15% | WASTE |
| ml-training | $15,000 | 3 | 95% | 90% | Check if still needed |
Red flags to investigate:
- Any environment with <30% resource utilization
- Staging/dev costing >50% of production
- Individual pods costing >$500/month
- Persistent volumes growing >10GB/month
Step 5: Identify Quick Wins (The Low-Hanging Fruit)
Before diving into complex optimizations, grab the obvious savings:
Unused Resources Audit
## Find PVCs that aren't mounted
kubectl get pvc --all-namespaces -o custom-columns="NAMESPACE:.metadata.namespace,NAME:.metadata.name,STATUS:.status.phase,VOLUME:.spec.volumeName" | grep -v Bound

## Find services without endpoints (dead load balancers)
kubectl get svc --all-namespaces -o custom-columns="NAMESPACE:.metadata.namespace,NAME:.metadata.name,TYPE:.spec.type,ENDPOINTS:.status.loadBalancer" | grep LoadBalancer | grep -v "<nil>"

## Find deployments scaled to zero (but still consuming storage)
kubectl get deployments --all-namespaces -o custom-columns="NAMESPACE:.metadata.namespace,NAME:.metadata.name,REPLICAS:.spec.replicas,AVAILABLE:.status.availableReplicas" | grep "0.*0"
Development Environment Cleanup
- Shut down development clusters outside business hours (save 60% on dev costs)
- Use smaller node types for non-production workloads
- Implement auto-shutdown for feature branch environments
Storage Cleanup
## Find large persistent volumes
kubectl get pv -o custom-columns="NAME:.metadata.name,SIZE:.spec.capacity.storage,CLASS:.spec.storageClassName" --sort-by=.spec.capacity.storage

## Check which PVs are actually being used
kubectl describe pv | grep -A5 -B5 "Status:.*Available"
Expected Results After Baseline Assessment
If you're typical, you'll discover:
- 40-60% of CPU requests are unused
- 30-50% of memory requests are unused
- Dev/staging environments consume 40-70% of total spend
- 10-20% of storage is attached to deleted resources
- 5-15% of load balancers serve zero traffic
Immediate 30-day savings potential:
- Rightsizing over-provisioned resources: 15-25% cost reduction
- Shutting down unused environments: 10-20% cost reduction
- Storage cleanup: 5-10% cost reduction
- Total quick wins: 30-55% cost reduction
This baseline gives you the data needed for Phase 2: actually implementing the optimizations. Most teams see 30-40% savings just from Phase 1 cleanup, before touching any advanced strategies.
The next phase covers implementing the technical changes: resource right-sizing, spot instances, and autoscaling configurations.