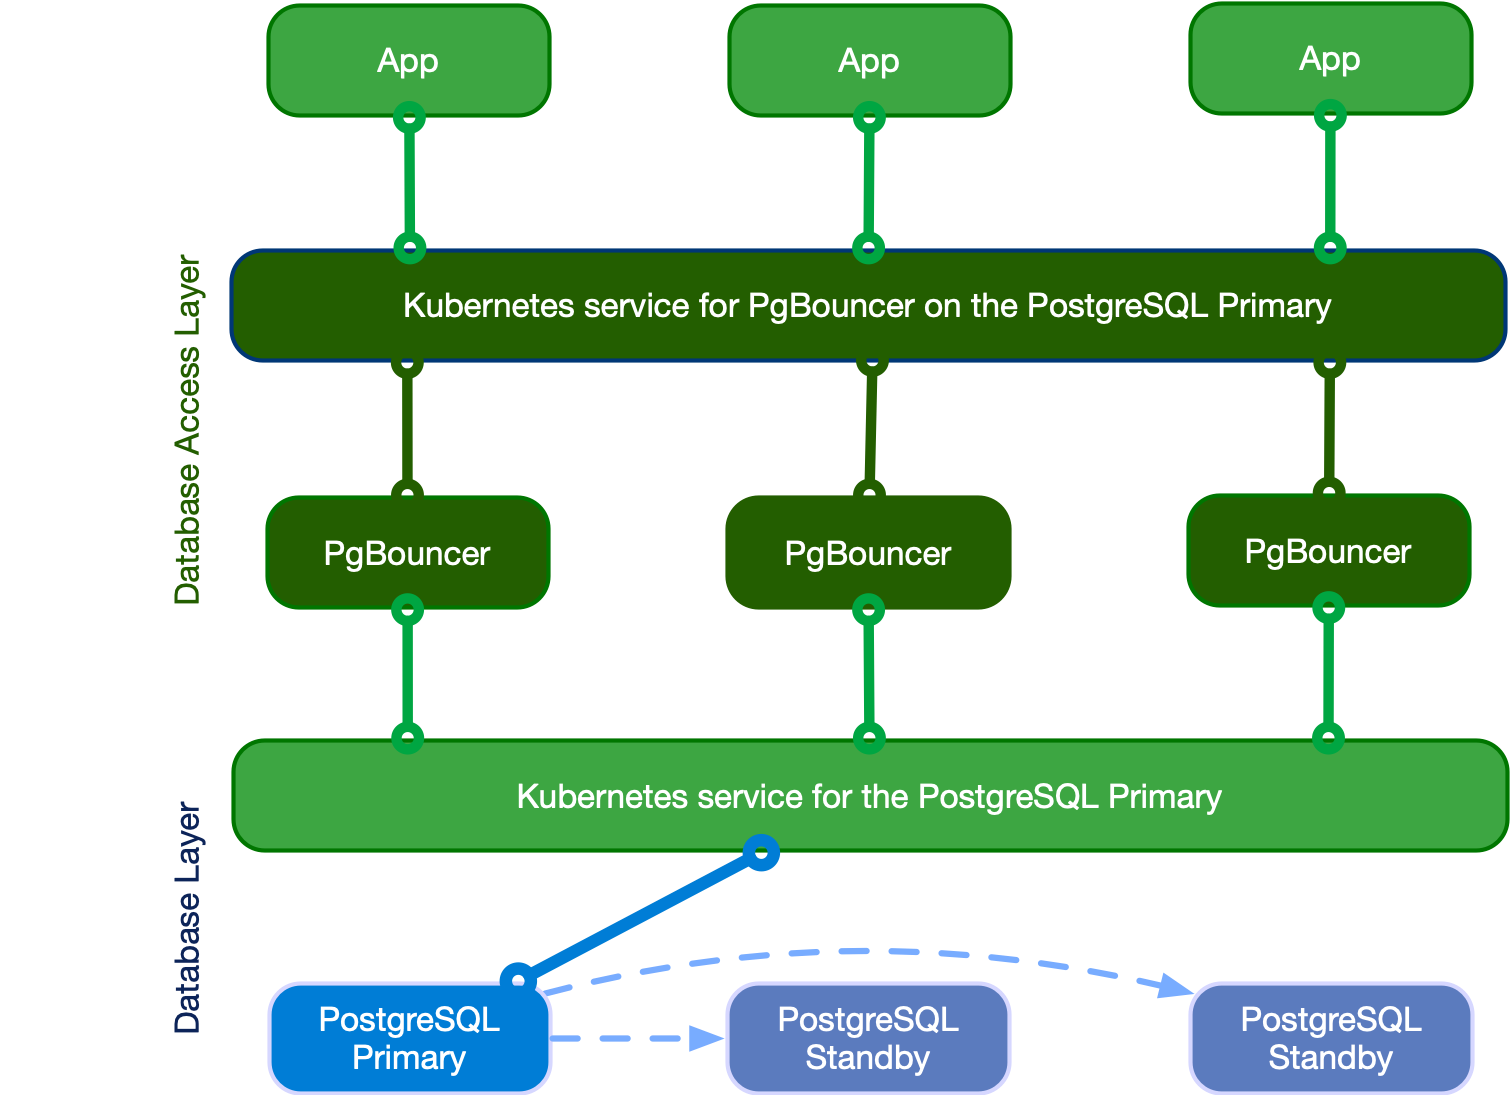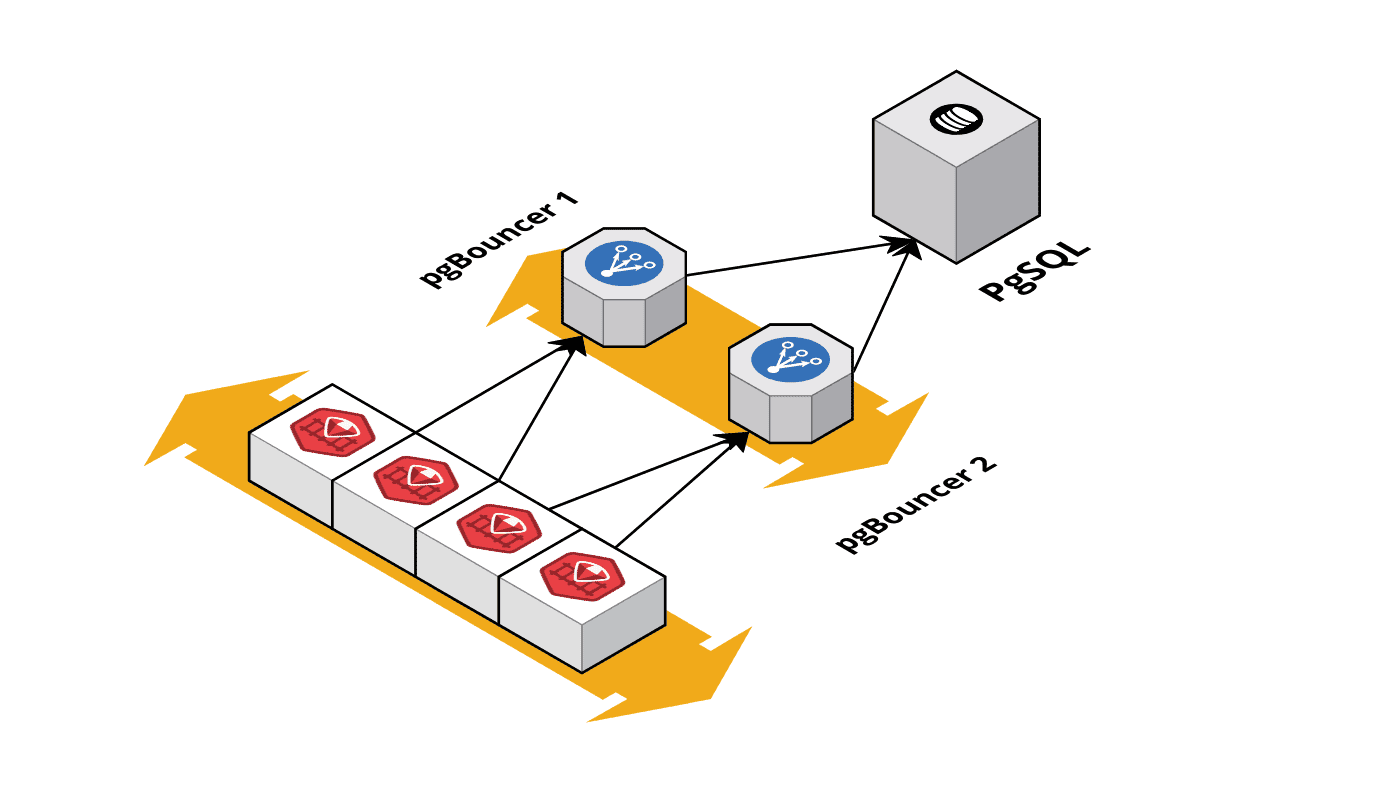
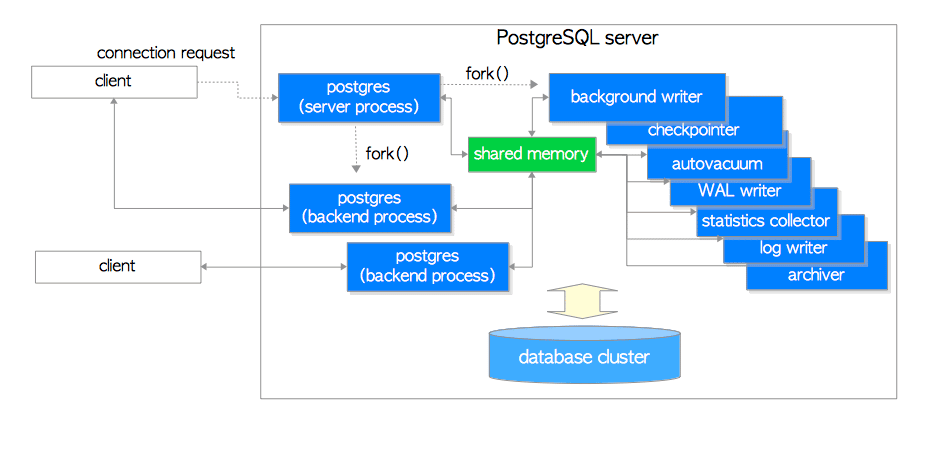
Connection pooling happens at like three different layers, and any one of these bastards can ruin your day. Your app's got its own pool - HikariCP if you're stuck with Java, pgx for Go (actually decent), pg-pool for Node.js. Then maybe you've got PgBouncer sitting in the middle playing traffic cop. When any of these layers fills up, they all look exactly the same from the outside, but the fix is totally different.
Last month our e-commerce site started timing out during checkout. PostgreSQL was at 15% CPU, memory looked fine, no slow query alerts. Everything pointed to a healthy database. But users couldn't complete purchases and were bailing on their carts.
Took me 3 hours to realize our Java app's HikariCP pool was set to 10 connections while we had 200 concurrent requests hitting checkout. PostgreSQL could handle way more load, but our app was choking on its own stupid pool settings.
What Connection Pool Exhaustion Actually Looks Like
When pools fill up, the symptoms make no fucking sense:
- Connection timeout errors while PostgreSQL CPU idles at 20%
- Response times spike from normal 100ms to 30+ seconds for basic queries
- PostgreSQL says "too many clients" but max_connections shows available slots
- App pool reports "exhausted" while database metrics look perfect
- Memory usage climbs on app servers and doesn't drop back down
This is why this problem makes me want to throw my laptop out the window. Your fancy monitoring dashboards are all green and happy while users are getting 504 errors and calling support to complain.
Common Ways Pools Fail You
Traffic spikes expose bad sizing: At my last startup, some PM decided our pool should be sized for "100 concurrent users max" based on... I honestly don't know what data. Worked fine for months until we hit the Hacker News front page at 2am PST and got absolutely demolished. Our HikariCP pool of 15 connections got steamrolled by something like 800 users, maybe way more - our monitoring was having a complete breakdown. Pool exhausted in under 30 seconds. Now I size for 3x normal peak and pray it's enough.
Slow queries eat all your connections: Had this one analytics query from hell that took exactly 37 seconds every time (I know because I watched it run about 500 times while debugging). During lunch rush we'd have 6-7 instances of this bastard running simultaneously, hogging like 80% of our measly 25-connection pool. Regular user queries - login, checkout, basic shit - couldn't get connections and would just sit there timing out. Learned to use separate pools: fast queries get their own pool, slow analytics crap gets quarantined.
Connection leaks look like pool exhaustion: Code grabs connections but never gives them back, like that coworker who borrows your charger and "forgets" to return it. Pool thinks connections are busy when they're actually zombie processes doing jack shit. Our Node.js app forgot client.release() in error handlers - spent 4 hours pulling my hair out trying to figure out why we had 20 "active" connections that weren't actually doing anything. Pro tip: always use try/finally blocks or you'll be debugging this nightmare at 2am like I was.
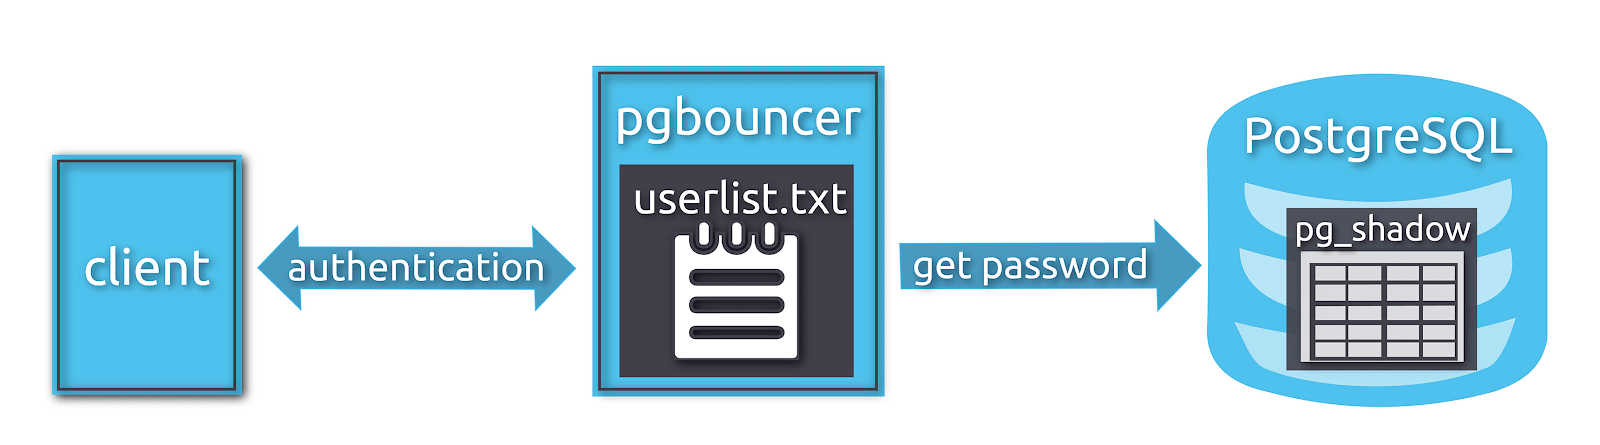
Layer configuration mismatches: App configured for 50 connections, PgBouncer set to 20. App keeps trying to open connections that PgBouncer immediately rejects. Check that your layers are aligned - app pool should be bigger than proxy pools or you're fucked.
What Actually Happens During Outages
Pool exhaustion creates cascading failures that last way longer than the original problem. When connections finally free up, all the queued requests slam the system at once. A 5-minute connection issue turns into 20+ minutes of instability as everything tries to catch up.
Standard database monitoring is useless here - CPU and memory look fine while your app is dying. Pool metrics live in the application layer where most teams don't bother monitoring. You're debugging blind.
Timeout configurations make this worse. Database timeout 30 seconds, app timeout 60 seconds, load balancer 90 seconds. User waits 90 seconds for what should be a 200ms response. Each layer adds more delay instead of failing fast.
This is an application problem that looks like a database problem. Fix your connection management before touching PostgreSQL settings.