When kubectl describe pod Gives You Nothing Useful
Every fucking CrashLoopBackOff guide tells you to run kubectl logs and kubectl describe pod like that actually helps. In reality, those commands rarely tell you what's actually wrong. Here's what you actually need to check when your pods are dying faster than you can debug them.
CrashLoopBackOff is still the #1 most frustrating Kubernetes error I deal with. The debugging techniques haven't changed much, but the tooling has gotten slightly less awful. For the official approach, check the Kubernetes troubleshooting docs and debugging application guide.
First Things to Check (The Stupid Stuff That Usually Works)
Before you go down rabbit holes, check the obvious things that break in production but work fine locally:
## Check if your image actually exists and can be pulled
kubectl get events --field-selector reason=Failed | grep -i "pull"

## See what your container actually died from
kubectl describe pod <your-broken-pod> | grep -A 5 -B 5 "Exit Code"

## Check if you're out of memory (spoiler: you probably are)
kubectl describe pod <pod-name> | grep -i "oomkilled"
The number of times I've spent hours debugging only to find the image tag was wrong or the container ran out of memory is embarrassing. Always check the dumb stuff first - saves you like 2 hours of frustration.
Memory Issues (The Most Common Culprit)
Your app probably needs more RAM than you think. Here's how to figure out what's actually happening:
## See if you're getting killed for using too much memory
kubectl top pods --sort-by=memory
## (this might not work if your metrics server is broken, which it usually is)

## Check your actual memory limits vs usage
kubectl describe pod <pod-name> | grep -A 3 -B 3 "Limits:|Requests:"

## If the container is still alive, check memory usage inside it
kubectl exec -it <pod-name> -- free -h
kubectl exec -it <pod-name> -- cat /proc/meminfo | head -10
I've debugged so many Java apps that were OOMKilled because someone set memory limits without understanding how the JVM actually uses memory. If you're running Java in a container, you need to set -XX:+UseContainerSupport and understand that heap != total memory usage. The OpenJDK documentation explains container support in detail.
Recent Update: If you're running Kubernetes 1.30+ with newer Java versions (17+), the JVM container detection has gotten better, but you still need to explicitly set memory flags because Kubernetes 1.31 introduced new cgroup changes in August 2024 that can mess with Java memory calculations. See the container resource management guide for more details on how resource limits interact with applications.
Init Container Hell
Init containers are where deployments go to die silently. They fail, and your main container never even starts, but the error messages are useless:
## Check if your init containers actually completed
kubectl get pod <pod-name> -o jsonpath='{range .status.initContainerStatuses[*]}{.name}{"	"}{.state}{"
"}{end}'

## Get logs from the init container that failed
kubectl logs <pod-name> -c <init-container-name> --previous

## See what the init container was supposed to do
kubectl describe pod <pod-name> | grep -A 20 "Init Containers:"
Init containers usually fail because:
- They can't connect to the database (database readiness is tricky)
- DNS doesn't work in your cluster
- Network policies are blocking connections
- You're waiting for a service that doesn't exist
I spent like 4 hours debugging some init container issue, turned out it was trying to connect to "postgres" but our service was actually named "postgresql" or something like that. The error message? "Connection failed." Real useful.
OK, rant over. Here's the technical bit - The init container patterns guide shows how these things should work.
Timing Problems (Health Checks Are Evil)
Kubernetes health checks are designed to kill your application at the worst possible moment. Here's how to figure out if they're the problem:
## Check your health check configuration
kubectl get pod <pod-name> -o yaml | grep -A 10 -B 5 "livenessProbe|readinessProbe"

## See how long your app actually takes to start
kubectl logs <pod-name> --timestamps | grep -i "started|ready|listening"

## Check if health checks are failing
kubectl describe pod <pod-name> | grep -A 5 "Liveness:|Readiness:"
Your Spring Boot app takes like 90 seconds to start, but your liveness probe starts checking after 30 seconds with a 30-second timeout. Kubernetes kills it right as it's about to become ready. This is Kubernetes working as designed, which is to say, stupidly. The health probe best practices guide shows better ways to configure this stuff.
Network and DNS Issues
Half of CrashLoopBackOff problems are network-related, but the errors never tell you that:
## Test DNS from inside your container
kubectl exec -it <pod-name> -- nslookup kubernetes.default

## Check if you can connect to external services
kubectl exec -it <pod-name> -- curl -v --connect-timeout 5 http://google.com

## Test connectivity to other services in your cluster
kubectl exec -it <pod-name> -- telnet other-service 80

DNS in Kubernetes is a shitshow. Sometimes it works, sometimes it doesn't. I've seen clusters where DNS randomly fails for 30 seconds at a time, killing any app that tries to resolve hostnames during that window. The DNS debugging guide has the official steps, but this troubleshooting post covers the real-world issues.
The worst part about network debugging in Kubernetes is that it's usually fine when you test it manually, but breaks during container startup for mysterious reasons that make you question your life choices. Check out the network troubleshooting approach and advanced DNS debugging techniques for when you need to dig deeper.
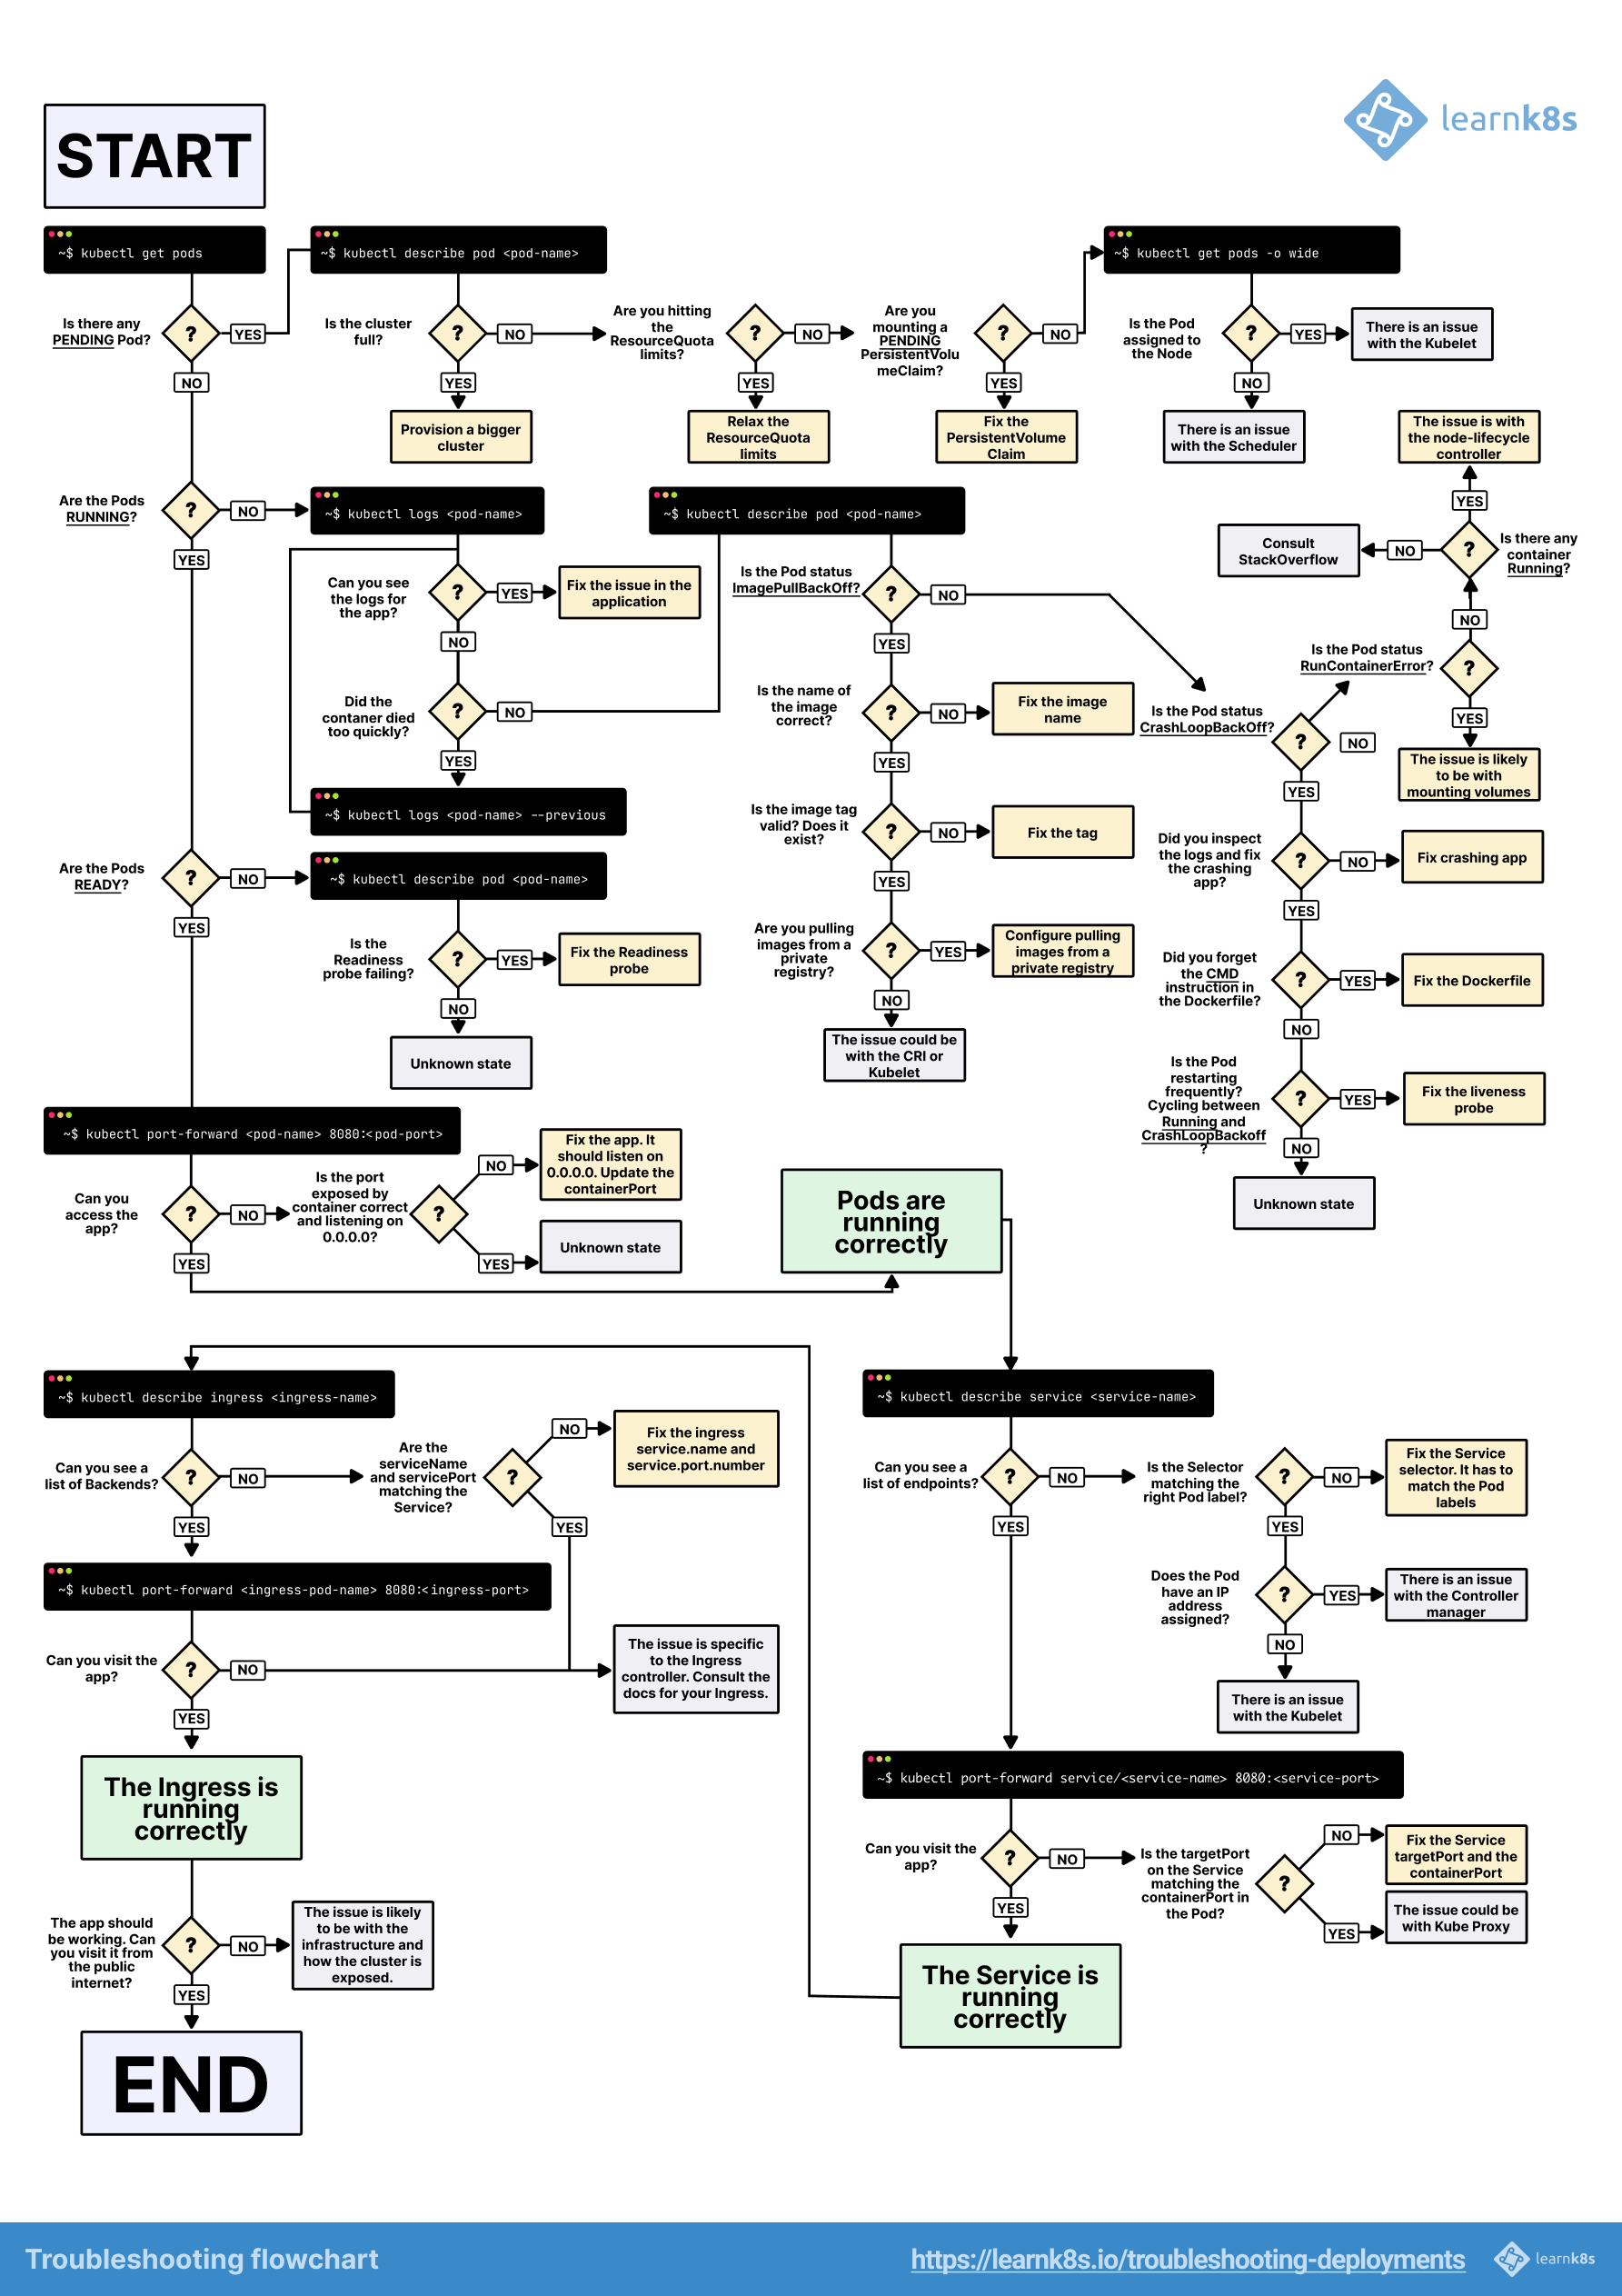
The visual troubleshooting guide above shows the logical flow for debugging pod issues - start with the basics and work your way up the stack. This flowchart is from the Learnk8s team and covers the whole debugging process from pod failures to networking issues.