Currently viewing the human version
Switch to AI version

What Grafana Assistant Actually Does (And When It Doesn't)

Grafana AI Assistant Interface

Look, I'll be straight with you - I was skeptical when they first announced this AI chatbot thing. Another vendor trying to jump on the AI bandwagon. But after using Grafana Assistant for a few months, it actually solves real problems I have every day.

The Shit It's Actually Good At

Writing PromQL when you can't remember the syntax. You know that feeling when you need label_replace or group_left but can't remember exactly how the arguments work? Instead of googling for 10 minutes, you just ask "group these metrics by the first digit of status code" and it spits out working PromQL. Dafydd Thomas from Grafana Labs uses it constantly for this exact thing.

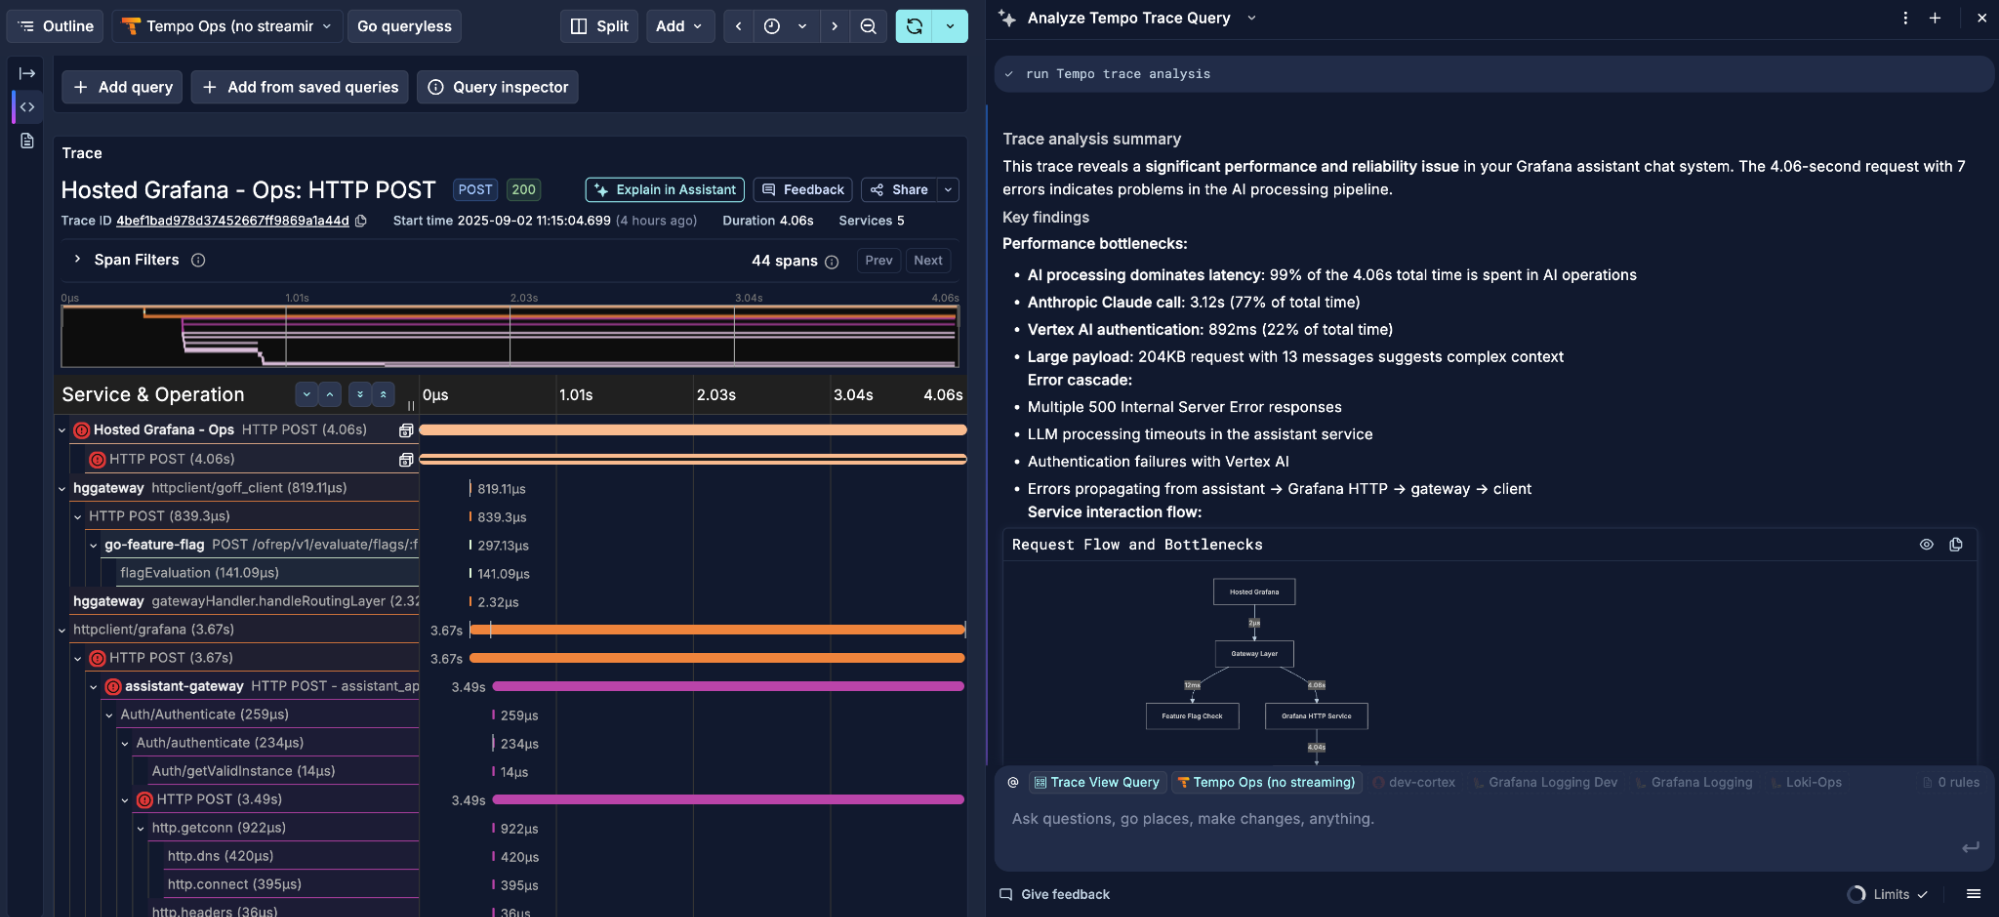
Explaining what the hell your traces mean. We had this latency spike last week and I was staring at a distributed trace with like 50 spans trying to figure out where time was getting wasted. Asked the Assistant to "analyze this trace" and it basically said "your database connection pool is getting hammered, here's the specific span where it's choking." Saved me from manually calculating span durations like an idiot.

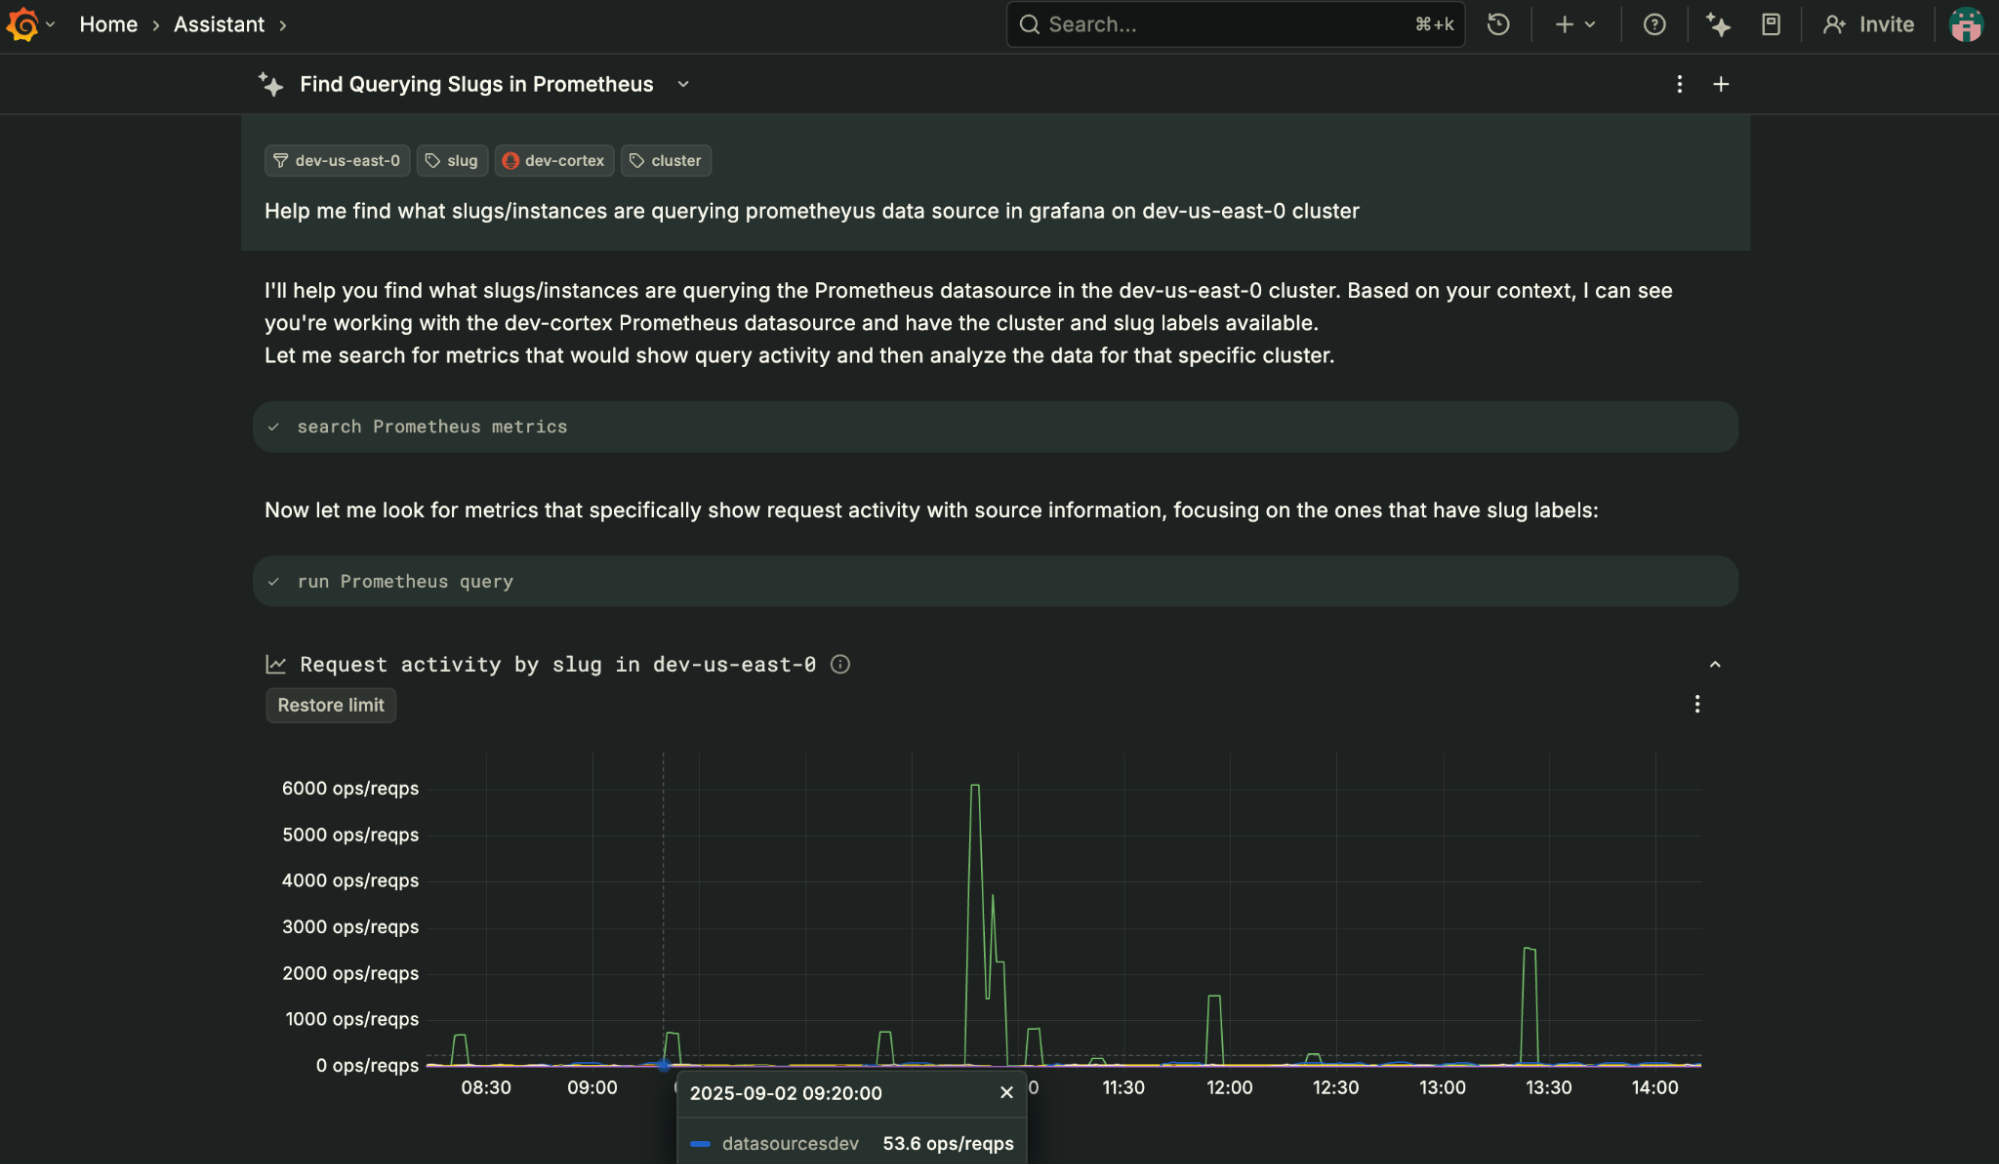
Finding data when you know it exists but forgot the labels. Sarah Zinger mentioned she needed to find customers in a specific region running a certain Grafana version but couldn't remember the exact LogQL query. Assistant figured out the right LogQL in seconds instead of her burning 30 minutes trial-and-erroring through label names.

Real-World Query Generation

When you're staring at a dashboard trying to remember PromQL syntax, this is where the Assistant actually shines. You type something like "show HTTP errors by service" and get back working PromQL that you can actually use.

When It Gets Confused

Complex multi-step correlations. If you're trying to do something really fancy like correlate network errors with specific Kubernetes node restarts during deployment windows, it sometimes generates queries that look right but miss edge cases. You still need to understand what you're actually monitoring.

Brand new features or your weird custom shit. The AI training doesn't know about the latest Grafana features or your janky custom exporters. Just last week it suggested using absent_over_time() which doesn't work in newer Prometheus versions - wasted 20 minutes figuring out why my query kept failing with some cryptic parse error.

Debugging the AI's own mistakes. Sometimes it generates syntactically correct PromQL that's logically wrong for what you asked. Like it'll give you rate() when you actually wanted increase(), and you have to catch that yourself. Worse, it once generated a query that looked perfect but was missing the [5m] range selector, so I got this cryptic error: invalid parameter 'query': 1:1: parse error: unexpected identifier "http_requests_total" and spent forever figuring out what was wrong.

Real Problems It Solves

Grafana Dashboard with AI Chat

The biggest win is onboarding new people. Kevin Adams said he got productive way faster by asking the Assistant questions instead of reading generic docs for hours or bothering teammates every 5 minutes. That's actually huge for teams.

Dashboard maintenance becomes less tedious. Piotr Jamróz needed to update thresholds across multiple panels and just described the change instead of manually editing each one. The Assistant generated the bulk updates, which is pretty neat when you have 50+ panels to modify.

The Security Angle

Prometheus Dashboard Overview

They claim your data doesn't get stored or used for training, which is good because we've all seen what happens when AI companies hoover up everything. Each conversation is supposedly isolated, and it meets the usual compliance checkbox stuff (SOC 2 Type II, GDPR, etc.).

Your data only gets accessed through the same permissions you already have, so it's not like the AI can see stuff you can't. Still, if you're paranoid about sending telemetry to an AI, you might want to stick to the open source LLM plugin where you control the AI provider.

Bottom Line

Is it perfect? Hell no. Does it hallucinate and generate broken queries sometimes? Yeah. But I use it multiple times a day instead of googling PromQL syntax or asking "how do I write this query" on Slack for the hundredth time.

The key thing is it's built into where you're already working instead of being another tool you have to context-switch to. When you're debugging at 3am trying to figure out why your API is slow, having an AI that knows your data sources right there beats opening 15 Stack Overflow tabs.

How AI Monitoring Actually Compares (The Real Deal)

Feature

Grafana Assistant

Traditional Approach

DataDog AI

New Relic AI

Query Help

Pretty good at PromQL/LogQL, dogshit at complex stuff

Google + Stack Overflow + 47 open tabs

Decent but locked to DataDog Query Language

Basic suggestions, mostly NRQL focused

Context Understanding

Knows your actual data sources and dashboards

You dig through docs yourself

Good within DataDog's ecosystem, blind outside it

Stays in New Relic bubble

Dashboard Building

Can create panels from natural language

Click and configure everything manually

Template-based, some AI suggestions

Wizard-driven, getting better

Error Analysis

Actually helpful at explaining traces and logs

Manual log parsing until you cry

Good pattern matching, but expensive

Decent anomaly detection

Learning Curve

New people productive in days vs months

Hope someone on team knows PromQL

Easier than learning their query language manually

Less painful than raw NRQL

Cross-Signal Correlation

Works across metrics, logs, traces

You manually connect the dots

Limited to DataDog sources

Decent within New Relic data

What Actually Sucks

Hallucinates on edge cases, gets confused by complex queries

Takes forever to learn PromQL

AI costs more than a junior engineer's salary

Limited to their ecosystem

Pricing Model

Free (suspicious but verified)

Your time + tool costs

$200-500/month extra on already expensive platform

Additional AI license fees

Data Privacy

Claims no training on your data

No AI to worry about

Some data used for model improvement

Varies by feature

When Everything Breaks

Falls back to normal Grafana queries

Same debugging hell as always

Still locked into DataDog even when AI fails

Still stuck in New Relic bubble

How We Actually Use This Thing Day-to-Day

Real-time Observability Dashboard

After using Grafana Assistant for a few months, here's what it's actually good for and where it falls short. Skip the marketing bullshit - this is what happens in practice.

When You're On-Call and Everything's Broken

Traditional way (still do this sometimes):
Alert fires at 2am → check dashboard → write queries to correlate metrics → dig through logs → eventually find the issue after 30-45 minutes of panic

With AI assistance (when it works):
Alert fires → ask "explain this error spike and show me related logs" → get English explanation instead of raw data → maybe find root cause in 10 minutes if lucky, or get some bullshit generic AI response that wastes more time

Distributed Trace Analysis with AI

Real example that worked: We had a latency spike last week. Instead of manually calculating span durations across 50+ spans in a distributed trace, I clicked "Analyze this trace" and the Assistant basically said "your connection pool is choking on database calls, here's the specific bottleneck." Saved me from doing math at 3am.

When it doesn't work: Complex issues with weird timing or multiple cascading failures. The AI gets confused and gives you generic advice like "check your dependencies."

New Person Joins the Team

Old way: Senior engineer spends weeks teaching PromQL basics, explaining our dashboard setup, answering the same questions over and over.

With Assistant: Kevin Adams said he got productive way faster by asking the Assistant about his specific setup instead of reading generic docs for hours. Still bugged me with questions, just fewer of them.

Reality check: It's helpful for common queries, but new people still need to understand what they're actually monitoring. The AI can write the query, but it can't teach you why you need to monitor connection pool exhaustion vs CPU utilization.

Query Writing When You Blank on Syntax

The problem: You know you need label_replace() or group_left but can't remember the exact argument order. Normally you'd google it or ask someone.

AI solution: Ask "group status codes by first digit" and get working PromQL. Dafydd Thomas mentioned using it constantly for this exact thing.

Where it breaks: Really complex multi-step queries with edge cases. Sometimes it generates syntactically correct PromQL that's logically fucked for what you actually want to measure.

Dashboard Maintenance Hell

Tedious task: Piotr Jamróz needed to update thresholds across multiple dashboard panels. Instead of clicking through each panel manually, he described the change and the Assistant generated the updates. Pretty neat when you have 50+ panels.

What actually helps: Bulk editing operations, changing query patterns across panels, updating time ranges consistently.

Still manual: Complex layout changes, custom visualizations, anything that requires understanding business context vs technical metrics.

Log Analysis When You're Confused

Common scenario: Error log with cryptic message, no obvious pattern. You stare at it hoping for insight.

AI approach: Click "Explain this log line" and get human-readable explanation of what the error means and potential causes.

Success rate: Pretty good for common error patterns, database connection issues, HTTP errors. Less helpful for application-specific errors or business logic problems.

The Onboarding Acceleration Thing

Testimonial reality: Instead of spending hours bugging teammates with "how do I query for X" questions, new people can ask the Assistant directly. This is actually a big win for team productivity.

What it doesn't replace: Understanding your system architecture, knowing what metrics matter for your business, learning when something is actually broken vs just noisy.

Cross-Team Knowledge Sharing

David Tupper from Solutions Engineering can answer customer migration questions immediately instead of hunting down subject matter experts. That's genuinely useful for customer-facing roles.

The democratization effect: Junior engineers can write queries that used to require the "PromQL expert." Senior engineers spend less time on syntax help, more time on architecture.

Limitations: The AI doesn't understand your business context or unusual monitoring requirements. It's great for standard patterns, less helpful for edge cases specific to your environment.

Cost and Performance Debugging

Where it might help: Identifying high-cardinality metrics, suggesting query optimizations for slow dashboards.

Reality: I haven't used these features much yet. The cost analysis stuff requires understanding your specific data patterns, which is hard to generalize with AI.

Bottom Line on Daily Usage

Use it for: Quick query generation, explaining confusing logs/traces, onboarding new team members, bulk dashboard updates.

Don't rely on it for: Complex troubleshooting, business-specific monitoring requirements, anything mission-critical without human verification.

The key insight is it's not trying to replace monitoring expertise - it's trying to reduce the tedious parts so you can focus on the actual problems. When it works, it saves real time. When it doesn't, you fall back to the normal approach.

Questions Engineers Actually Ask About Grafana Assistant

Q

Does this AI thing hallucinate and waste my time?

A

Yeah, it hallucinates and generates broken queries sometimes. Last week it suggested absent_over_time() which doesn't work in newer Prometheus versions. Wasted 20 minutes figuring out why my query kept shitting out with parse error.

It's usually good with common PromQL patterns but can generate syntactically correct queries that are logically wrong. Like it gives you rate() when you actually wanted increase(), or forgets the [5m] range selector and you get cryptic errors.

Reality check: Always test AI-generated queries. Don't put them straight into production alerts or you'll get paged at 3am for bullshit.

Q

How much does it actually cost? (No marketing bullshit)

A

It's actually free. I was suspicious too, but I checked their billing docs and there are no hidden charges or usage limits for the AI features. Of course, you still pay for the underlying Grafana Cloud data ingestion if you're pushing serious volumes.

Catch: Free only matters if you're already using or planning to use Grafana Cloud. If you're locked into DataDog or New Relic, this doesn't help you.

Q

Will this AI learn from my company's sensitive data?

A

They claim no data persistence and that conversations don't get used for training. Each session is supposedly isolated. Meets the usual compliance stuff (SOC 2 Type II, GDPR).

Paranoid mode: If you're worried about sending telemetry to an AI, use the open source LLM plugin instead where you control the AI provider.

Q

Can I use this with self-hosted Grafana?

A

Nope, Assistant only works in Grafana Cloud. But there's an LLM plugin for self-hosted that connects to OpenAI/Azure OpenAI, plus an MCP server for external AI tools.

Trade-off: Cloud-only means you don't control the AI infrastructure, but you also don't have to manage it yourself.

Q

Does it work with all the different query languages?

A

Pretty good with PromQL, LogQL, TraceQL, and basic SQL. Less reliable with complex KQL for Azure sources or weird proprietary data source queries.

Best results: Stick to common patterns in mainstream query languages. Gets confused with edge cases or really specific syntax.

Q

Can this replace learning PromQL properly?

A

No. It's like having an expert looking over your shoulder helping with syntax, but you still need to understand what metrics make sense to monitor and when something is actually broken.

Learning effect: You might pick up query patterns from using it, but don't expect to become a PromQL expert just from AI-generated queries.

Q

What happens when it doesn't understand what I want?

A

Sometimes it asks clarifying questions, sometimes it just generates something vaguely related to your request. The conversational aspect is hit-or-miss.

Pro tip: Be specific about your data sources, metric names, and what you're trying to measure. "Show error rates" is too vague; "Show HTTP 5xx error rate by service from my Prometheus metrics" works better.

Q

How long does onboarding actually take with AI help?

A

The claim is 3-4 weeks instead of 3-4 months. That seems roughly right for query writing, but new people still need to learn your system architecture and what matters to monitor.

Real time savings: Reduced "how do I write this query" questions to senior engineers. New hires can be productive with dashboards much faster.

Q

Does it work with my existing alerts and dashboards?

A

Yeah, it can explain existing panels and suggest improvements. Helpful for understanding dashboards someone else built.

Limitation: Doesn't understand your business context, so it can't tell you if your alert thresholds actually make sense for your application.

Q

What's it actually good at vs where it sucks?

A

Good at: Common PromQL patterns, explaining traces and logs, bulk dashboard operations, reducing syntax-lookup time.

Sucks at: Complex business logic, multi-step correlations with timing dependencies, anything requiring deep knowledge of your specific system.

Q

How does this compare to DataDog's or New Relic's AI?

A

DataDog's AI features are pretty good but cost extra on top of their already expensive platform. New Relic has decent AI for their ecosystem. Grafana's advantage is it's free and works across any data sources you can connect to Grafana.

Lock-in factor: Grafana AI works with your existing data sources; the others only work within their ecosystems.

Q

Will it automatically fix problems or take actions?

A

No, it's conversational help, not autonomous action. It suggests queries and explanations but doesn't modify your infrastructure or alerts without you explicitly telling it to.

Philosophy: Human-in-the-loop approach. The AI helps you understand and generate queries, but you decide what to do with them.

Essential Resources for Grafana Cloud AI Features

Related Tools & Recommendations

integration
Recommended

GitOps Integration Hell: Docker + Kubernetes + ArgoCD + Prometheus

How to Wire Together the Modern DevOps Stack Without Losing Your Sanity

kubernetes
/integration/docker-kubernetes-argocd-prometheus/gitops-workflow-integration
100%
integration
Recommended

Kafka + MongoDB + Kubernetes + Prometheus Integration - When Event Streams Break

When your event-driven services die and you're staring at green dashboards while everything burns, you need real observability - not the vendor promises that go

Apache Kafka
/integration/kafka-mongodb-kubernetes-prometheus-event-driven/complete-observability-architecture
74%
integration
Recommended

RAG on Kubernetes: Why You Probably Don't Need It (But If You Do, Here's How)

Running RAG Systems on K8s Will Make You Hate Your Life, But Sometimes You Don't Have a Choice

Vector Databases
/integration/vector-database-rag-production-deployment/kubernetes-orchestration
55%
integration
Recommended

ELK Stack for Microservices - Stop Losing Log Data

How to Actually Monitor Distributed Systems Without Going Insane

Elasticsearch
/integration/elasticsearch-logstash-kibana/microservices-logging-architecture
52%
tool
Recommended

Datadog Cost Management - Stop Your Monitoring Bill From Destroying Your Budget

competes with Datadog

Datadog
/tool/datadog/cost-management-guide
38%
pricing
Recommended

Datadog vs New Relic vs Sentry: Real Pricing Breakdown (From Someone Who's Actually Paid These Bills)

Observability pricing is a shitshow. Here's what it actually costs.

Datadog
/pricing/datadog-newrelic-sentry-enterprise/enterprise-pricing-comparison
38%
pricing
Recommended

Datadog Enterprise Pricing - What It Actually Costs When Your Shit Breaks at 3AM

The Real Numbers Behind Datadog's "Starting at $23/host" Bullshit

Datadog
/pricing/datadog/enterprise-cost-analysis
38%
tool
Recommended

New Relic - Application Monitoring That Actually Works (If You Can Afford It)

New Relic tells you when your apps are broken, slow, or about to die. Not cheap, but beats getting woken up at 3am with no clue what's wrong.

New Relic
/tool/new-relic/overview
38%
alternatives
Recommended

OpenTelemetry Alternatives - For When You're Done Debugging Your Debugging Tools

I spent last Sunday fixing our collector again. It ate 6GB of RAM and crashed during the fucking football game. Here's what actually works instead.

OpenTelemetry
/alternatives/opentelemetry/migration-ready-alternatives
38%
tool
Recommended

OpenTelemetry - Finally, Observability That Doesn't Lock You Into One Vendor

Because debugging production issues with console.log and prayer isn't sustainable

OpenTelemetry
/tool/opentelemetry/overview
38%
integration
Recommended

OpenTelemetry + Jaeger + Grafana on Kubernetes - The Stack That Actually Works

Stop flying blind in production microservices

OpenTelemetry
/integration/opentelemetry-jaeger-grafana-kubernetes/complete-observability-stack
38%
tool
Recommended

Splunk - Expensive But It Works

Search your logs when everything's on fire. If you've got $100k+/year to spend and need enterprise-grade log search, this is probably your tool.

Splunk Enterprise
/tool/splunk/overview
34%
tool
Recommended

Dynatrace Enterprise Implementation - The Real Deployment Playbook

What it actually takes to get this thing working in production (spoiler: way more than 15 minutes)

Dynatrace
/tool/dynatrace/enterprise-implementation-guide
34%
tool
Recommended

Dynatrace - Monitors Your Shit So You Don't Get Paged at 2AM

Enterprise APM that actually works (when you can afford it and get past the 3-month deployment nightmare)

Dynatrace
/tool/dynatrace/overview
34%
alternatives
Recommended

Docker Alternatives That Won't Break Your Budget

Docker got expensive as hell. Here's how to escape without breaking everything.

Docker
/alternatives/docker/budget-friendly-alternatives
34%
compare
Recommended

I Tested 5 Container Security Scanners in CI/CD - Here's What Actually Works

Trivy, Docker Scout, Snyk Container, Grype, and Clair - which one won't make you want to quit DevOps

docker
/compare/docker-security/cicd-integration/docker-security-cicd-integration
34%
tool
Popular choice

Aider - Terminal AI That Actually Works

Explore Aider, the terminal-based AI coding assistant. Learn what it does, how to install it, and get answers to common questions about API keys and costs.

Aider
/tool/aider/overview
34%
integration
Recommended

Jenkins + Docker + Kubernetes: How to Deploy Without Breaking Production (Usually)

The Real Guide to CI/CD That Actually Works

Jenkins
/integration/jenkins-docker-kubernetes/enterprise-ci-cd-pipeline
31%
tool
Recommended

Jenkins Production Deployment - From Dev to Bulletproof

integrates with Jenkins

Jenkins
/tool/jenkins/production-deployment
31%
tool
Recommended

Jenkins - The CI/CD Server That Won't Die

integrates with Jenkins

Jenkins
/tool/jenkins/overview
31%

Recommendations combine user behavior, content similarity, research intelligence, and SEO optimization