Bundle Size Optimization - What Actually Breaks in Production

Most production builds fail because nobody optimizes for the stuff that breaks at scale. Your 500KB bundle works fine in dev but tanks performance when 10,000 users hit your site simultaneously. Bundle analysis tools show you where the fat is, but you need to know what to do about it. The esbuild API documentation covers optimization flags, while performance benchmarks demonstrate real-world impact. Tools like Bundlephobia help you evaluate package costs before installation, and webpack-bundle-analyzer can analyze esbuild metafiles for cross-tool comparison.

The esbuild bundle analyzer provides a treemap visualization of your bundle contents, showing exactly which dependencies consume the most space.

Metafile Analysis - Find What's Actually Breaking Your Bundle

The --metafile flag generates bundle analysis data that shows you exactly where your bytes went:

esbuild src/index.ts --bundle --metafile=meta.json --outfile=dist/bundle.js

This creates a JSON file you can upload to esbuild's bundle analyzer or analyze with custom scripts. Found out we were shipping moment.js (90KB), date-fns (40KB), AND native Date methods because three different developers added date handling without checking what already existed. Bundle analyzer showed 130KB of date manipulation code for a fucking contact form. Tools like npm-check-duplicates and depcheck can identify these issues automatically.

Critical Analysis Points:

  • Entry point bloat: Single entry point importing everything kills performance
  • Duplicate dependencies: Multiple versions of React, lodash, etc.
  • Tree shaking failures: Unused exports still being bundled
  • Dynamic import abuse: import() calls creating tiny, useless chunks

Code Splitting - When It Works and When It Breaks Your App

esbuild's code splitting can dramatically reduce initial bundle size, but it fails spectacularly if you don't understand how it works. The MDN dynamic imports guide explains browser support, while HTTP/2 multiplexing documentation shows why multiple requests can actually be faster than single large bundles.

## This splits shared dependencies automatically
esbuild src/page1.ts src/page2.ts --bundle --splitting --outdir=dist --format=esm

Code splitting wins:

  • Shared dependency extraction: Common libs like React get their own chunk
  • Route-based splitting: Each page/route loads only what it needs
  • Lazy loading: import() creates separate bundles for on-demand loading

Code splitting disasters I've witnessed:

  • Enabled splitting, forgot format=esm, got "Uncaught SyntaxError: Unexpected token 'export'" on deploy
  • Created 247 chunks for a medium-sized app - each HTTP request cost more than the bundle savings
  • Dynamic imports returned 404s because CloudFront wasn't serving .js files as ES modules
// This creates efficient splitting
const LazyComponent = React.lazy(() => import('./components/HeavyChart'))

// This creates splitting hell
const { utilityFunction } = await import('./utils/tiny-helper')

Minification Beyond the Default Settings

esbuild's --minify flag handles JavaScript minification, but production optimization requires more:

## Standard minification (good start)
esbuild src/index.ts --bundle --minify --outfile=dist/bundle.js

## Production-ready minification (better)
esbuild src/index.ts --bundle --minify --target=es2020 --drop:console --drop:debugger --outfile=dist/bundle.js

Advanced minification stuff:

  • --drop:console removes all console.log() calls from production
  • --drop:debugger strips debugger statements
  • --target=es2020 uses modern syntax to reduce bundle size - big win here
  • --legal-comments=none removes license comments from final bundle

The --target setting makes a huge difference - set it to something modern like es2020 and esbuild skips a ton of polyfills, uses native syntax that's way smaller and faster.

Tree Shaking - Making It Actually Work

esbuild's tree shaking works well by default, but many projects accidentally break it:

Tree shaking works when:

  • You use ES modules (import/export) consistently
  • Your dependencies properly mark side effects in package.json
  • You import specific functions: import { debounce } from 'lodash-es'

Tree shaking fails when:

  • You mix CommonJS and ES modules carelessly
  • Dependencies don't properly declare side effects
  • You use barrel imports: import { debounce } from 'lodash-es/index.js'
// This tree shakes well - only debounce gets bundled
import { debounce } from 'lodash-es'

// This imports the entire lodash library
import _ from 'lodash'
const debouncedFn = _.debounce(fn, 100)

Switched from import _ from 'lodash' to import { debounce } from 'lodash-es' and watched the bundle drop from 850KB to 180KB. Still not small but holy shit, what a difference. The ES module version actually tree shakes while CommonJS drags in the entire fucking library.

Tree shaking effectiveness varies dramatically between module formats - ES modules enable aggressive dead code elimination while CommonJS imports often bundle entire libraries regardless of actual usage.

External Dependencies - What to Bundle vs. What to Leave Out

The --external flag tells esbuild not to bundle certain dependencies, which can dramatically improve build performance and enable better caching:

## Keep React external for CDN caching
esbuild src/index.tsx --bundle --external:react --external:react-dom --outfile=dist/bundle.js

When to externalize:

  • Large stable libraries: React, Vue, Angular - rarely change, better from CDN
  • Node.js built-ins: fs, path, etc. for server-side builds
  • Polyfills: Let the browser handle modern features natively

When to bundle everything:

  • Small applications: Fewer HTTP requests often wins
  • Unreliable CDNs: Don't trust external resources for critical apps
  • Corporate environments: Strict security policies may block CDNs

The decision depends on your caching strategy. If you have good CDN coverage and long cache times, externalize big dependencies. If you control the entire stack, bundle everything and cache the whole bundle.

Platform-Specific Optimizations

esbuild's --platform flag changes how it optimizes code for different environments:

## Browser optimization (default)
esbuild src/app.ts --bundle --platform=browser --outfile=dist/browser.js

## Node.js optimization
esbuild src/server.ts --bundle --platform=node --outfile=dist/server.js

Browser platform optimizations:

  • Polyfills browser APIs automatically
  • Removes Node.js-specific code and dependencies
  • Optimizes for smaller bundle sizes
  • Handles ES modules and dynamic imports properly

Node.js platform optimizations:

  • Preserves Node.js built-in imports (require('fs'))
  • Skips browser polyfills that don't work in Node
  • Optimizes for faster startup time over smaller size
  • Handles CommonJS module resolution properly

Get the platform wrong and production dies in weird ways. Set platform=node for browser code and get "ReferenceError: process is not defined" errors. Set platform=browser for server code and watch it crash on startup with "Cannot read property 'readFileSync' of undefined".
Production Build Optimization Comparison

Optimization Technique

esbuild Impact

Webpack Equivalent

Bundle Size Reduction

Build Time Impact

Production Risk

Basic Minification (--minify)

⭐⭐⭐⭐⭐

optimization.minimize: true

30-40% reduction

Negligible

Very Low

Tree Shaking (automatic)

⭐⭐⭐⭐

optimization.usedExports: true

10-60% reduction

None

Low

Code Splitting (--splitting)

⭐⭐⭐

optimization.splitChunks

20-50% initial load

+10% build time

Medium

External Dependencies (--external)

⭐⭐⭐⭐

externals config

40-80% reduction

-30% build time

Medium

Target Optimization (--target=es2020)

⭐⭐⭐⭐

@babel/preset-env

15-25% reduction

None

Low

Drop Console Logs (--drop:console)

⭐⭐

terser-webpack-plugin

2-5% reduction

None

Low

Compression (Gzip/Brotli)

⭐⭐⭐⭐⭐

Same post-build

60-70% network size

N/A

Very Low

Performance Monitoring and Build Pipeline Integration

What breaks in production isn't the obvious stuff - it's the edge cases that only show up under load. Here's how to monitor your esbuild optimizations and integrate them into CI/CD pipelines that actually catch problems before they hit users. If you want to catch problems before users do, you need Lighthouse CI for performance regression tracking, WebPageTest API for real user metrics, and Bundle Buddy for analyzing code splitting effectiveness. Error tracking services like Sentry and LogRocket help identify when optimizations break user experience.

Bundle Size Monitoring That Catches Bloat Before Deploy

Your bundle size shouldn't be a surprise when you deploy. Set up automated bundle size tracking to catch regressions:

## Generate metafile for CI analysis
esbuild src/index.ts --bundle --metafile=build/meta.json --outfile=dist/bundle.js

## Extract bundle size for comparison
node -e "console.log(JSON.stringify({size: require('fs').statSync('dist/bundle.js').size}))" > build/bundle-size.json

Critical monitoring points:

  • Total bundle size: Set hard limits (e.g., 500KB gzipped max)
  • Chunk size distribution: Watch for individual chunks growing too large
  • Dependency growth: Track when new deps get added accidentally
  • Tree shaking effectiveness: Monitor unused code percentage

I've seen teams add a single import that increased bundle size by 200KB because it pulled in an entire charting library when they only needed one utility function. Automated size checks prevent these disasters. Tools like size-limit provide performance budget enforcement, while bundlesize integrates with CI systems. The GitHub Actions marketplace offers multiple bundle analysis actions, and Vercel's bundle analysis provides deployment-time size monitoring.

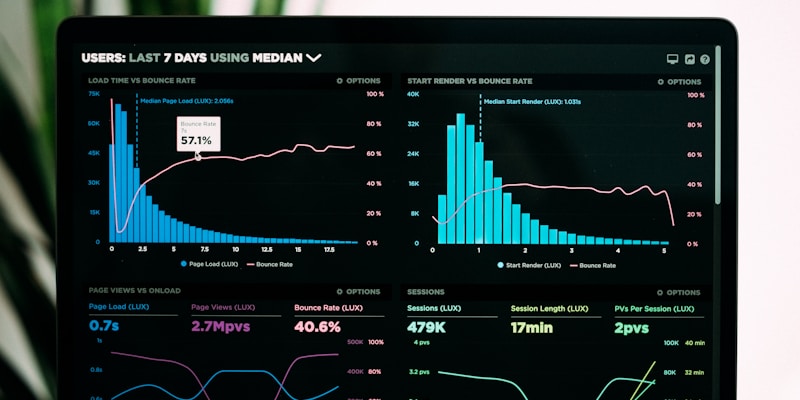
Bundle Size Monitoring Dashboard

CI/CD Pipeline Configuration for Production Builds

Your build pipeline needs to catch optimization failures before they reach production. Here's a production-ready GitHub Actions workflow:

name: Production Build
on:
  push:
    branches: [main]
  pull_request:
    branches: [main]

jobs:
  build-and-analyze:
    runs-on: ubuntu-latest
    steps:
      - uses: actions/checkout@v4
      
      - name: Setup Node.js
        uses: actions/setup-node@v4
        with:
          node-version: '20'
          cache: 'npm'
      
      - name: Install dependencies
        run: npm ci
      
      - name: Build with esbuild
        run: |
          esbuild src/index.ts \
            --bundle \
            --minify \
            --target=es2020 \
            --drop:console \
            --splitting \
            --format=esm \
            --outdir=dist \
            --metafile=meta.json
      
      - name: Analyze bundle size
        run: |
          BUNDLE_SIZE=$(stat -f%z dist/index.js)
          echo "Bundle size: $BUNDLE_SIZE bytes"
          if [ $BUNDLE_SIZE -gt 500000 ]; then
            echo "Bundle size exceeds limit!"
            exit 1
          fi
      
      - name: Upload bundle analysis
        uses: actions/upload-artifact@v4
        with:
          name: bundle-analysis
          path: meta.json

Pipeline stages that prevent production disasters:

  1. Dependency audit: Check for security vulnerabilities and license compliance
  2. Bundle size limits: Hard fail if bundles exceed thresholds
  3. Performance regression tests: Compare build times against baseline
  4. Compression analysis: Verify Gzip/Brotli ratios meet expectations

Source Map Configuration for Production Debugging

Source maps in production are controversial - they help debugging but expose source code. Here's how to configure them properly:

## External source maps (recommended for production)
esbuild src/index.ts --bundle --minify --sourcemap=external --outfile=dist/bundle.js

## Inline source maps (debugging ease, larger files)
esbuild src/index.ts --bundle --minify --sourcemap=inline --outfile=dist/bundle.js

## Linked source maps (good compromise)
esbuild src/index.ts --bundle --minify --sourcemap=linked --outfile=dist/bundle.js

Production source map strategies:

  • External maps: Upload to error tracking service (Sentry, Bugsnag) but don't serve to users
  • Conditional serving: Only serve source maps to authenticated developers
  • Source map URLs: Point to internal servers not accessible externally
  • Build-time stripping: Remove source map comments in production builds

Performance Budget Implementation

Set performance budgets that fail builds when exceeded. This prevents gradual bundle bloat:

{
  "scripts": {
    "build": "node scripts/build-with-budget.js",
    "analyze": "node scripts/analyze-bundle.js"
  }
}
// scripts/build-with-budget.js
const esbuild = require('esbuild')
const fs = require('fs')

const BUDGET_LIMITS = {
  maxBundleSize: 500 * 1024, // 500KB
  maxChunkSize: 200 * 1024,  // 200KB  
  maxAssetSize: 100 * 1024   // 100KB
}

async function buildWithBudget() {
  const result = await esbuild.build({
    entryPoints: ['src/index.ts'],
    bundle: true,
    minify: true,
    splitting: true,
    format: 'esm',
    outdir: 'dist',
    metafile: true
  })

  // Check bundle sizes against budget
  Object.entries(result.metafile.outputs).forEach(([path, output]) => {
    const size = output.bytes
    const filename = path.replace('dist/', '')
    
    if (filename.endsWith('.js') && size > BUDGET_LIMITS.maxBundleSize) {
      console.error(`❌ Bundle ${filename} (${size} bytes) exceeds budget (${BUDGET_LIMITS.maxBundleSize} bytes)`)
      process.exit(1)
    }
  })
  
  console.log('✅ All bundles within performance budget')
}

buildWithBudget()

Deployment Optimization Strategies

Production deployments need more than just optimized bundles - they need optimized delivery:

CDN Configuration:

## Nginx configuration for esbuild assets
location ~* \.(js|css|map)$ {
    expires 1y;
    add_header Cache-Control "public, immutable";
    gzip_static on;
    brotli_static on;
}

## Handle code splitting with proper headers  
location ~* /chunks/.*\.js$ {
    expires 1y;
    add_header Cache-Control "public, immutable";
    add_header X-Content-Type-Options nosniff;
}

HTTP/2 Push Configuration:
Since esbuild creates predictable chunk patterns, you can preload critical chunks:

<!-- Preload critical chunks -->
<link rel="modulepreload" href="/chunks/vendor-react.js">
<link rel="modulepreload" href="/chunks/vendor-utils.js">
<link rel="modulepreload" href="/main.js">

Error Monitoring Integration

Connect your build analytics to production error monitoring:

// Monitor chunk loading failures
window.addEventListener('error', (event) => {
  if (event.filename && event.filename.includes('/chunks/')) {
    // Track chunk loading failures
    analytics.track('chunk_load_failed', {
      chunk: event.filename,
      error: event.message,
      userAgent: navigator.userAgent
    })
  }
})

// Monitor dynamic import failures  
const originalImport = window.import
window.import = function(specifier) {
  return originalImport(specifier).catch(error => {
    analytics.track('dynamic_import_failed', {
      specifier,
      error: error.message
    })
    throw error
  })
}

Production monitoring checklist:

  • Bundle loading success rates: Track failed chunk downloads
  • Import resolution failures: Monitor dynamic import() errors
  • Performance regression alerts: Watch for slow initial loads
  • Source map upload verification: Ensure debugging data is available

Remember: optimization without monitoring is just guessing. The goal isn't the smallest possible bundle - it's the fastest, most reliable user experience in production.

Production Optimization FAQ - What Actually Breaks

Q

Why is my production bundle 3x larger than webpack even with minification enabled?

A

You're probably importing wrong or missing tree shaking. esbuild minifies aggressively but can't remove code you actually imported. Like if you're doing import _ from 'lodash' instead of import { debounce } from 'lodash-es'

  • first one drags in the whole 60KB library, second just gets what you need. Changed import _ from 'lodash' to import { debounce } from 'lodash-es' and watched the bundle go from 850KB to 400KB. Also make sure you're using --bundle because without it esbuild does literally zero tree shaking.
Q

Does code splitting actually improve performance or just create more HTTP requests?

A

Depends on your setup.

Code splitting helps with HTTP/2 multiplexing but hurts with HTTP/1.1.

If you're on a modern CDN with HTTP/2, splitting lets users download only what they need. But if you create 50+ tiny chunks, the overhead kills performance. Sweet spot is 3-8 chunks: vendor libraries, main app code, and route-specific bundles. Measure actual load times, not just bundle sizes.

Q

Why does my build randomly fail with "cannot split chunks" errors?

A

Code splitting with --splitting requires --format=esm because Common

JS doesn't support dynamic imports properly. Your build fails because esbuild can't generate valid chunk loading code in CommonJS format. Either use ESM format consistently or disable splitting. Also, splitting breaks if you have circular dependencies

  • esbuild can't determine which chunk should own the shared code. Fix your imports first.
Q

Should I externalize React and other large dependencies for production?

A

Only if you have reliable CDN caching and HTTPS. Externalizing React saves 40KB from your bundle but adds a network request that can fail. If you control your CDN and have good cache hit rates, do it. If you're shipping to corporate networks with sketchy connectivity, bundle everything. The performance gain from CDN caching usually beats the cost of extra requests, but measure your actual user experience.

Q

How do I debug production issues when minification breaks everything?

A

Enable external source maps with --sourcemap=external and upload them to your error tracking service. Don't serve source maps to users

  • point them to internal URLs that require authentication. Source maps add 30% to build time but save hours of debugging headaches. Set up proper error boundaries in React and monitor chunk loading failures
  • they're common with code splitting.
Q

What's the fastest way to identify what's making my bundle huge?

A

Use --metafile=meta.json and upload to esbuild's bundle analyzer.

Sort by size descending and look for surprises. Common culprits: multiple copies of React (check npm ls react), entire icon libraries for single icons, moment.js when you only need date formatting, and polyfills you don't need with modern browser targets. Fix the biggest problems first

  • optimizing tiny modules wastes time.
Q

Can I use esbuild's production optimizations with Next.js or Create React App?

A

Next.js uses its own bundler (webpack/Turbopack) so you can't directly replace it with esbuild, but you can use esbuild for library builds or standalone components. Create React App is harder to customize, but tools like craco can swap in esbuild. For greenfield projects, skip both and use Vite which gives you esbuild optimization with better dev experience.

Q

Why do my builds work locally but fail in production/CI?

A

Node version mismatches or missing deps in CI. esbuild needs Node 16+ but CircleCI was running Node 14.18 and choking on ES modules with "Unexpected token 'export'" errors. Spent 3 hours before checking the Node version. Pin with .nvmrc or suffer like I did. Also check if you have dev dependencies needed for builds

  • some teams accidentally put esbuild in devDependencies when it should be in dependencies for production builds.
Q

What's the deal with tree shaking not working on my third-party libraries?

A

Many npm packages are badly configured for tree shaking. They don't mark side effects properly in package.json or export everything through barrel files that defeat optimization. Switch to -es variants when available (lodash-es instead of lodash), import from deep paths (import debounce from 'lodash/debounce'), or find better-maintained alternatives. Some packages will never tree shake

  • that's not esbuild's fault.
Q

How much should I expect bundle sizes to decrease with proper optimization?

A

Realistically? 40-60% smaller with tree shaking and modern targets. Our 680KB webpack bundle dropped to 280KB with esbuild + --target=es2020. Brotli compression got that down to 95KB over the wire, which was fucking amazing. But if your app legitimately needs 400KB of Java

Script, no bundler magic will save you. Don't expect miracles

  • if your app genuinely needs 200KB of JavaScript, optimization won't change that fundamentally.
Q

When should I choose webpack over esbuild for production?

A

Stick with webpack if you need extensive plugin ecosystems, custom loaders for weird file types, or complex module federation. esbuild wins on speed and simplicity but loses on configurability. For most single-page apps, esbuild handles production optimization better and faster. For complex enterprise setups with custom build requirements, webpack's flexibility might be worth the slower builds. Try esbuild first

  • migration back to webpack is easier than going the other direction.

Production Optimization Resources and Tools

Related Tools & Recommendations

tool
Similar content

TypeScript Compiler Performance: Fix Slow Builds & Optimize Speed

Practical performance fixes that actually work in production, not marketing bullshit

TypeScript Compiler
/tool/typescript/performance-optimization-guide
100%
tool
Similar content

Webpack Performance Optimization: Fix Slow Builds & Bundles

Optimize Webpack performance: fix slow builds, reduce giant bundle sizes, and implement production-ready configurations. Improve app loading speed and user expe

Webpack
/tool/webpack/performance-optimization
92%
tool
Similar content

Turbopack: Why Switch from Webpack? Migration & Future

Explore Turbopack's benefits over Webpack, understand migration, production readiness, and its future as a standalone bundler. Essential insights for developers

Turbopack
/tool/turbopack/overview
74%
review
Recommended

Vite vs Webpack vs Turbopack: Which One Doesn't Suck?

I tested all three on 6 different projects so you don't have to suffer through webpack config hell

Vite
/review/vite-webpack-turbopack/performance-benchmark-review
74%
tool
Similar content

esbuild: Extremely Fast JavaScript Bundler & Build Tool Overview

esbuild is stupid fast - like 100x faster than webpack stupid fast

esbuild
/tool/esbuild/overview
67%
tool
Similar content

mongoexport Performance Optimization: Speed Up Large Exports

Real techniques to make mongoexport not suck on large collections

mongoexport
/tool/mongoexport/performance-optimization
57%
tool
Similar content

Protocol Buffers: Troubleshooting Performance & Memory Leaks

Real production issues and how to actually fix them (not just optimize them)

Protocol Buffers
/tool/protocol-buffers/performance-troubleshooting
51%
integration
Recommended

SvelteKit + TypeScript + Tailwind: What I Learned Building 3 Production Apps

The stack that actually doesn't make you want to throw your laptop out the window

Svelte
/integration/svelte-sveltekit-tailwind-typescript/full-stack-architecture-guide
49%
tool
Similar content

Flutter Performance Optimization: Debug & Fix Issues with DevTools

Stop guessing why your app is slow. Debug frame drops, memory leaks, and rebuild hell with tools that work.

Flutter
/tool/flutter/performance-optimization
49%
tool
Similar content

Bun Production Optimization: Deploy Fast, Monitor & Fix Issues

Master Bun production deployments. Optimize performance, diagnose and fix common issues like memory leaks and Docker crashes, and implement effective monitoring

Bun
/tool/bun/production-optimization
47%
tool
Similar content

SolidJS Production Debugging: Fix Crashes, Leaks & Performance

When Your SolidJS App Dies at 3AM - The Debug Guide That Might Save Your Career

SolidJS
/tool/solidjs/debugging-production-issues
46%
troubleshoot
Similar content

React Performance Optimization: Fix Slow Loading & Bad UX in Production

Fix slow React apps in production. Discover the top 5 performance killers, get step-by-step optimization fixes, and learn prevention strategies for faster loadi

React
/troubleshoot/react-performance-optimization-production/performance-optimization-production
46%
tool
Similar content

Apache Cassandra Performance Optimization Guide: Fix Slow Clusters

Stop Pretending Your 50 Ops/Sec Cluster is "Scalable"

Apache Cassandra
/tool/apache-cassandra/performance-optimization-guide
46%
tool
Similar content

MariaDB Performance Optimization: Fix Slow Queries & Boost Speed

Learn to optimize MariaDB performance. Fix slow queries, tune configurations, and monitor your server to prevent issues and boost database speed effectively.

MariaDB
/tool/mariadb/performance-optimization
46%
tool
Similar content

Qwik Overview: Instant Interactivity with Zero JavaScript Hydration

Skip hydration hell, get instant interactivity

Qwik
/tool/qwik/overview
46%
compare
Recommended

I Benchmarked Bun vs Node.js vs Deno So You Don't Have To

Three weeks of testing revealed which JavaScript runtime is actually faster (and when it matters)

Bun
/compare/bun/node.js/deno/performance-comparison
44%
tool
Similar content

Optimize WebStorm Performance: Fix Memory & Speed Issues

Optimize WebStorm performance. Fix high RAM usage, memory leaks, and slow indexing. Discover advanced techniques and debugging tips for a faster, more efficient

WebStorm
/tool/webstorm/performance-optimization
42%
tool
Similar content

Express.js Production Guide: Optimize Performance & Prevent Crashes

I've debugged enough production fires to know what actually breaks (and how to fix it)

Express.js
/tool/express/production-optimization-guide
42%
tool
Similar content

PyTorch Production Deployment: Scale, Optimize & Prevent Crashes

The brutal truth about taking PyTorch models from Jupyter notebooks to production servers that don't crash at 3am

PyTorch
/tool/pytorch/production-deployment-optimization
39%
tool
Similar content

Node.js Performance Optimization: Boost App Speed & Scale

Master Node.js performance optimization techniques. Learn to speed up your V8 engine, effectively use clustering & worker threads, and scale your applications e

Node.js
/tool/node.js/performance-optimization
39%

Recommendations combine user behavior, content similarity, research intelligence, and SEO optimization