Production Performance Debugging That Actually Works
When your Flutter app is stuttering in production but runs perfectly in your development environment, you're dealing with the real performance issues that matter.
Here's how to find and fix them using tools that work, not just theoretical optimization advice.## The DevTools Memory Detective WorkflowStep 1: Reproduce the Issue LocallyNever debug performance in production.
Set up a local environment that mirrors production:bash# Profile mode gives you realistic performance without debug overheadflutter run --profile# For web performance issuesflutter run -d web-server --web-renderer canvaskit --profileProfile mode uses release-mode optimizations but keeps debugging symbols.
It's the sweet spot for performance analysis.**Step 2:
Take Before/After Memory Snapshots**Open DevTools Memory tab and: 1.
Take a snapshot before your performance issue occurs
2. Trigger the problematic workflow (navigate screens, scroll lists, etc.)3. Take another snapshot after the issue
4. Compare snapshots to see what's growing DevTools memory diff shows before/after snapshots to identify growing object counts and detect memory leaks in Flutter applications.
Look for:
- Widget counts increasing (state not being cleaned up)
- String/List objects growing (cached data not cleared)
- Image cache growing indefinitely (large images not disposed)In our e-commerce app, we found 200+
ProductCardwidgets staying in memory after navigation.
The culprit? Static references in our cart manager that prevented garbage collection.## Widget Rebuild Analysis That Finds Real ProblemsThe Widget Inspector's rebuild tracking shows you which parts of your UI are destroying performance: 1.
Enable "Track widget rebuilds" in DevTools
2. Interact with your app for 30 seconds
3. Look for widgets with high rebuild counts (>100 rebuilds typically indicates problems)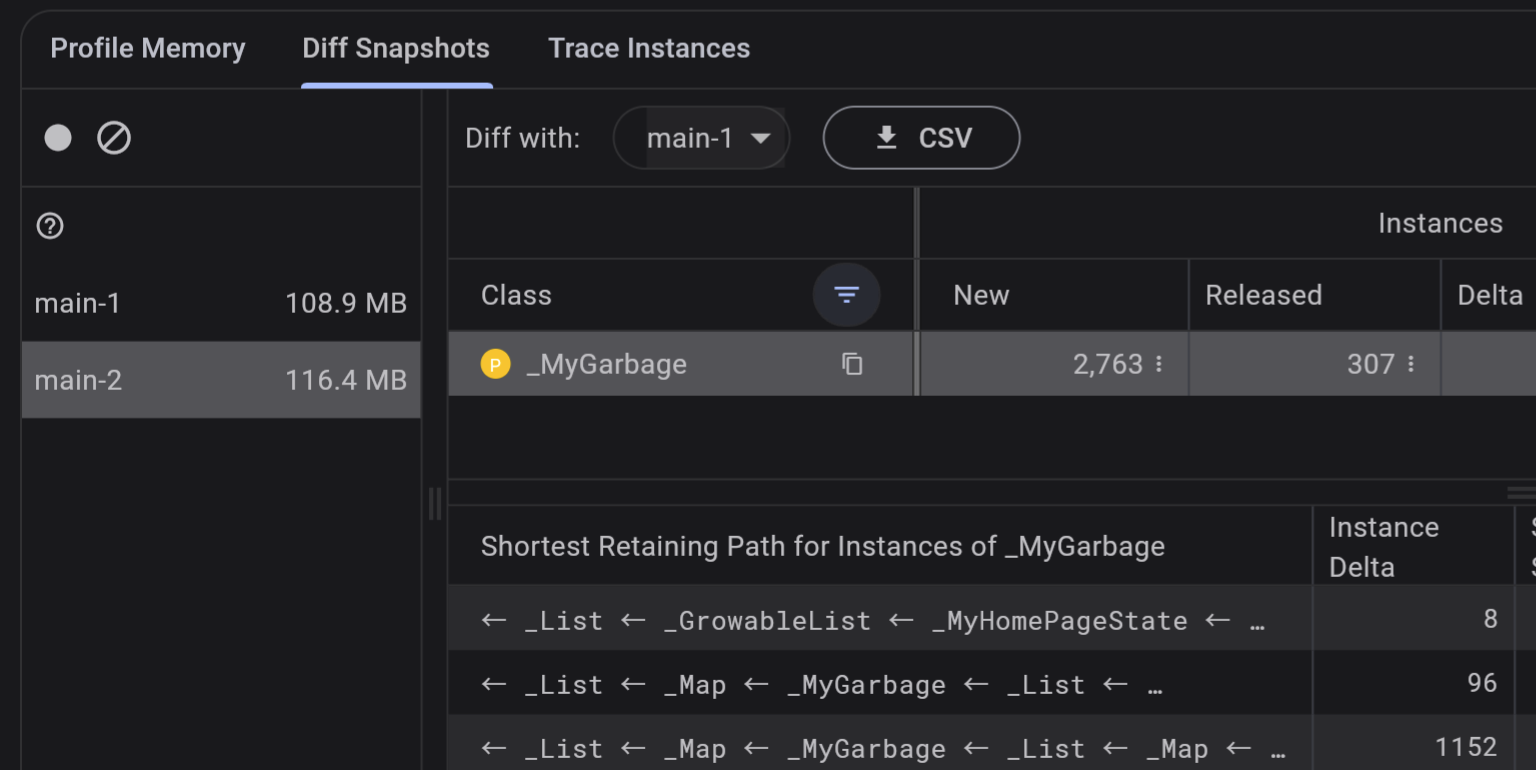 **Real Example:
Shopping Cart Counter Hell**Our app was rebuilding the entire product list every time someone updated the cart counter. The issue:```dart// BAD: setState in main widget rebuilds everythingclass ProductListScreen extends StatefulWidget { void updateCart() { setState(() => cartCount++); // Rebuilds 50+ product cards }}// GOOD:
Isolate state updatesclass ProductListScreen extends StatelessWidget { Widget build(context) { return Column([ Consumer
Counter(cart.itemCount) ), const ProductGrid(), // This stays const, never rebuilds ]); }}```The fix reduced rebuilds from 2,000+ per minute to under 50.
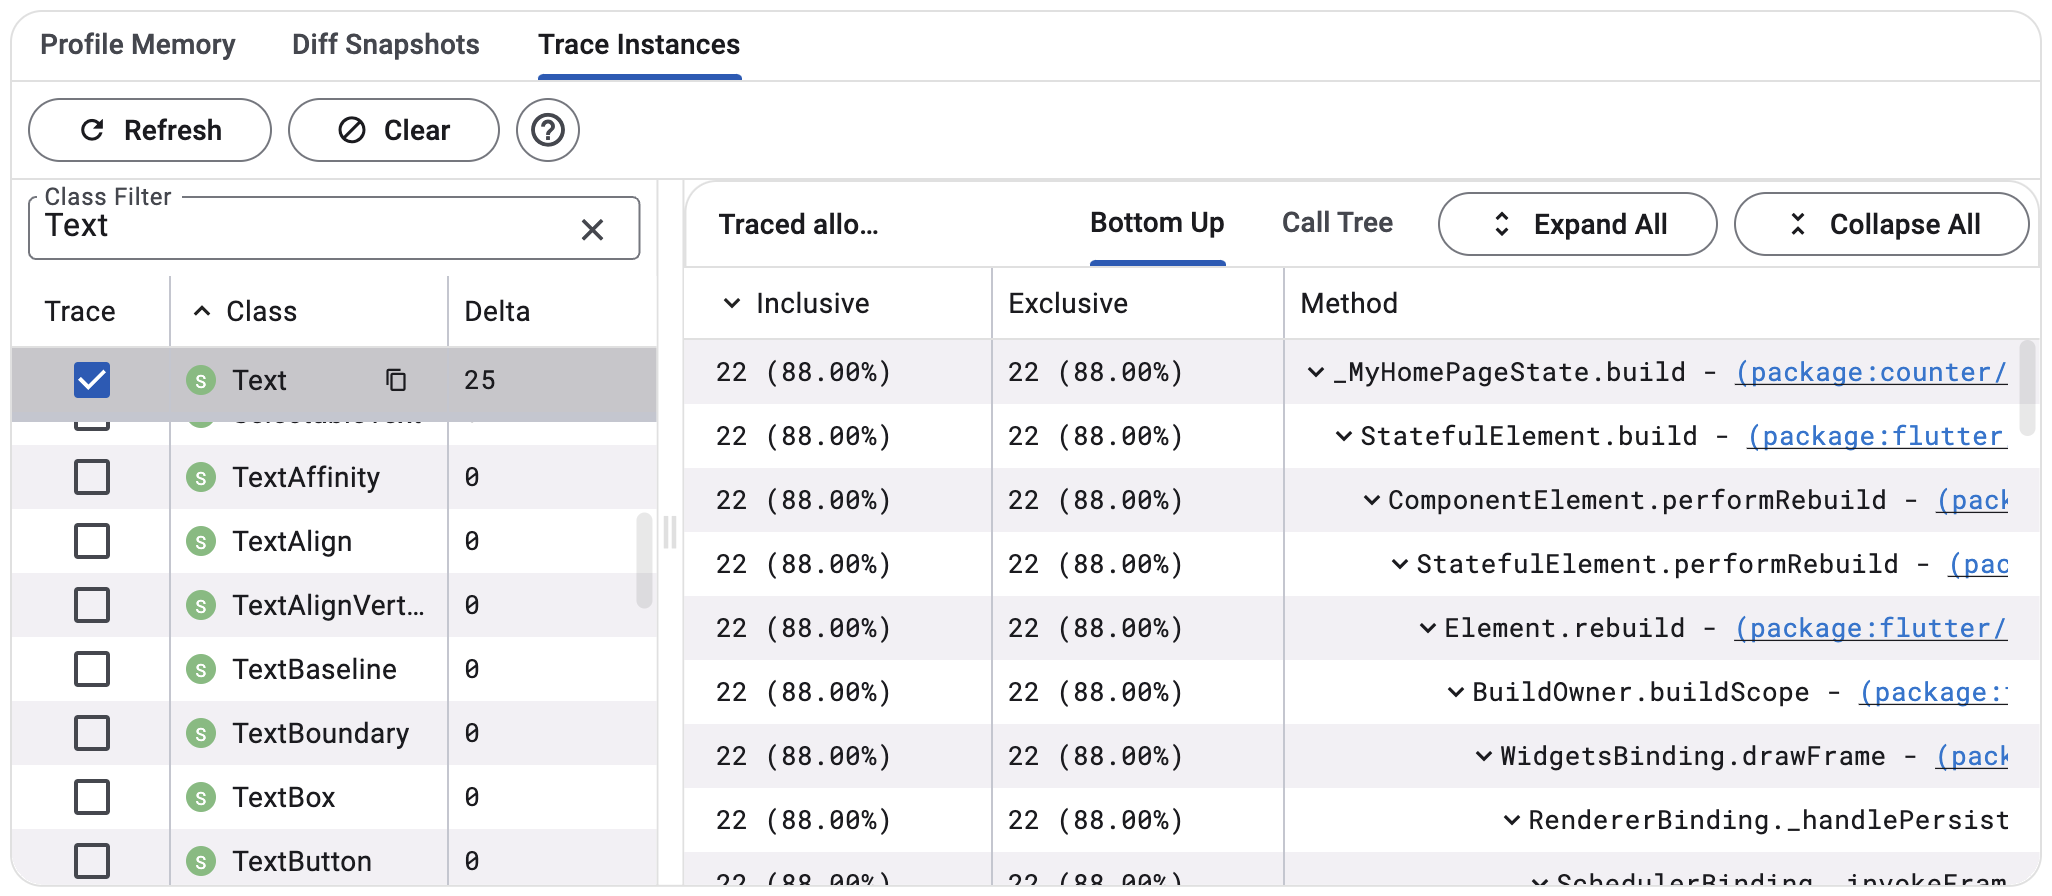
The Widget Inspector tracks rebuild counts and shows which widgets are causing performance issues with excessive state updates.## Memory Leak Detection for Long-Running AppsFlutter apps that run for hours (think dashboard apps, point-of-sale systems) reveal memory leaks that don't show up in short testing sessions.**Isolate the Leak Source:**1.
Run your app for 30+ minutes with typical usage 2. Force garbage collection in DevTools (Memory > GC button)3.
Check if memory usage drops or continues growing
4. Take heap snapshots every 10 minutes to identify the leak patternCommon Leak Patterns We've Fixed:****Animation Controllers Not Disposed:dartclass AnimatedButton extends StatefulWidget { AnimationController _controller; @override void dispose() { _controller.dispose(); // This line prevents leaks super.dispose(); }}Stream Subscriptions Hanging Around:dartclass RealTimeWidget extends StatefulWidget { StreamSubscription _subscription; @override void dispose() { _subscription?.cancel(); // Critical for memory cleanup super.dispose(); }}Static Variables Holding References:```dart// BAD:
Static variables prevent garbage collectionstatic List
A 4K product image decoded on the UI thread will drop frames instantly.Optimize Image Loading:```dart// Use specific dimensions to avoid full-resolution decode
Image.network( imageUrl, cacheWidth: 300, // Decode at display size, not full resolution cacheHeight: 200, // Saves 80%+ memory on high-res images) // [Preload critical images](https://api.flutter.dev/flutter/widgets/precache
Image.html)void _preloadImages() async { await Future.wait([ precacheImage(AssetImage('assets/logo.png'), context), precacheImage(NetworkImage(heroImage), context), ]);}```In production, we reduced image memory usage from 400MB to 80MB by setting cacheWidth/Height on all network images.
The visual quality remained identical for UI display sizes.**Asset Bundle Optimization:**Use `flutter pub deps` to see your dependency tree and eliminate unused packages that bloat your bundle:bash# Find large dependenciesflutter pub deps --json | jq '.packages | to_entries | sort_by(.value.size) | reverse'# Analyze asset sizesflutter build apk --analyze-size## Performance Monitoring Integration
For production apps, integrate performance monitoring that catches issues your users experience:```dart// Firebase Performance Monitoringfinal trace = Firebase
Performance.instance.newTrace('screen_load_time');trace.start();// ... screen loading logictrace.setMetric('rebuild_count', rebuildCount);trace.stop();// Custom metrics for frame timingvoid trackFramePerformance() { SchedulerBinding.instance.addTimingsCallback((timings) { for (FrameTiming timing in timings) { if (timing.totalSpan.inMilliseconds > 16) { // Frame took >16ms, log the slow frame FirebaseCrashlytics.instance.recordError( 'Slow frame: ${timing.total
Span.inMilliseconds}ms' ); } } });}```This gives you real user performance data, not just your testing device results.
The key is measuring what matters to users: startup time, scroll performance, memory stability, and crash rates. DevTools gives you the debugging power, but production monitoring tells you if your fixes actually work.