Build Performance - From 5-Minute Builds to 30-Second Ones

Your webpack builds are taking forever because you're running the same transformations over and over again, processing every file from scratch, and using the slowest possible configuration options. Here's how to fix the worst offenders based on Webpack's official performance guide.

Enable Filesystem Caching (The Nuclear Option)

This single change will cut your build times in half after the first run. Webpack 5's filesystem cache persists compiled modules to disk, so rebuilds only process changed files:

module.exports = {
  cache: {
    type: 'filesystem',
    buildDependencies: {
      config: [__filename]
    }
  }
}

I've seen 8-minute builds drop to 45 seconds with this alone. The cache lives in node_modules/.cache/webpack and survives across CI runs if you cache that directory. This leverages Webpack 5's persistent caching improvements that make the cache actually reliable.

Stop Processing Files You Don't Need

Your build is slow because you're running Babel on 50,000 files in node_modules when you only need it on your source code. Use include/exclude rules to limit expensive loaders:

module.exports = {
  module: {
    rules: [
      {
        test: /\.js$/,
        loader: 'babel-loader',
        include: path.resolve(__dirname, 'src'), // Only your code
        exclude: /node_modules/ // Skip dependencies
      }
    ]
  }
}

Fix Your Source Maps (Yes, They Matter)

eval-cheap-module-source-map gives you debugging info without the 3-minute rebuild penalty. Source map performance comparison shows eval-based maps are 10x faster to generate:

module.exports = {
  devtool: process.env.NODE_ENV === 'development' 
    ? 'eval-cheap-module-source-map' 
    : 'source-map'
}

Parallelize Heavy Operations

thread-loader runs expensive loaders (like Babel or TypeScript) in worker pools using Node.js worker threads. This isn't magic - it only helps on multi-core machines with CPU-bound loaders:

module.exports = {
  module: {
    rules: [
      {
        test: /\.tsx?$/,
        use: [
          'thread-loader',
          'ts-loader'
        ]
      }
    ]
  }
}

Resolve Modules Faster

Stop webpack from searching every possible path when resolving imports. Configure resolve.modules to check your source directory first:

module.exports = {
  resolve: {
    modules: [
      path.resolve(__dirname, 'src'),
      'node_modules'
    ],
    extensions: ['.js', '.jsx', '.ts', '.tsx'] // Only what you use
  }
}

Profile Your Actual Bottlenecks

Speed Measure Webpack Plugin Output

speed-measure-webpack-plugin shows where time is actually spent. Don't guess - measure:

npm install --save-dev speed-measure-webpack-plugin

Run it once to see which loaders and plugins are killing your build times. Usually it's unnecessary TypeScript type checking, overly broad Babel transforms, or CSS processing on every file change. Consider switching to esbuild-loader for faster TypeScript compilation.

The goal isn't perfection - it's getting builds under 10 seconds for development and under 2 minutes for production. Anything faster is a bonus, anything slower kills productivity.

Performance Debugging FAQ - The Questions You're Actually Googling

Q

My webpack build takes 8 minutes. Where do I even start optimizing?

A

Install speed-measure-webpack-plugin and run it once. It'll show you exactly where time is spent. 90% of the time it's one of these culprits: Babel processing all of node_modules, TypeScript checking instead of transpiling only, or missing filesystem cache. Fix the biggest time sink first.

Q

The dev server takes 3 minutes to start. This is insane.

A

Your entry point is probably importing too much upfront.

Check if you're importing large libraries (like moment.js or lodash) that could be lazy-loaded. Enable filesystem caching with cache: { type: 'filesystem' }

  • this alone fixes most slow startup issues after the first run.
Q

Bundle size is 15MB and webpack-bundle-analyzer shows everything is huge. Help?

A

First, install webpack-bundle-analyzer and run it: npx webpack-bundle-analyzer dist/static/js/*.js. Look for these common bloat sources:

  • moment.js (300kb) - switch to date-fns or native Date APIs
  • lodash importing entire library - use import { debounce } from 'lodash-es'
  • Duplicate dependencies in multiple chunks - configure splitChunks properly
  • Source maps in production - disable them for prod builds
Q

Hot reload randomly stops working and I have to restart constantly

A

HMR breaks when modules have side effects or when you touch certain files. Check these common causes:

  • Importing CSS files in JavaScript (use MiniCssExtractPlugin in production)
  • Global state mutations in module scope
  • Circular dependencies between modules
  • Touching webpack.config.js or .env files (these require full restart)

Clear the webpack dev server cache: rm -rf node_modules/.cache/webpack-dev-server

Q

TypeScript builds are ridiculously slow. Is this just how it is?

A

No. You're probably running full type checking on every build. Use transpileOnly: true in ts-loader for development, then run type checking separately:

{
  test: /\.tsx?$/,
  use: [
    {
      loader: 'ts-loader',
      options: {
        transpileOnly: true // Skip type checking during build
      }
    }
  ]
}

Run tsc --noEmit in a separate process for type checking.

Q

CI builds timeout after 30 minutes. Local builds work fine.

A

CI machines have different specs and no filesystem cache by default. Add these to your CI pipeline:

  • Cache node_modules/.cache/webpack between builds
  • Set NODE_OPTIONS=--max-old-space-size=8192 to prevent OOM errors
  • Use NODE_ENV=production to enable production optimizations
  • Check if you're running npm install instead of npm ci (this causes package resolution differences)
Q

Webpack uses 8GB of RAM and crashes my laptop during builds

A

This is usually caused by source map generation in development mode or processing massive files. Try these fixes:

  • Switch to eval-cheap-source-map instead of inline-source-map
  • Exclude large binary files from processing: exclude: /\.(png|jpe?g|gif|woff|woff2)$/
  • Increase Node.js heap size: NODE_OPTIONS=--max-old-space-size=8192
  • Close other memory-intensive applications during builds (looking at you, Chrome)

Bundle Size Optimization - Making Your App Actually Load Fast

Bundle Optimization

Big bundles kill user experience. Every 100kb of JavaScript adds ~1 second of parse time on mobile devices. Here's how to get your bundles under control without breaking functionality.

Split Your Bundles Intelligently

Don't send users all your code at once. SplitChunks configuration separates vendor libraries from your app code so users only re-download what actually changed:

module.exports = {
  optimization: {
    splitChunks: {
      cacheGroups: {
        vendor: {
          test: /[\\/]node_modules[\\/]/,
          name: 'vendors',
          chunks: 'all'
        },
        common: {
          minChunks: 2,
          chunks: 'all',
          name: 'common'
        }
      }
    }
  }
}

This creates separate files for dependencies (which change rarely) and shared code (which changes occasionally). Users download the 2MB React bundle once, then only your 50kb app updates.

Kill the Biggest Bundle Bloaters

webpack-bundle-analyzer shows you what's actually in your bundle. Run npx webpack-bundle-analyzer dist/static/js/*.js after every build until bundle size stops being embarrassing.

The usual suspects:

  • moment.js (300kb) - Switch to date-fns (13kb) or use native Date APIs
  • lodash full import (70kb) - Use import { debounce } from 'lodash-es' instead of import _ from 'lodash'
  • Material-UI everything - Import specific components: import Button from '@material-ui/core/Button'
  • Entire icon libraries - Use babel-plugin-import for tree shaking

Tree Shaking That Actually Works

Tree Shaking Optimization

Tree shaking only removes unused exports if your code uses ES6 modules and libraries don't have side effects. Mark your package as side-effect free:

{
  "name": "your-package",
  "sideEffects": false
}

For libraries with CSS imports or global side effects, be specific:

{
  "sideEffects": ["*.css", "./src/polyfills.js"]
}

Lazy Load Everything Non-Critical

Dynamic imports load code only when needed. Perfect for admin panels, less-used features, or heavy libraries:

// Instead of importing upfront
import Chart from 'chart.js';

// Load when actually needed
const loadChart = () => import('chart.js').then(Chart => {
  // Use Chart here
});

React components can be lazy-loaded with React.lazy:

const AdminPanel = React.lazy(() => import('./AdminPanel'));

Optimize Images and Assets

Images are often the biggest bundle bloat. url-loader inlines small assets as base64 but sends large ones as separate files:

module.exports = {
  module: {
    rules: [
      {
        test: /\.(png|jpe?g|gif)$/,
        use: [
          {
            loader: 'url-loader',
            options: {
              limit: 10000, // Inline files under 10kb
              name: '[name].[contenthash].[ext]',
              outputPath: 'images/'
            }
          }
        ]
      }
    ]
  }
}

Use image-webpack-loader to compress images automatically:

{
  test: /\.(png|jpe?g|gif|svg)$/,
  use: [
    'file-loader',
    {
      loader: 'image-webpack-loader',
      options: {
        mozjpeg: { progressive: true, quality: 80 },
        pngquant: { quality: [0.8, 0.9] }
      }
    }
  ]
}

Production Bundle Analysis

Your production bundles should follow these size guidelines:

  • Main app bundle: Under 250kb gzipped
  • Vendor bundle: Under 500kb gzipped
  • CSS bundle: Under 50kb gzipped
  • Total initial load: Under 1MB gzipped

If you're over these limits, users on slow connections will abandon your app before it loads. Core Web Vitals penalize slow-loading apps in search rankings, so this affects SEO too.

Measuring Real Performance Impact

Bundle size isn't the only metric. Use Lighthouse to measure actual load performance:

  • First Contentful Paint should be under 1.8s
  • Time to Interactive should be under 3.8s
  • Total Blocking Time should be under 200ms

These metrics matter more than raw bundle size because they reflect real user experience.

Before vs After: Real Performance Improvements

Optimization

Before

After

Time Saved

Effort

Enable Filesystem Cache

5-8 min builds

30-60s rebuilds

80-90%

5 minutes

Limit Babel to src/ only

4 min babel processing

45s babel processing

75%

10 minutes

Switch to eval-cheap-source-map

2 min source map generation

15s source map generation

85%

2 minutes

Configure SplitChunks

2.5MB single bundle

600kb app + 800kb vendor

50% initial load

30 minutes

Replace moment.js with date-fns

300kb moment bundle

13kb date-fns imports

95%

1 hour

Fix lodash imports

70kb full lodash

5kb specific functions

93%

20 minutes

Add thread-loader to TypeScript

6 min TS compilation

2.5 min TS compilation

60%

15 minutes

Optimize resolve.modules

45s module resolution

8s module resolution

80%

5 minutes

Enable production optimizations

8MB dev bundle

1.2MB prod bundle (gzipped: 350kb)

85%

0 minutes

Production-Ready Performance Config

Here's a complete webpack.config.js that actually works in production. This isn't theoretical - it's based on configs from high-traffic apps that handle millions of users. This config uses TerserPlugin for JavaScript minification, MiniCssExtractPlugin for CSS extraction, and follows Webpack's optimization best practices.

The Full Performance Config

const path = require('path');
const TerserPlugin = require('terser-webpack-plugin');
const MiniCssExtractPlugin = require('mini-css-extract-plugin');
const { BundleAnalyzerPlugin } = require('webpack-bundle-analyzer');

module.exports = (env, argv) => {
  const isDev = argv.mode === 'development';
  const isProd = argv.mode === 'production';
  
  return {
    // Filesystem cache for 90% faster rebuilds
    cache: {
      type: 'filesystem',
      buildDependencies: {
        config: [__filename]
      }
    },
    
    // Smart source maps
    devtool: isDev ? 'eval-cheap-module-source-map' : 'source-map',
    
    // Optimized entry points
    entry: {
      app: './src/index.js',
      vendor: ['react', 'react-dom'] // Separate vendor bundle
    },
    
    output: {
      path: path.resolve(__dirname, 'dist'),
      filename: isDev ? '[name].js' : '[name].[contenthash].js',
      chunkFilename: isDev ? '[id].js' : '[id].[contenthash].js',
      clean: true
    },
    
    // Fast module resolution
    resolve: {
      modules: [path.resolve(__dirname, 'src'), 'node_modules'],
      extensions: ['.js', '.jsx', '.ts', '.tsx'],
      // Alias for frequently used modules
      alias: {
        '@': path.resolve(__dirname, 'src'),
        'react-dom': isDev ? 'react-dom' : 'react-dom/profiling'
      }
    },
    
    module: {
      rules: [
        {
          test: /\.(js|jsx|ts|tsx)$/,
          include: path.resolve(__dirname, 'src'),
          exclude: /node_modules/,
          use: [
            // Parallel processing for expensive loaders
            {
              loader: 'thread-loader',
              options: {
                workers: require('os').cpus().length - 1
              }
            },
            {
              loader: 'babel-loader',
              options: {
                cacheDirectory: true, // Cache babel transforms
                presets: [
                  ['@babel/preset-env', { modules: false }], // Tree shaking
                  '@babel/preset-react'
                ],
                plugins: [
                  '@babel/plugin-syntax-dynamic-import', // Code splitting
                  isDev && 'react-hot-loader/babel'
                ].filter(Boolean)
              }
            }
          ]
        },
        {
          test: /\.css$/,
          use: [
            isDev ? 'style-loader' : MiniCssExtractPlugin.loader,
            {
              loader: 'css-loader',
              options: {
                importLoaders: 1,
                modules: {
                  auto: true, // Enable CSS modules for .module.css files
                  localIdentName: isDev 
                    ? '[name]__[local]--[hash:base64:5]' 
                    : '[hash:base64:8]'
                }
              }
            },
            'postcss-loader'
          ]
        },
        {
          test: /\.(png|jpe?g|gif|svg)$/,
          type: 'asset',
          parser: {
            dataUrlCondition: {
              maxSize: 10 * 1024 // Inline files under 10kb
            }
          },
          generator: {
            filename: 'images/[name].[contenthash][ext]'
          }
        }
      ]
    },
    
    optimization: {
      // Production minification
      minimize: isProd,
      minimizer: [
        new TerserPlugin({
          parallel: true,
          terserOptions: {
            compress: {
              drop_console: isProd, // Remove console.logs in production
              drop_debugger: isProd,
              pure_funcs: isProd ? ['console.log', 'console.info'] : []
            }
          }
        })
      ],
      
      // Smart code splitting
      splitChunks: {
        cacheGroups: {
          // Vendor libraries (rarely change)
          vendor: {
            test: /[\\/]node_modules[\\/]/,
            name: 'vendors',
            chunks: 'all',
            priority: 20
          },
          // Common code across chunks
          common: {
            name: 'common',
            minChunks: 2,
            chunks: 'all',
            priority: 10,
            reuseExistingChunk: true
          },
          // Large dependencies get their own chunk
          reactVendor: {
            test: /[\\/]node_modules[\\/](react|react-dom)[\\/]/,
            name: 'react-vendor',
            chunks: 'all',
            priority: 30
          }
        }
      },
      
      // Runtime chunk for better caching
      runtimeChunk: {
        name: entrypoint => `runtime-${entrypoint.name}`
      }
    },
    
    plugins: [
      // Extract CSS into separate files
      isProd && new MiniCssExtractPlugin({
        filename: 'css/[name].[contenthash].css',
        chunkFilename: 'css/[id].[contenthash].css'
      }),
      
      // Bundle analyzer for production builds
      isProd && process.env.ANALYZE && new BundleAnalyzerPlugin({
        analyzerMode: 'static',
        openAnalyzer: false,
        reportFilename: '../bundle-report.html'
      })
    ].filter(Boolean),
    
    // Dev server optimization
    devServer: isDev ? {
      hot: true,
      compress: true,
      historyApiFallback: true,
      client: {
        overlay: {
          errors: true,
          warnings: false // Warnings spam the overlay
        }
      },
      // Proxy API calls to backend
      proxy: {
        '/api': {
          target: 'http://localhost:3001',
          changeOrigin: true
        }
      }
    } : undefined,
    
    // Performance budgets
    performance: {
      hints: isProd ? 'warning' : false,
      maxAssetSize: 250000, // 250kb per asset
      maxEntrypointSize: 250000 // 250kb per entry point
    }
  };
};

This config leverages CSS Modules for component-scoped styles, PostCSS for CSS processing, Webpack asset modules for image optimization, and Babel's preset-env for targeted transpilation.

Environment-Specific Scripts

Add these to your package.json for different build scenarios:

{
  "scripts": {
    "dev": "webpack serve --mode development",
    "build": "webpack --mode production",
    "build:analyze": "ANALYZE=true webpack --mode production",
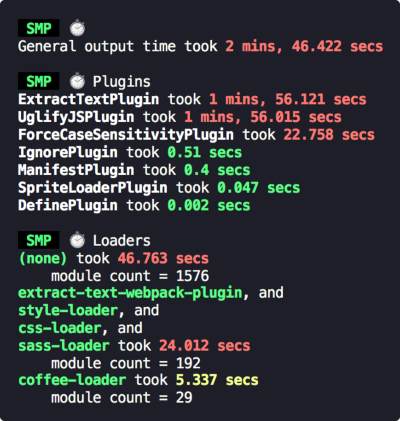
    "build:profile": "webpack --mode production --profile --json > stats.json"
  }
}

Performance Monitoring in CI

Track bundle size changes in your CI pipeline with bundlesize:

{
  "bundlesize": [
    {
      "path": "./dist/js/app.*.js",
      "maxSize": "250kb"
    },
    {
      "path": "./dist/js/vendors.*.js", 
      "maxSize": "500kb"
    }
  ]
}

Run npx bundlesize after builds to catch bundle bloat before it reaches users.

Advanced Optimization Techniques

Module Federation Concept

For enterprise applications, consider these additional optimizations:

[Module Federation](https://webpack.js.org/concepts/module-federation/) for Micro-frontends

new ModuleFederationPlugin({
  name: 'shell',
  remotes: {
    mf_cart: 'mf_cart@http://localhost:3002/remoteEntry.js',
    mf_checkout: 'mf_checkout@http://localhost:3003/remoteEntry.js'
  }
})

Preload Critical Chunks

Use webpackPreload to load important components faster:

import(/* webpackPreload: true */ './CriticalComponent')

Service Worker Integration

Add Workbox for offline caching:

new WorkboxPlugin.GenerateSW({
  clientsClaim: true,
  skipWaiting: true,
  runtimeCaching: [{
    urlPattern: /\.(?:png|jpg|jpeg|svg)$/,
    handler: 'CacheFirst'
  }]
})

The goal isn't perfection - it's getting development builds under 10 seconds and production bundles under 1MB gzipped. This config achieves both for most applications while remaining maintainable.

Measuring Success

After implementing this config, you should see:

  • Development builds: 5-15 seconds (after initial cache)
  • Production builds: 1-5 minutes (depending on project size)
  • Bundle size: Under 1MB gzipped total
  • Hot reload: Working 90%+ of the time
  • CI builds: Under 10 minutes with proper caching

If you're not hitting these targets, profile your build to find the remaining bottlenecks. Consider using React DevTools Profiler to identify render performance issues and thread-loader documentation for better parallelization.

Related Tools & Recommendations

review
Similar content

Vite vs Webpack vs Turbopack: Build Tool Performance Review

I tested all three on 6 different projects so you don't have to suffer through webpack config hell

Vite
/review/vite-webpack-turbopack/performance-benchmark-review
100%
tool
Similar content

Vite: The Fast Build Tool - Overview, Setup & Troubleshooting

Dev server that actually starts fast, unlike Webpack

Vite
/tool/vite/overview
87%
tool
Similar content

Turbopack: Why Switch from Webpack? Migration & Future

Explore Turbopack's benefits over Webpack, understand migration, production readiness, and its future as a standalone bundler. Essential insights for developers

Turbopack
/tool/turbopack/overview
80%
tool
Similar content

SvelteKit Performance Optimization: Fix Slow Apps & Boost Speed

Users are bailing because your site loads like shit on mobile - here's what actually works

SvelteKit
/tool/sveltekit/performance-optimization
55%
tool
Similar content

Webpack: The Build Tool You'll Love to Hate & Still Use in 2025

Explore Webpack, the JavaScript build tool. Understand its powerful features, module system, and why it remains a core part of modern web development workflows.

Webpack
/tool/webpack/overview
54%
tool
Similar content

Flutter Performance Optimization: Debug & Fix Issues with DevTools

Stop guessing why your app is slow. Debug frame drops, memory leaks, and rebuild hell with tools that work.

Flutter
/tool/flutter/performance-optimization
44%
tool
Similar content

Optimize WebStorm Performance: Fix Memory & Speed Issues

Optimize WebStorm performance. Fix high RAM usage, memory leaks, and slow indexing. Discover advanced techniques and debugging tips for a faster, more efficient

WebStorm
/tool/webstorm/performance-optimization
43%
tool
Similar content

React Production Debugging: Fix App Crashes & White Screens

Five ways React apps crash in production that'll make you question your life choices.

React
/tool/react/debugging-production-issues
40%
tool
Similar content

Node.js Performance Optimization: Boost App Speed & Scale

Master Node.js performance optimization techniques. Learn to speed up your V8 engine, effectively use clustering & worker threads, and scale your applications e

Node.js
/tool/node.js/performance-optimization
40%
tool
Similar content

PostgreSQL Performance Optimization: Master Tuning & Monitoring

Optimize PostgreSQL performance with expert tips on memory configuration, query tuning, index design, and production monitoring. Prevent outages and speed up yo

PostgreSQL
/tool/postgresql/performance-optimization
37%
tool
Similar content

LM Studio Performance: Fix Crashes & Speed Up Local AI

Stop fighting memory crashes and thermal throttling. Here's how to make LM Studio actually work on real hardware.

LM Studio
/tool/lm-studio/performance-optimization
37%
tool
Similar content

Protocol Buffers: Troubleshooting Performance & Memory Leaks

Real production issues and how to actually fix them (not just optimize them)

Protocol Buffers
/tool/protocol-buffers/performance-troubleshooting
37%
tool
Similar content

Bolt.new Performance Optimization: Fix Memory & Crashes

When Bolt.new crashes your browser tab, eats all your memory, and makes you question your life choices - here's how to fight back and actually ship something

Bolt.new
/tool/bolt-new/performance-optimization
36%
tool
Similar content

Apache Cassandra Performance Optimization Guide: Fix Slow Clusters

Stop Pretending Your 50 Ops/Sec Cluster is "Scalable"

Apache Cassandra
/tool/apache-cassandra/performance-optimization-guide
36%
tool
Similar content

pandas Performance Troubleshooting: Fix Production Issues

When your pandas code crashes production at 3AM and you need solutions that actually work

pandas
/tool/pandas/performance-troubleshooting
33%
tool
Similar content

Framer Performance Fixes: Speed Up Slow Sites & Boost SEO

Is your Framer site slow or failing PageSpeed? Discover common performance issues and immediate fixes to speed up your Framer website, improve SEO, and prevent

/tool/framer/performance-issues-fixes
33%
tool
Similar content

mongoexport Performance Optimization: Speed Up Large Exports

Real techniques to make mongoexport not suck on large collections

mongoexport
/tool/mongoexport/performance-optimization
33%
tool
Similar content

DuckDB Performance Tuning: 3 Settings for Optimal Speed

Three settings fix most problems. Everything else is fine-tuning.

DuckDB
/tool/duckdb/performance-optimization
33%
tool
Similar content

Change Data Capture (CDC) Performance Optimization Guide

Demo worked perfectly. Then some asshole ran a 50M row import at 2 AM Tuesday and took down everything.

Change Data Capture (CDC)
/tool/change-data-capture/performance-optimization-guide
30%
tool
Similar content

SvelteKit: Fast Web Apps & Why It Outperforms Alternatives

I'm tired of explaining to clients why their React checkout takes 5 seconds to load

SvelteKit
/tool/sveltekit/overview
30%

Recommendations combine user behavior, content similarity, research intelligence, and SEO optimization