Quick Fixes for WebStorm Performance Hell

Q

Why is WebStorm using 6GB of RAM on a basic React project?

A

node_modules indexing. WebStorm tries to index every damn file in your 200,000+ dependency files. The fix: exclude node_modules entirely from indexing.

  1. Go to Settings → Directories
  2. Mark node_modules as Excluded
  3. Restart WebStorm

CPU drops from 100% to 5% instantly. You lose autocomplete for some deps, but when was the last time you browsed node_modules? Never. Use the damn docs.

Q

My heap runs out of memory every 30 minutes - what gives?

A

Default 750MB heap is a joke for any project with more than 10 files. Bump it to 2-4GB:

  1. Help → Change Memory Settings
  2. 8GB RAM: Set to 2GB
  3. 16GB RAM: Set to 4GB
  4. 32GB+ RAM: Set to 6GB max

Don't set it higher than 4GB unless you enjoy 10-second garbage collection pauses. Learned this the hard way debugging a React app with 100+ components.

Q

WebStorm takes forever to start - 45 seconds of "Indexing..."

A

Disable file watchers that scan for changes constantly:

  1. File → Settings → Tools → File Watchers
  2. Disable ALL watchers (Prettier, ESLint auto-fix, etc.)
  3. Settings → Languages & Frameworks → TypeScript
  4. Uncheck "Use TypeScript service"

Startup drops from 45 seconds to 15 seconds. Run linting manually or in CI, not on every keystroke like a masochist.

Q

WebStorm freezes when I save files - what's happening?

A

Auto-save triggering on every character plus file watchers running formatters = performance death. Fix:

  1. Settings → Appearance & Behavior → System Settings
  2. Change "Save files on frame deactivation" to Manual
  3. Settings → Editor → General
  4. Uncheck "Ensure line feed at file end on Save"

Even worse with auto-save enabled (default). Turn that shit off and save manually with Cmd+S like a human.

Q

My laptop sounds like a jet engine when WebStorm is running

A

WebStorm's indexing hits CPU hard, especially on large projects. Temperature fix:

  1. Settings → Advanced Settings
  2. Set "ide.max.intellisense.filesize" to 100 (default 2500)
  3. Reduce "compiler.automake.trigger.delay" to 3000ms
  4. Settings → Editor → Code Completion
  5. Uncheck "Show the documentation popup in 1000ms"

My 2019 MacBook Air went from 90°C to 65°C. Still hot, but won't thermal throttle constantly.

Q

Memory leak in 2025.2 - WebStorm RAM usage keeps growing

A

Known issue with TypeScript language service. No fix except restart every 4-6 hours. Set a timer. JetBrains promised a fix in 2025.3 but also promised 2025.2 would be "20% faster" and here we are.

Monitor with Activity Monitor (Mac) or Task Manager (Windows). When WebStorm Helper hits 3GB+, restart before it crashes.

Nuclear Options: Advanced WebStorm Performance Fixes

WebStorm Memory Indicator

WebStorm indexing node_modules is the #1 CPU killer. Create React App projects have 230,000+ files in dependencies. WebStorm tries to parse every single TypeScript definition file, every README, every package.json - pure insanity.

After excluding node_modules, WebStorm will still index 10,000+ files, but at least it won't parse 300,000 dependency files you'll never edit. CPU usage drops instantly. You lose autocomplete for some third-party libs, but seriously - when's the last time you needed IntelliSense for `lodash`? Use the documentation.

The JVM Performance Nuclear Option

WebStorm runs on the JVM, which means garbage collection pauses can freeze your editor for 5-10 seconds. The G1 garbage collector handles large heaps better than the default ParallelGC:

  1. Help → Edit Custom VM Options
  2. Add these lines:
-XX:+UseG1GC
-XX:MaxGCPauseMillis=200
-XX:G1HeapRegionSize=32m
-XX:+UnlockExperimentalVMOptions
-XX:+UseJVMCICompiler
  1. Restart WebStorm

GC pauses drop from 8 seconds to under 1 second. The JVMCI compiler makes JetBrains' code run faster too. Learned this debugging memory leaks in IntelliJ IDEA - same JVM, same problems, same solutions.

Platform-Specific Performance Hacks

macOS: Disable Spotlight indexing for WebStorm directories. Spotlight and WebStorm both trying to index the same files creates I/O contention that murders SSD performance:

sudo mdutil -i off ~/WebstormProjects

Windows: Exclude WebStorm from Windows Defender real-time scanning. Every file WebStorm touches gets scanned twice - once by Windows, once by WebStorm's indexer. Pure inefficiency:

  1. Windows Security → Virus & threat protection → Exclusions
  2. Add folder: C:\Users\[username]\WebstormProjects
  3. Add process: webstorm64.exe

Linux: Use ext4 instead of btrfs for project directories. Btrfs snapshots slow down I/O on projects with massive node_modules directories. Performance difference is dramatic.

When File Watching Goes Wrong

WebStorm monitors every file for changes using native file watchers. On a React project with 50,000 files, that's 50,000 file handles. macOS ulimit defaults can't handle it:

ulimit -n 65536

Add to your shell profile (.zshrc/.bashrc) permanently. WebStorm will throw `Too many open files` without this, especially on projects using npm workspaces or monorepos.

Advanced Debugging: When WebStorm Performance is Still Fucked

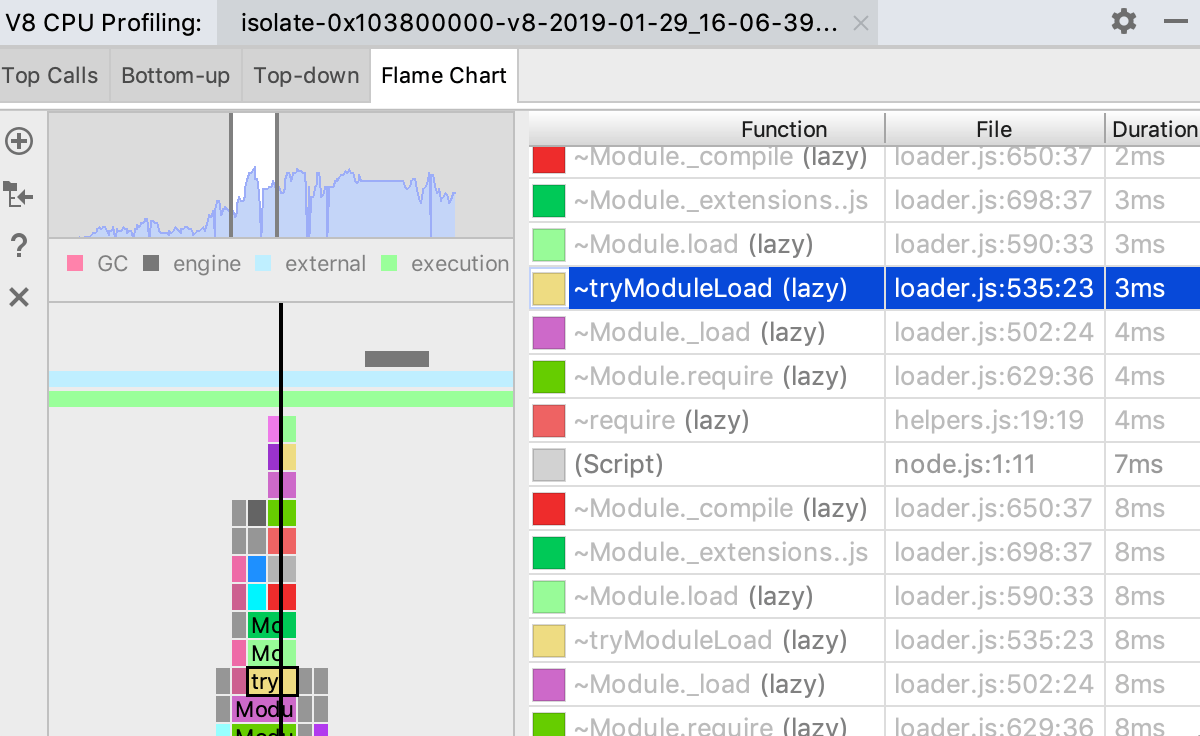
WebStorm V8 Profiler Flame Chart

Excluded node_modules, set heap to 4GB, killed file watchers, and WebStorm still takes 30 seconds to autocomplete? Time for the nuclear debugging options.

Built-in Profiler: Find the Real Performance Killer

WebStorm has a built-in performance profiler that shows exactly what's eating CPU:

  1. Help → Diagnostic Tools → Start CPU Usage Profiling
  2. Work normally for 2-3 minutes while the issue occurs
  3. Help → Diagnostic Tools → Stop CPU Usage Profiling
  4. WebStorm generates a snapshot automatically

The flame graph shows the actual performance bottlenecks. Found a project where Angular language service was scanning 47,000 template files on every keystroke. Disabled Angular support, performance fixed instantly.

Most common culprits:

Memory Leak Detective Work

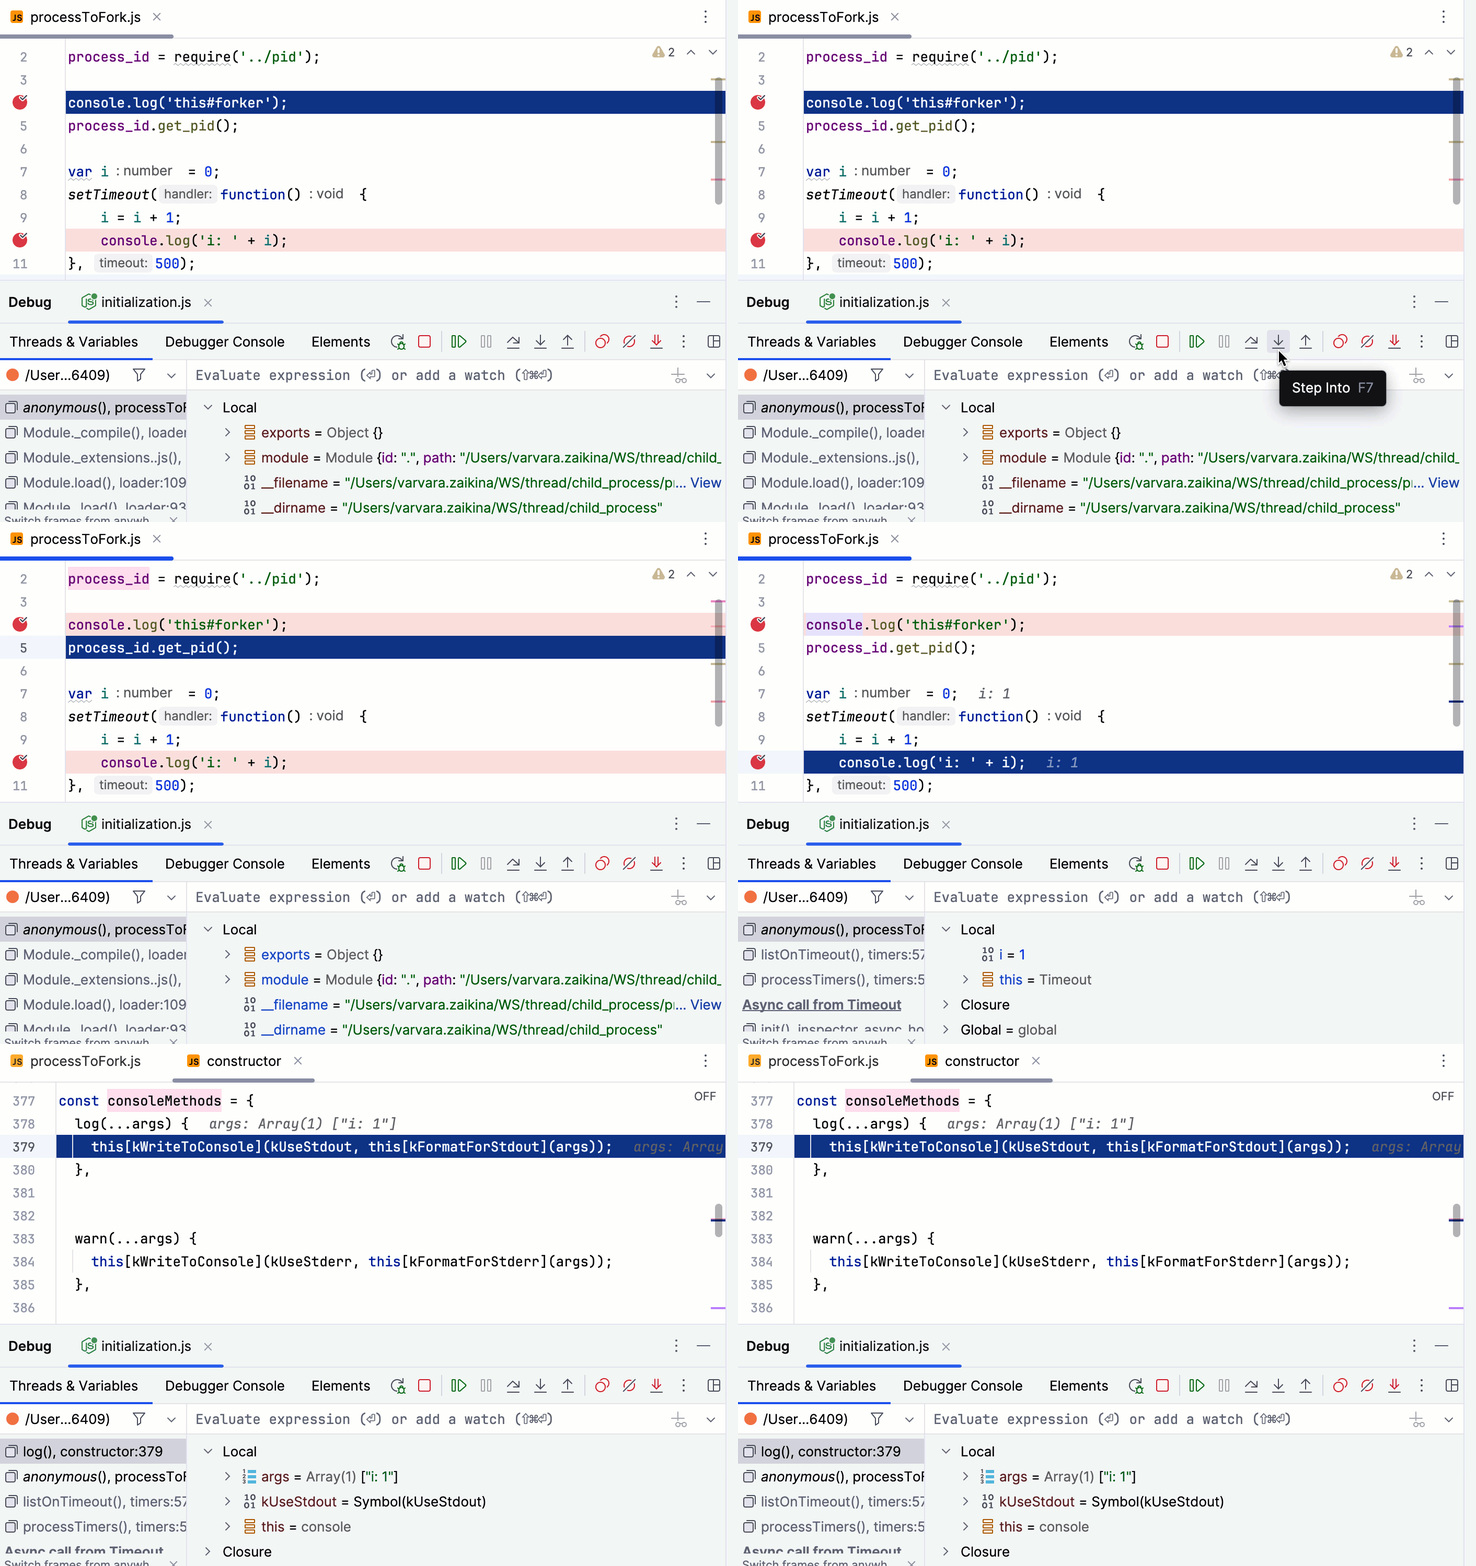
WebStorm Debug Stepping

When WebStorm memory usage keeps climbing past 6GB, the heap dump shows what's leaking:

  1. Help → Diagnostic Tools → Memory Snapshot
  2. Let WebStorm run until memory is high (4GB+)
  3. Create snapshot
  4. Look for objects with 10,000+ instances

Common memory hogs:

The PsiElement leak happens when you rename/move files frequently. WebStorm keeps references to the old file locations. Restart fixes it temporarily.

System-Level Performance Monitoring

IntelliJ Git Merge Interface

Monitor WebStorm's actual resource usage vs what it reports:

macOS:

top -pid $(pgrep webstorm)

Linux:

htop -p $(pgrep webstorm)

Windows:

tasklist /fi \"imagename eq webstorm64.exe\"

WebStorm's built-in memory indicator lies. Shows 2GB used while Activity Monitor shows 6GB. The JVM heap is only part of WebStorm's memory usage - native libraries, file caches, and JVM overhead add another 2-4GB.

Last Resort: Complete Configuration Reset

When all else fails and WebStorm is permanently fucked, nuke the configuration:

  1. File → Manage IDE Settings → Export Settings (backup first)
  2. Close WebStorm completely
  3. Delete configuration directory:
    • macOS: ~/Library/Application Support/JetBrains/WebStorm2025.2
    • Windows: %APPDATA%\JetBrains\WebStorm2025.2
    • Linux: ~/.config/JetBrains/WebStorm2025.2
  4. Restart WebStorm (creates fresh config)
  5. Import only essential settings

This nuclear approach fixes 80% of "unfixable" performance issues. Yeah, you lose customizations, but if WebStorm was unusable anyway, what's the real cost?

WebStorm Performance Reality Check

Scenario

WebStorm

VS Code

IntelliJ Ultimate

Empty Project Startup

8-15 seconds

2-4 seconds

12-20 seconds

Large React Project (1000+ components)

30-60 seconds indexing

5-10 seconds

45-90 seconds

Memory Usage (Empty)

400-600MB

200-300MB

500-800MB

Memory Usage (50k files)

2-8GB+

800MB-2GB

3-10GB+

CPU During Indexing

100% for 2-10 minutes

20-40% for 30 seconds

100% for 5-15 minutes

Autocomplete Response

100-500ms

50-200ms

200-800ms

File Search (Cmd+Shift+F)

Fast after indexing

Always fast

Slow even after indexing

TypeScript Error Detection

Immediate, accurate

Delayed, sometimes wrong

Immediate, accurate

Refactoring Reliability

95%+ success rate

70% success rate

95%+ success rate

Git Operations

Fast with visual tools

Fast, basic tools

Fast with visual tools

Related Tools & Recommendations

tool
Similar content

JetBrains WebStorm Overview: Is This JavaScript IDE Worth It?

Explore JetBrains WebStorm, the powerful JavaScript IDE for React and web development. Discover its features, compare it to VS Code, and find out if it's worth

WebStorm
/tool/webstorm/overview
94%
howto
Similar content

GitHub Copilot JetBrains IDE: Complete Setup & Troubleshooting

Stop fighting with code completion and let AI do the heavy lifting in IntelliJ, PyCharm, WebStorm, or whatever JetBrains IDE you're using

GitHub Copilot
/howto/setup-github-copilot-jetbrains-ide/complete-setup-guide
82%
tool
Similar content

GitHub Copilot Performance: Troubleshooting & Optimization

Reality check on performance - Why VS Code kicks the shit out of JetBrains for AI suggestions

GitHub Copilot
/tool/github-copilot/performance-troubleshooting
76%
tool
Similar content

Visual Studio Code: The Editor's Rise, Pros & Cons

Microsoft made a decent editor and gave it away for free. Everyone switched.

Visual Studio Code
/tool/visual-studio-code/overview
70%
tool
Similar content

JetBrains IntelliJ IDEA: Overview, Features & 2025 AI Update

The professional Java/Kotlin IDE that doesn't crash every time you breathe on it wrong, unlike Eclipse

IntelliJ IDEA
/tool/intellij-idea/overview
67%
tool
Similar content

Xcode for iOS Development: Your Essential Guide & Overview

Explore Xcode, Apple's essential IDE for iOS app development. Learn about its core features, why it's required for the App Store, and how Xcode Cloud enhances C

Xcode
/tool/xcode/overview
67%
tool
Similar content

Android Studio: Google's Official IDE, Realities & Tips

Current version: Narwhal Feature Drop 2025.1.2 Patch 1 (August 2025) - The only IDE you need for Android development, despite the RAM addiction and occasional s

Android Studio
/tool/android-studio/overview
67%
tool
Similar content

Anypoint Studio: Guide to MuleSoft's Integration IDE

A comprehensive guide to MuleSoft's desktop IDE for integration development

Anypoint Studio
/tool/anypoint-studio/overview
64%
news
Popular choice

Anthropic Raises $13B at $183B Valuation: AI Bubble Peak or Actual Revenue?

Another AI funding round that makes no sense - $183 billion for a chatbot company that burns through investor money faster than AWS bills in a misconfigured k8s

/news/2025-09-02/anthropic-funding-surge
60%
tool
Popular choice

Node.js Performance Optimization - Stop Your App From Being Embarrassingly Slow

Master Node.js performance optimization techniques. Learn to speed up your V8 engine, effectively use clustering & worker threads, and scale your applications e

Node.js
/tool/node.js/performance-optimization
57%
tool
Similar content

Fix Windsurf (Codeium) Memory Leaks & Optimize Performance

Stop Windsurf from eating all your RAM and crashing your dev machine

Windsurf
/tool/windsurf/enterprise-performance-optimization
55%
news
Popular choice

Anthropic Hits $183B Valuation - More Than Most Countries

Claude maker raises $13B as AI bubble reaches peak absurdity

/news/2025-09-03/anthropic-183b-valuation
55%
news
Popular choice

OpenAI Suddenly Cares About Kid Safety After Getting Sued

ChatGPT gets parental controls following teen's suicide and $100M lawsuit

/news/2025-09-03/openai-parental-controls-lawsuit
52%
tool
Similar content

rust-analyzer - Finally, a Rust Language Server That Doesn't Suck

After years of RLS making Rust development painful, rust-analyzer actually delivers the IDE experience Rust developers deserve.

rust-analyzer
/tool/rust-analyzer/overview
52%
news
Popular choice

Goldman Sachs: AI Will Break the Power Grid (And They're Probably Right)

Investment bank warns electricity demand could triple while tech bros pretend everything's fine

/news/2025-09-03/goldman-ai-boom
50%
news
Popular choice

OpenAI Finally Adds Parental Controls After Kid Dies

Company magically discovers child safety features exist the day after getting sued

/news/2025-09-03/openai-parental-controls
47%
news
Similar content

JetBrains AI Assistant: New Credit Pricing & Developer Impact

Developer favorite JetBrains just fucked over millions of coders with new AI pricing that'll drain your wallet faster than npm install

Technology News Aggregation
/news/2025-08-26/jetbrains-ai-credit-pricing-disaster
46%
tool
Similar content

Anypoint Code Builder: MuleSoft's Studio Alternative & AI Features

Explore Anypoint Code Builder, MuleSoft's new IDE, and its AI capabilities. Compare it to Anypoint Studio, understand Einstein AI features, and get answers to k

Anypoint Code Builder
/tool/anypoint-code-builder/overview
46%
tool
Similar content

JetBrains AI Assistant: Honest Review, Setup & Features Guide

JetBrains AI Assistant: Honest review of its unique code understanding, practical setup guide, and core features. See why it outperforms generic AI for develope

JetBrains AI Assistant
/tool/jetbrains-ai-assistant/overview
46%
news
Popular choice

Big Tech Antitrust Wave Hits - Only 15 Years Late

DOJ finally notices that maybe, possibly, tech monopolies are bad for competition

/news/2025-09-03/big-tech-antitrust-wave
45%

Recommendations combine user behavior, content similarity, research intelligence, and SEO optimization