Production React apps fail in predictable ways. After optimizing hundreds of slow React applications, the same five performance issues account for 90% of user complaints. Fix these patterns and your app will stop feeling like it's running through molasses.
1. Bundle Size Bloat: The 8MB Monster Problem
The Problem: Your JavaScript bundle is so large that users give up before your app finishes loading.
I've seen React apps with bundles pushing 9MB. Fucking massive - bigger than actual mobile games. Users on 3G were waiting almost a minute just to see anything, and most said "screw this" and left.
Real-World Bundle Disasters:
E-commerce disaster I walked into:
- Bundle was massive as hell - like 8 or 9MB of JavaScript, maybe more? I stopped measuring after it hit "stupid big" territory
- Dependencies were out of control - had to be over a thousand, maybe 1,200? (
npm list | wc -lif you want to traumatize yourself) - Mobile users waited forever, most just said "fuck this" and left
- The stupid mistake: Some genius imported all of Lodash for ONE debounce function. One function.
- How I fixed it: Spent a day importing specific functions instead of entire libraries, got it down to something reasonable - under 1MB anyway
Dashboard from hell:
- Someone imported the entire Material Icons library to use like 10 icons
- Moment.js for basic date formatting (because who needs 300KB for "MM/DD/YYYY", right?)
- Three.js for a simple fade transition. A fucking 2MB library for a fade.
- Fix: Switched to date-fns, custom SVGs, and plain CSS. Bundle went from bloated mess to reasonable.
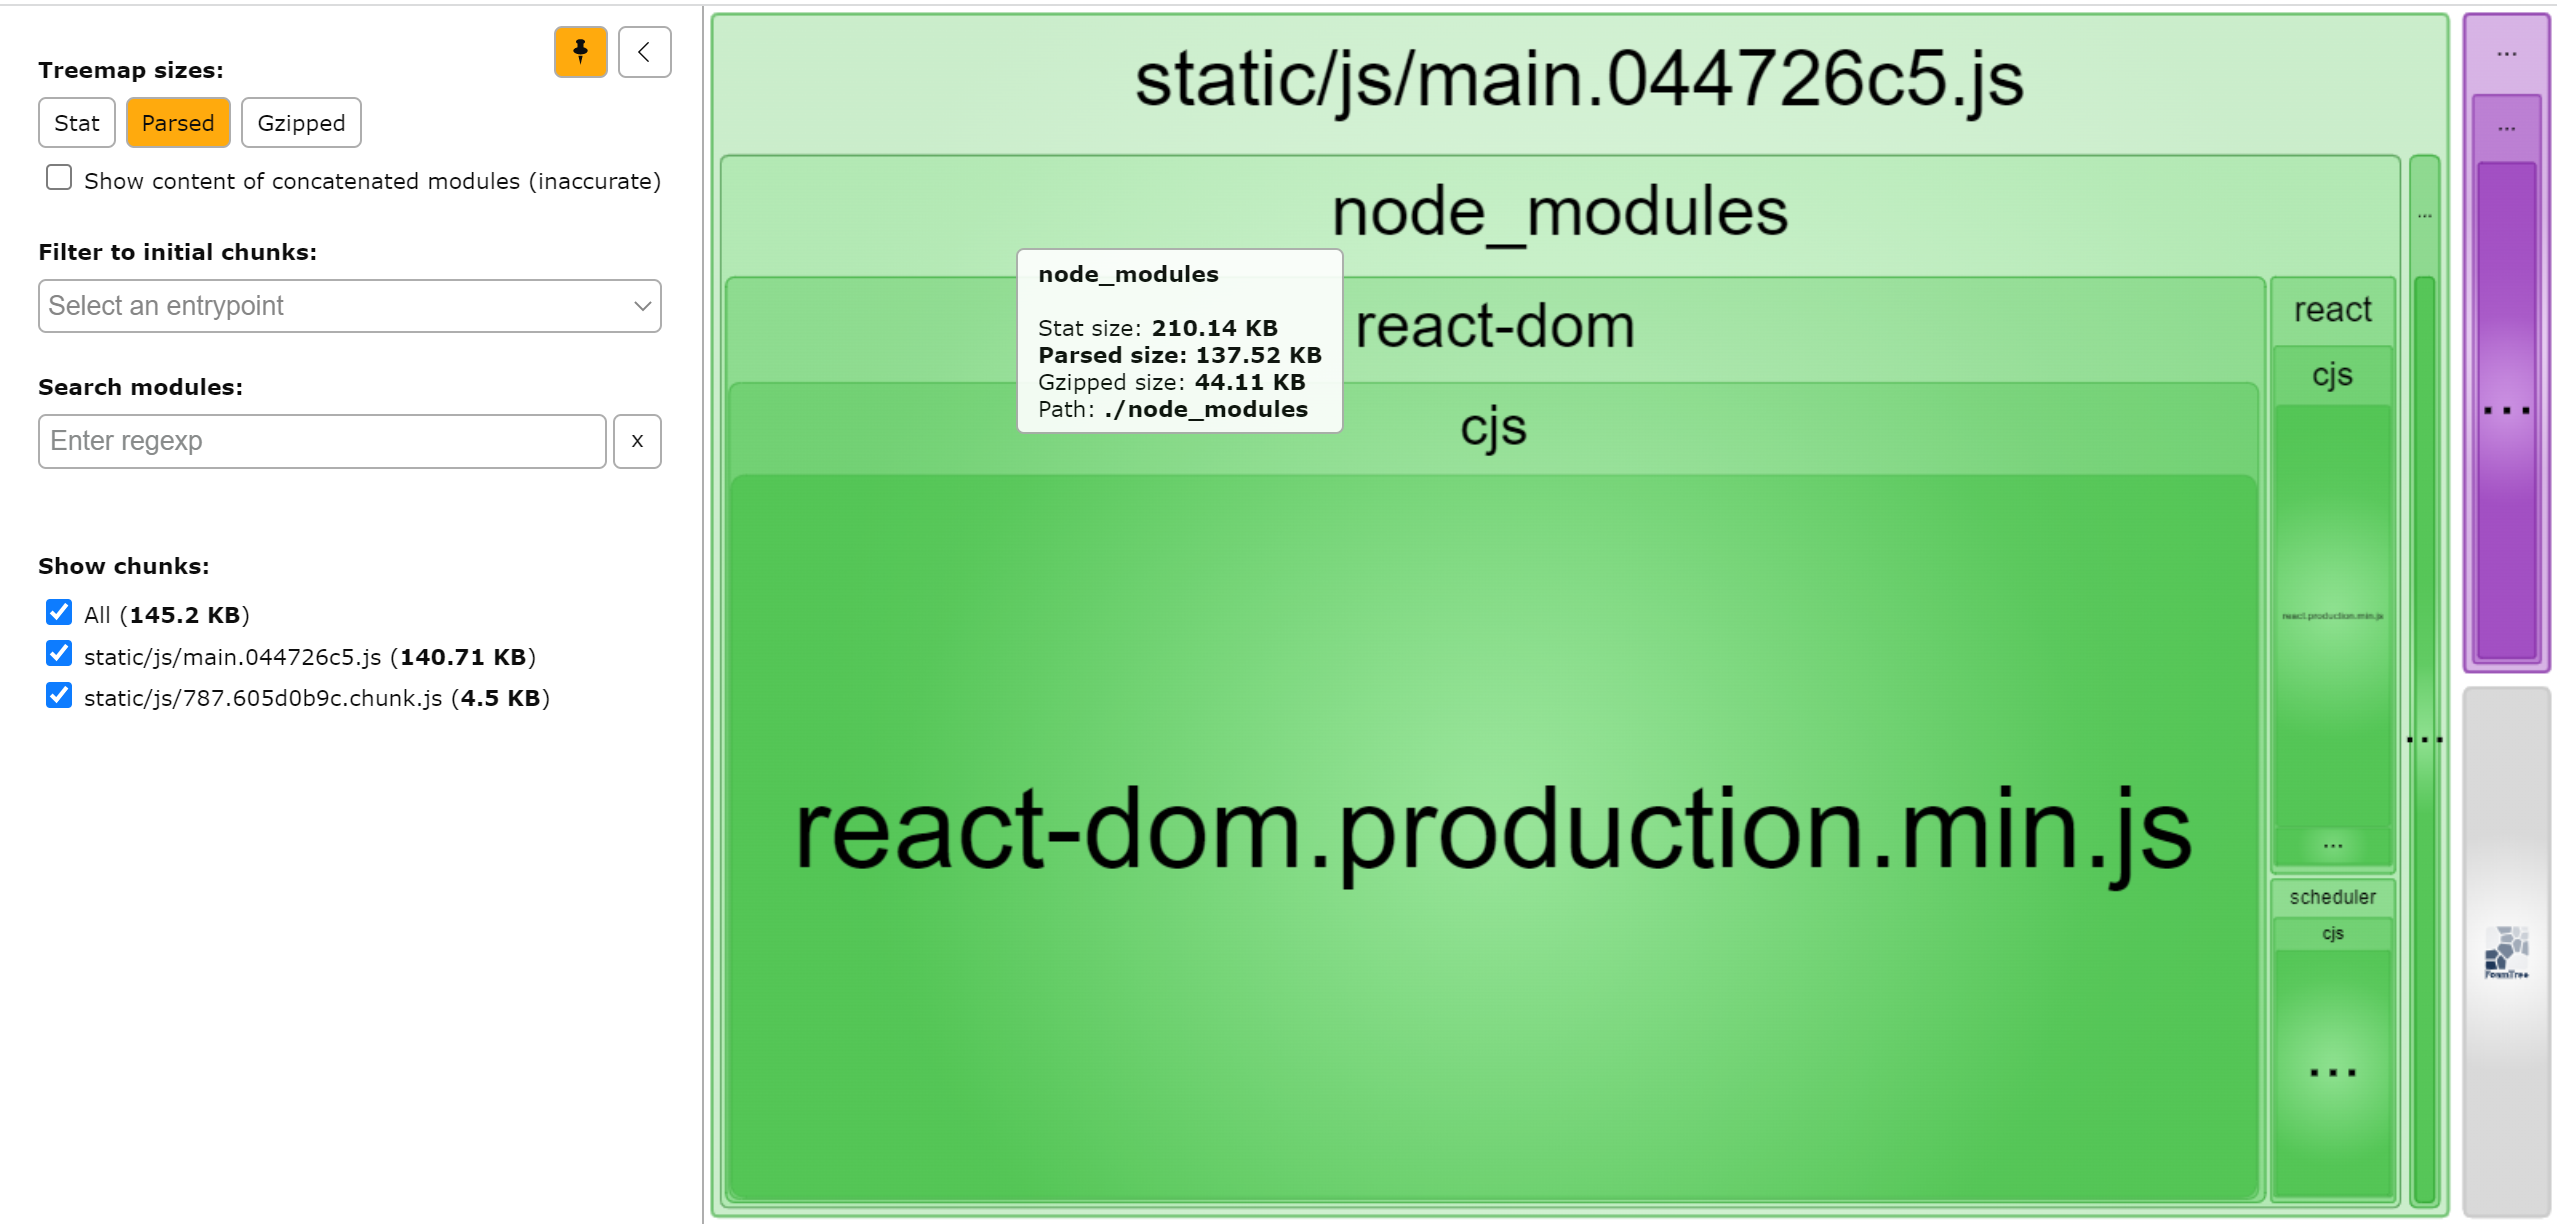
How to Diagnose Bundle Bloat:
## For Create React App projects
npm run build
npx webpack-bundle-analyzer build/static/js/*.js

## For Next.js projects
npm run build
npx @next/bundle-analyzer

## For Vite projects
npm run build -- --analyze
npx vite-bundle-analyzer dist

## Universal method (works anywhere)
npm install -g source-map-explorer
npm run build
npx source-map-explorer build/static/js/*.js
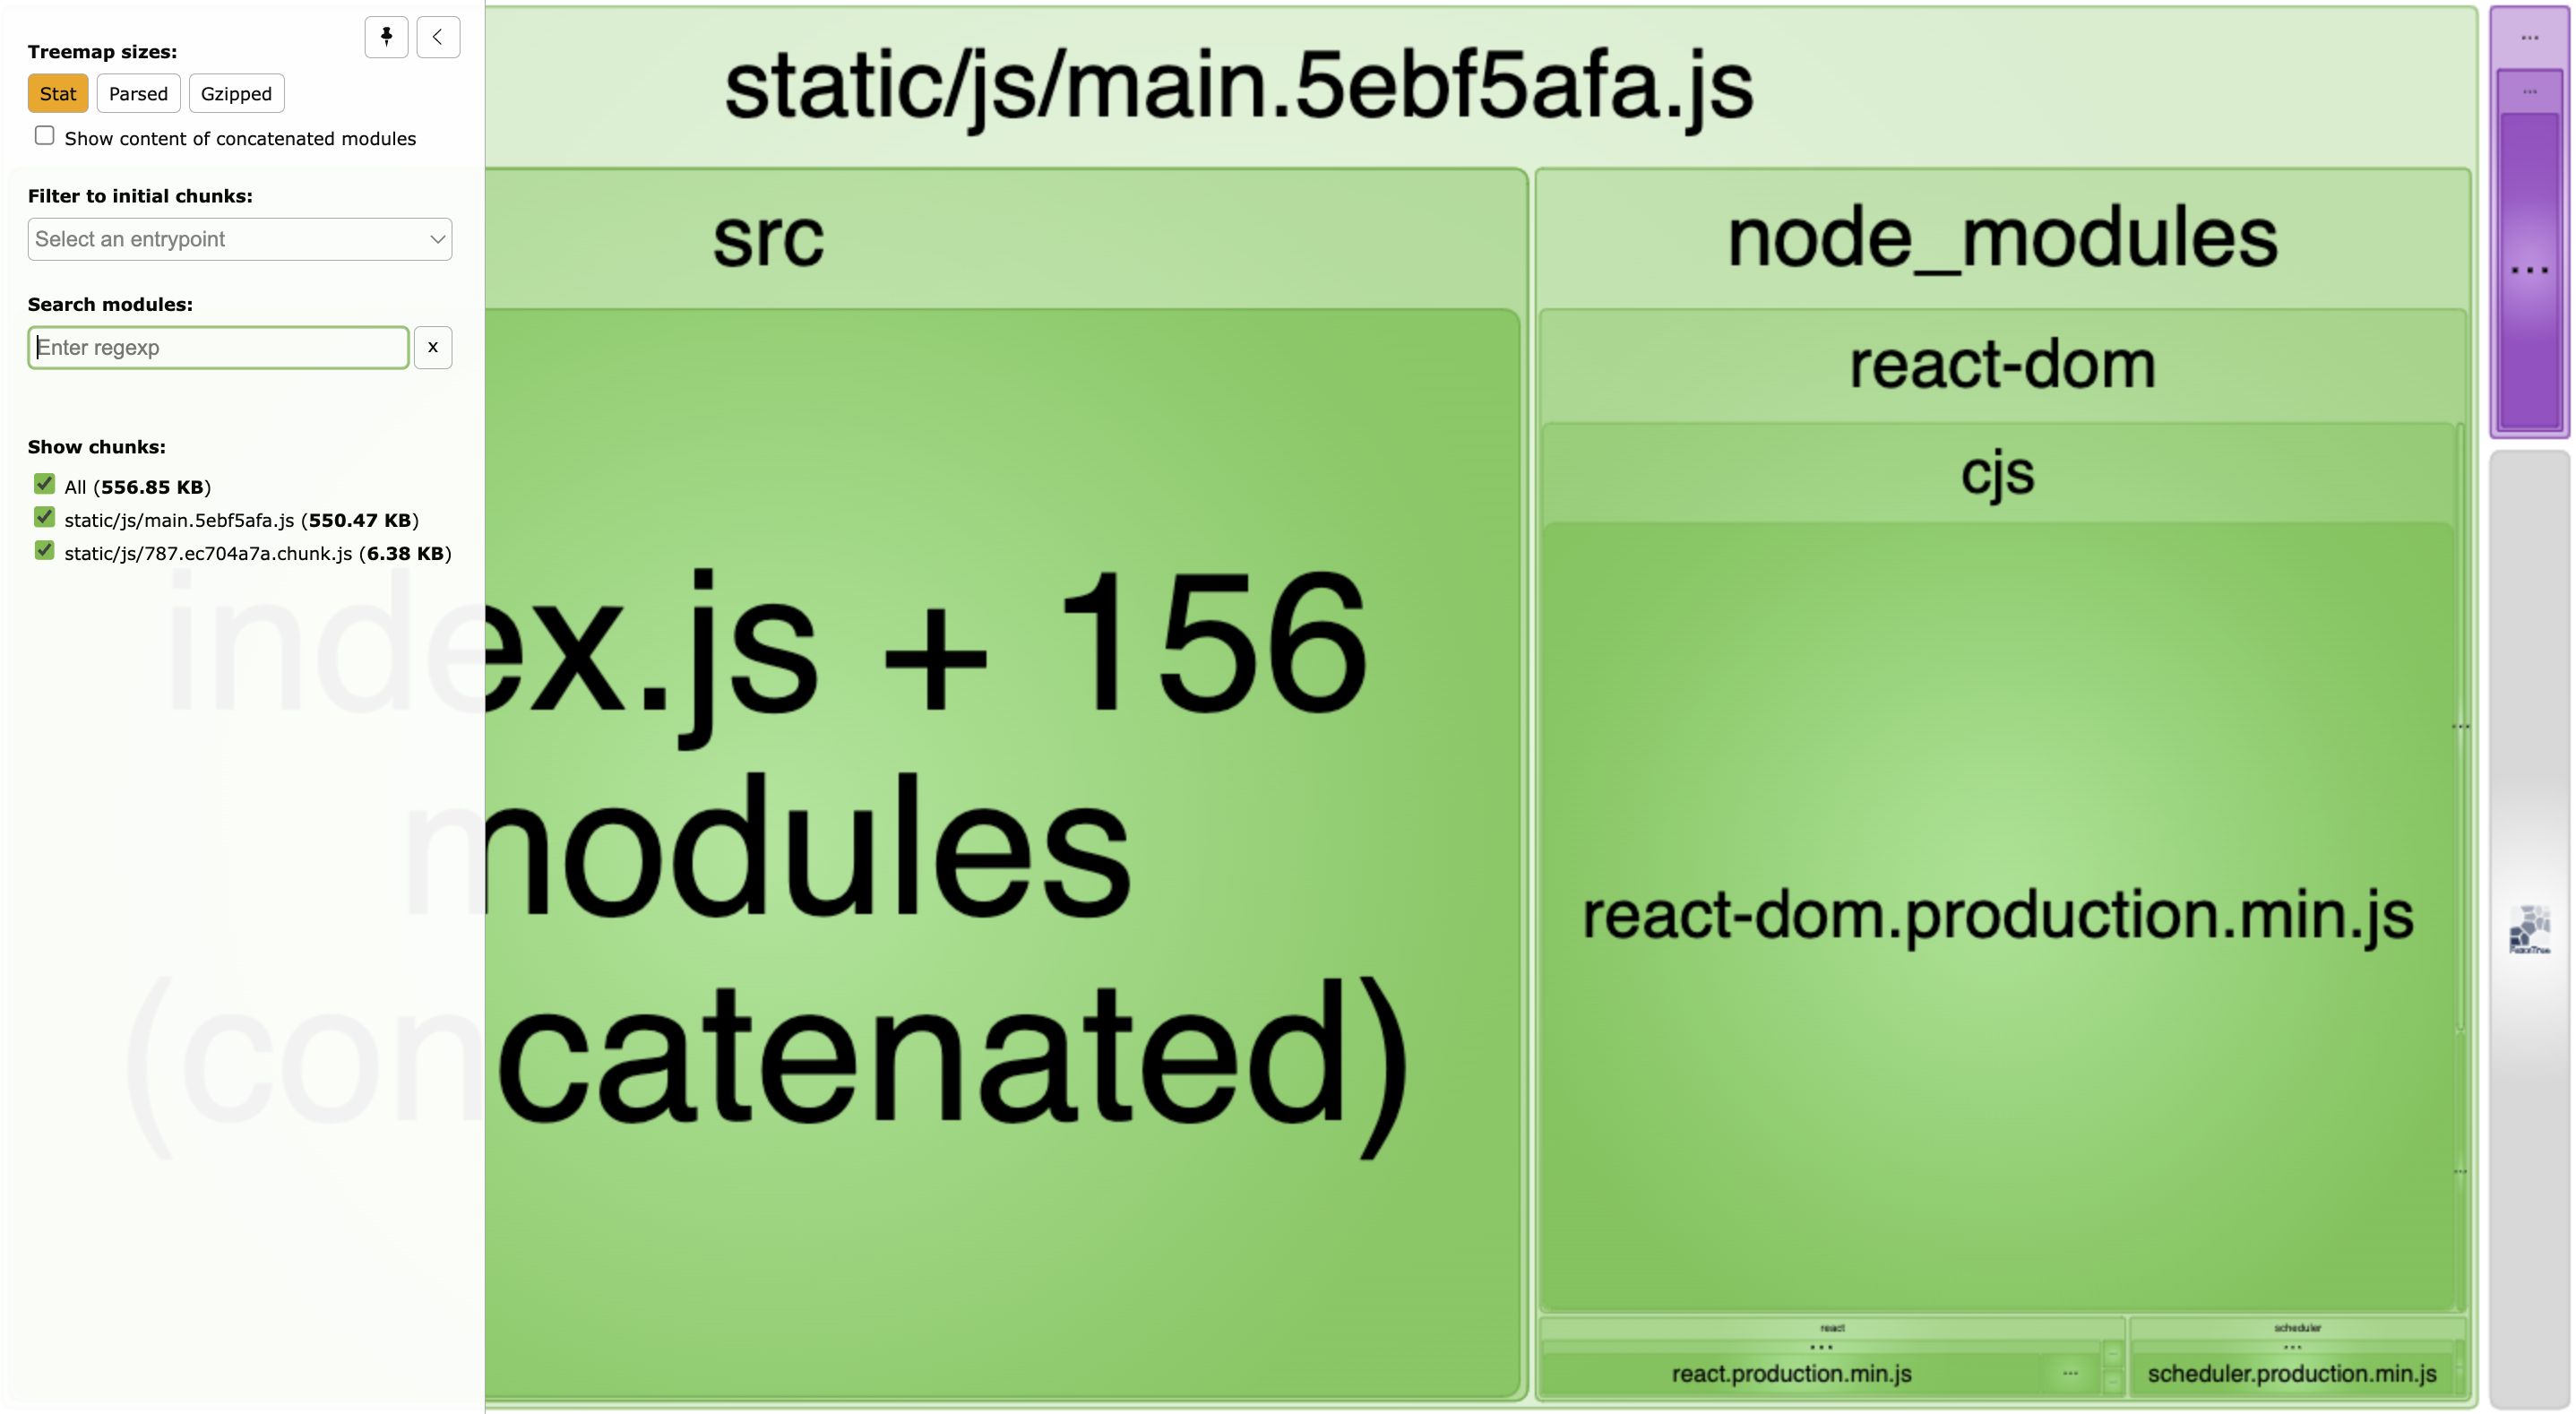
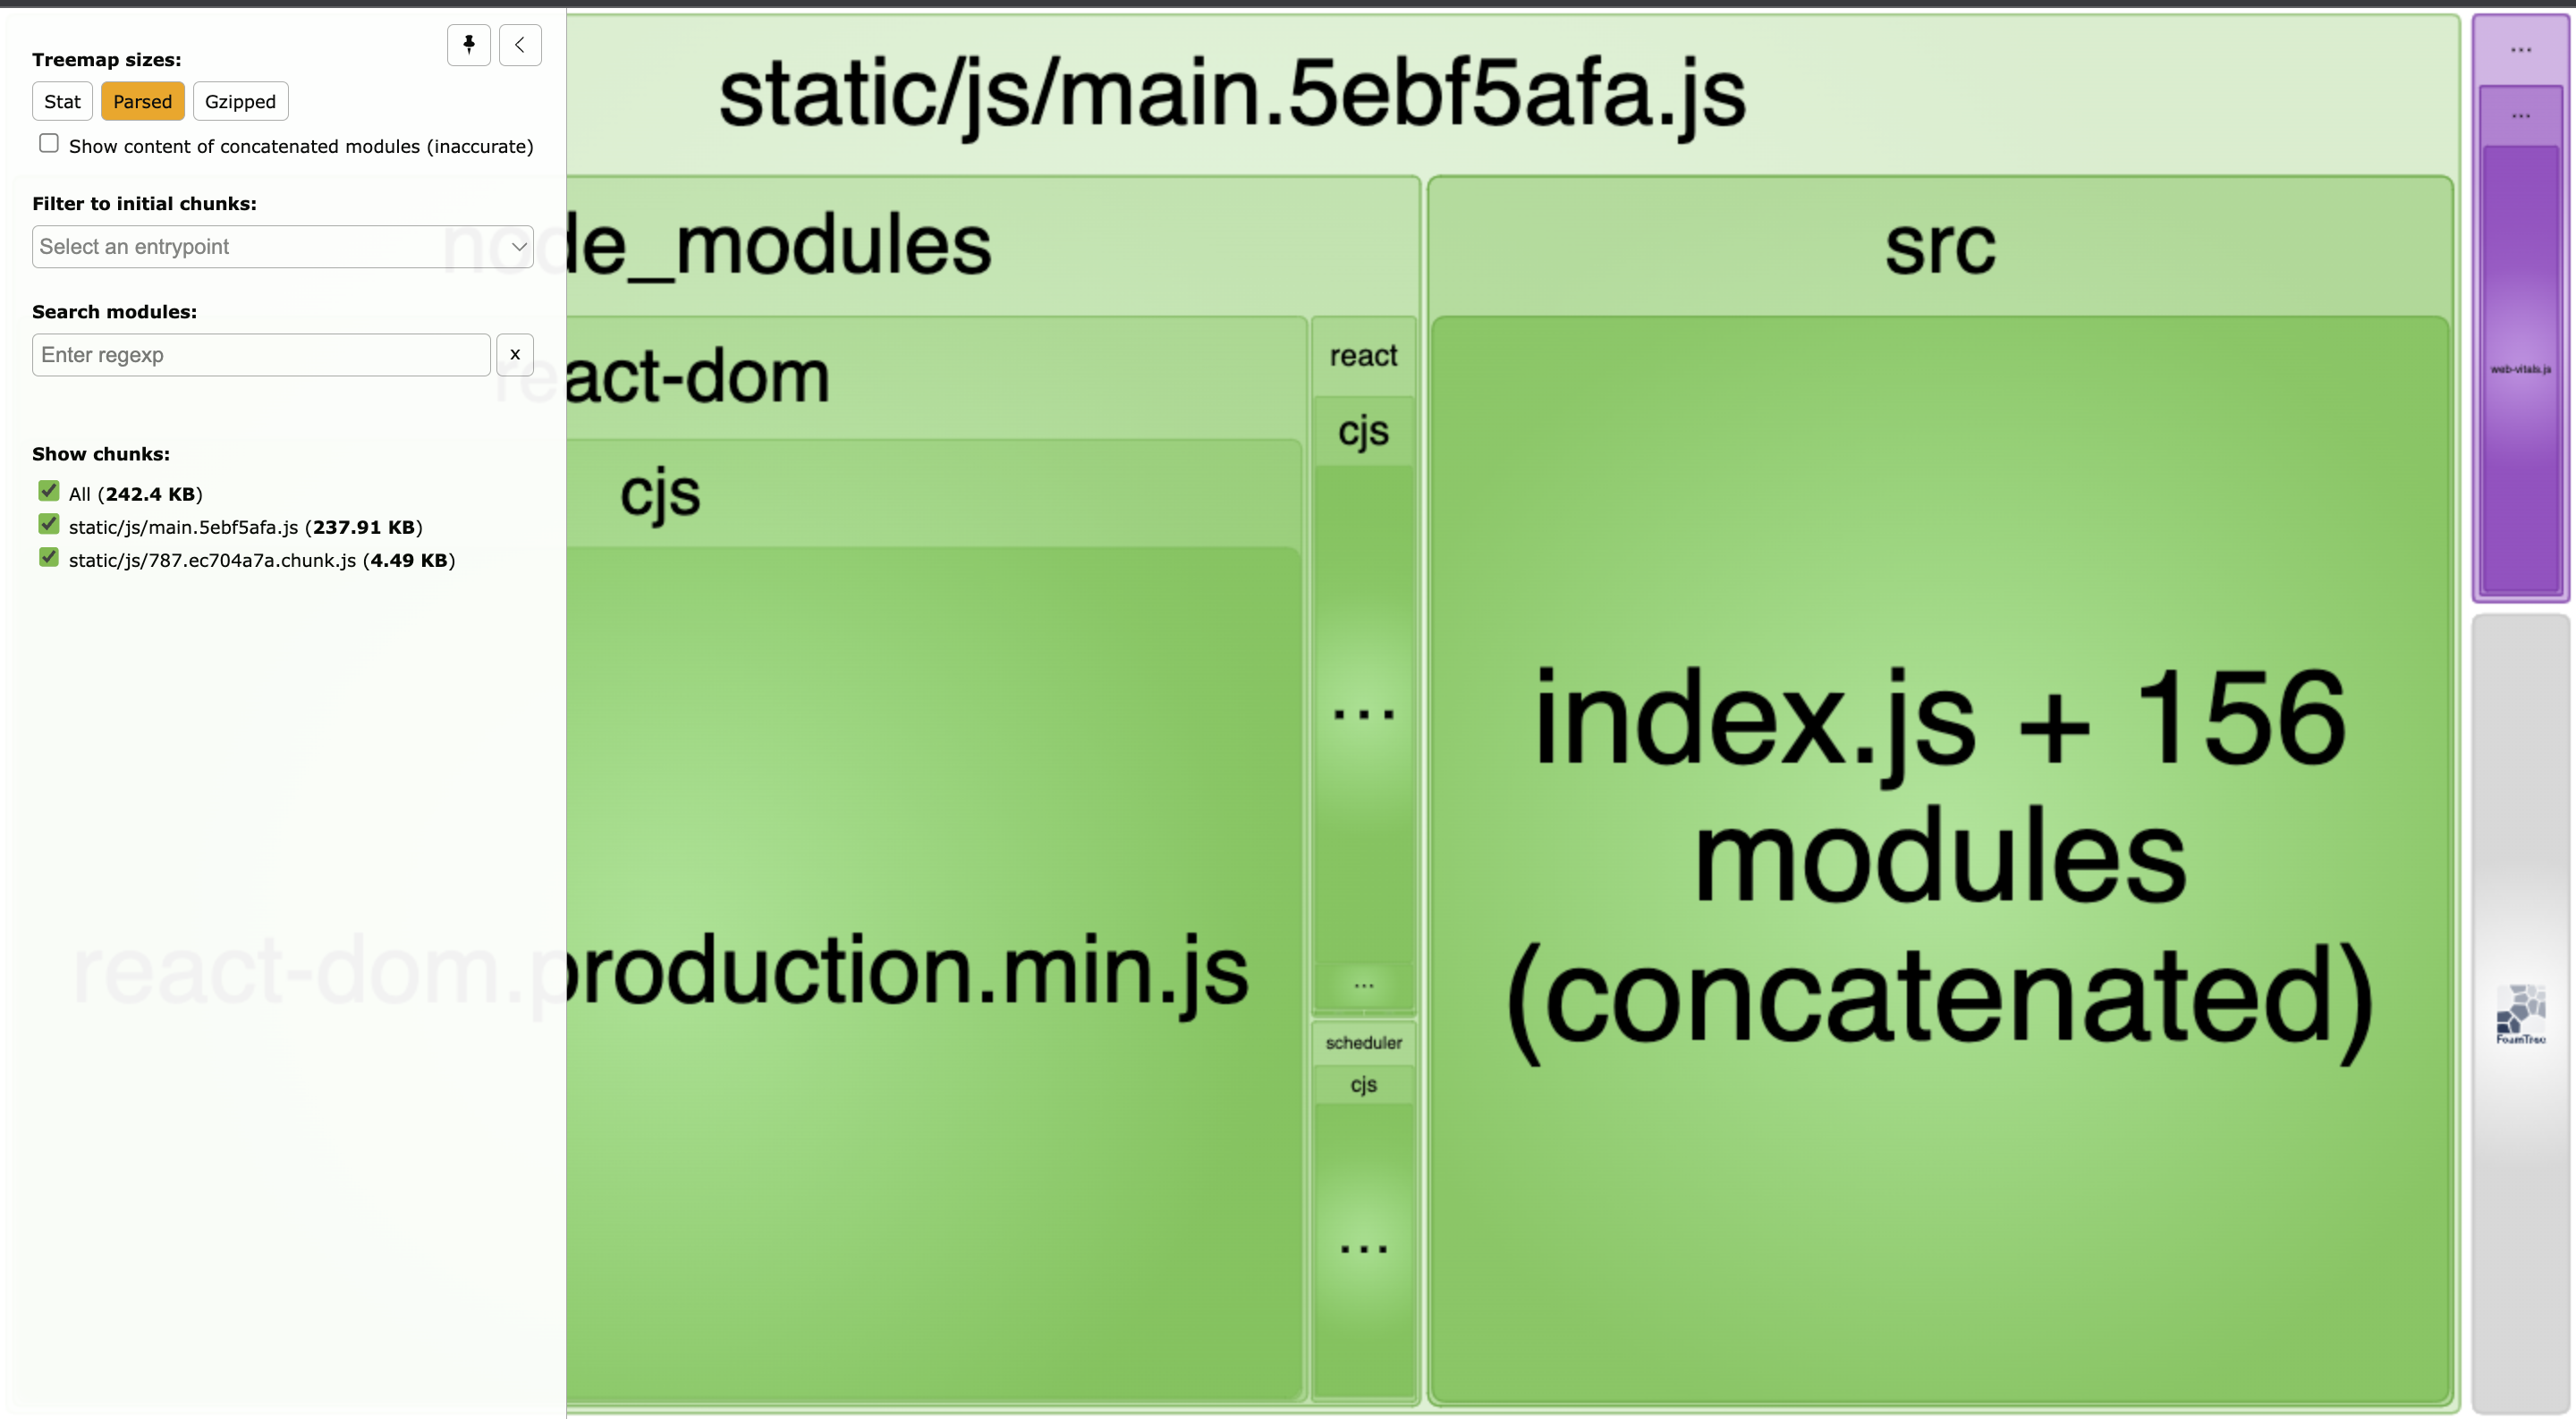
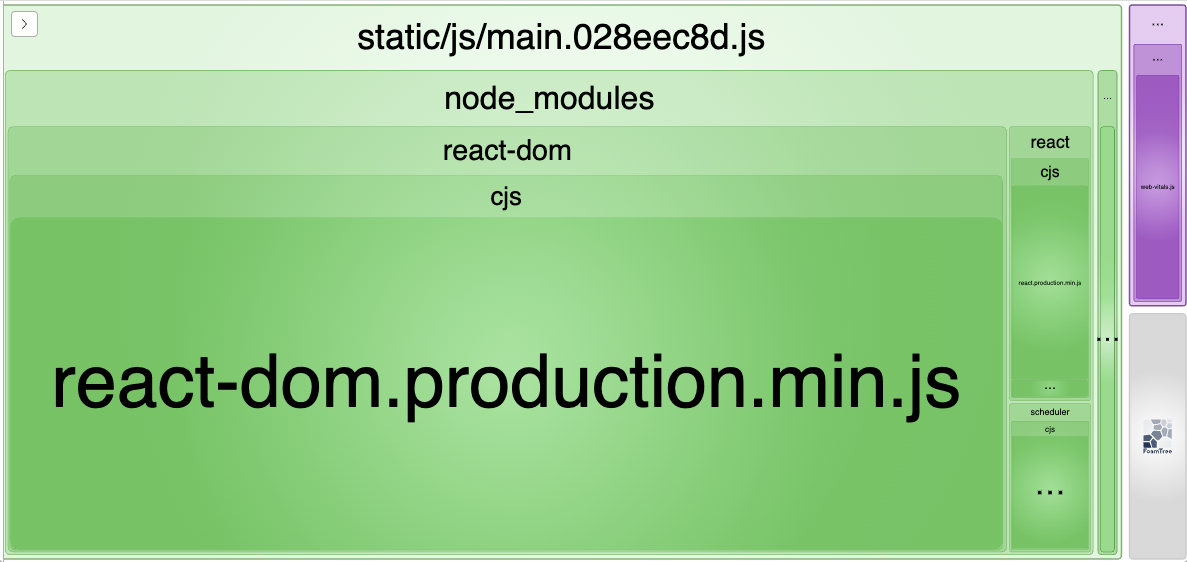
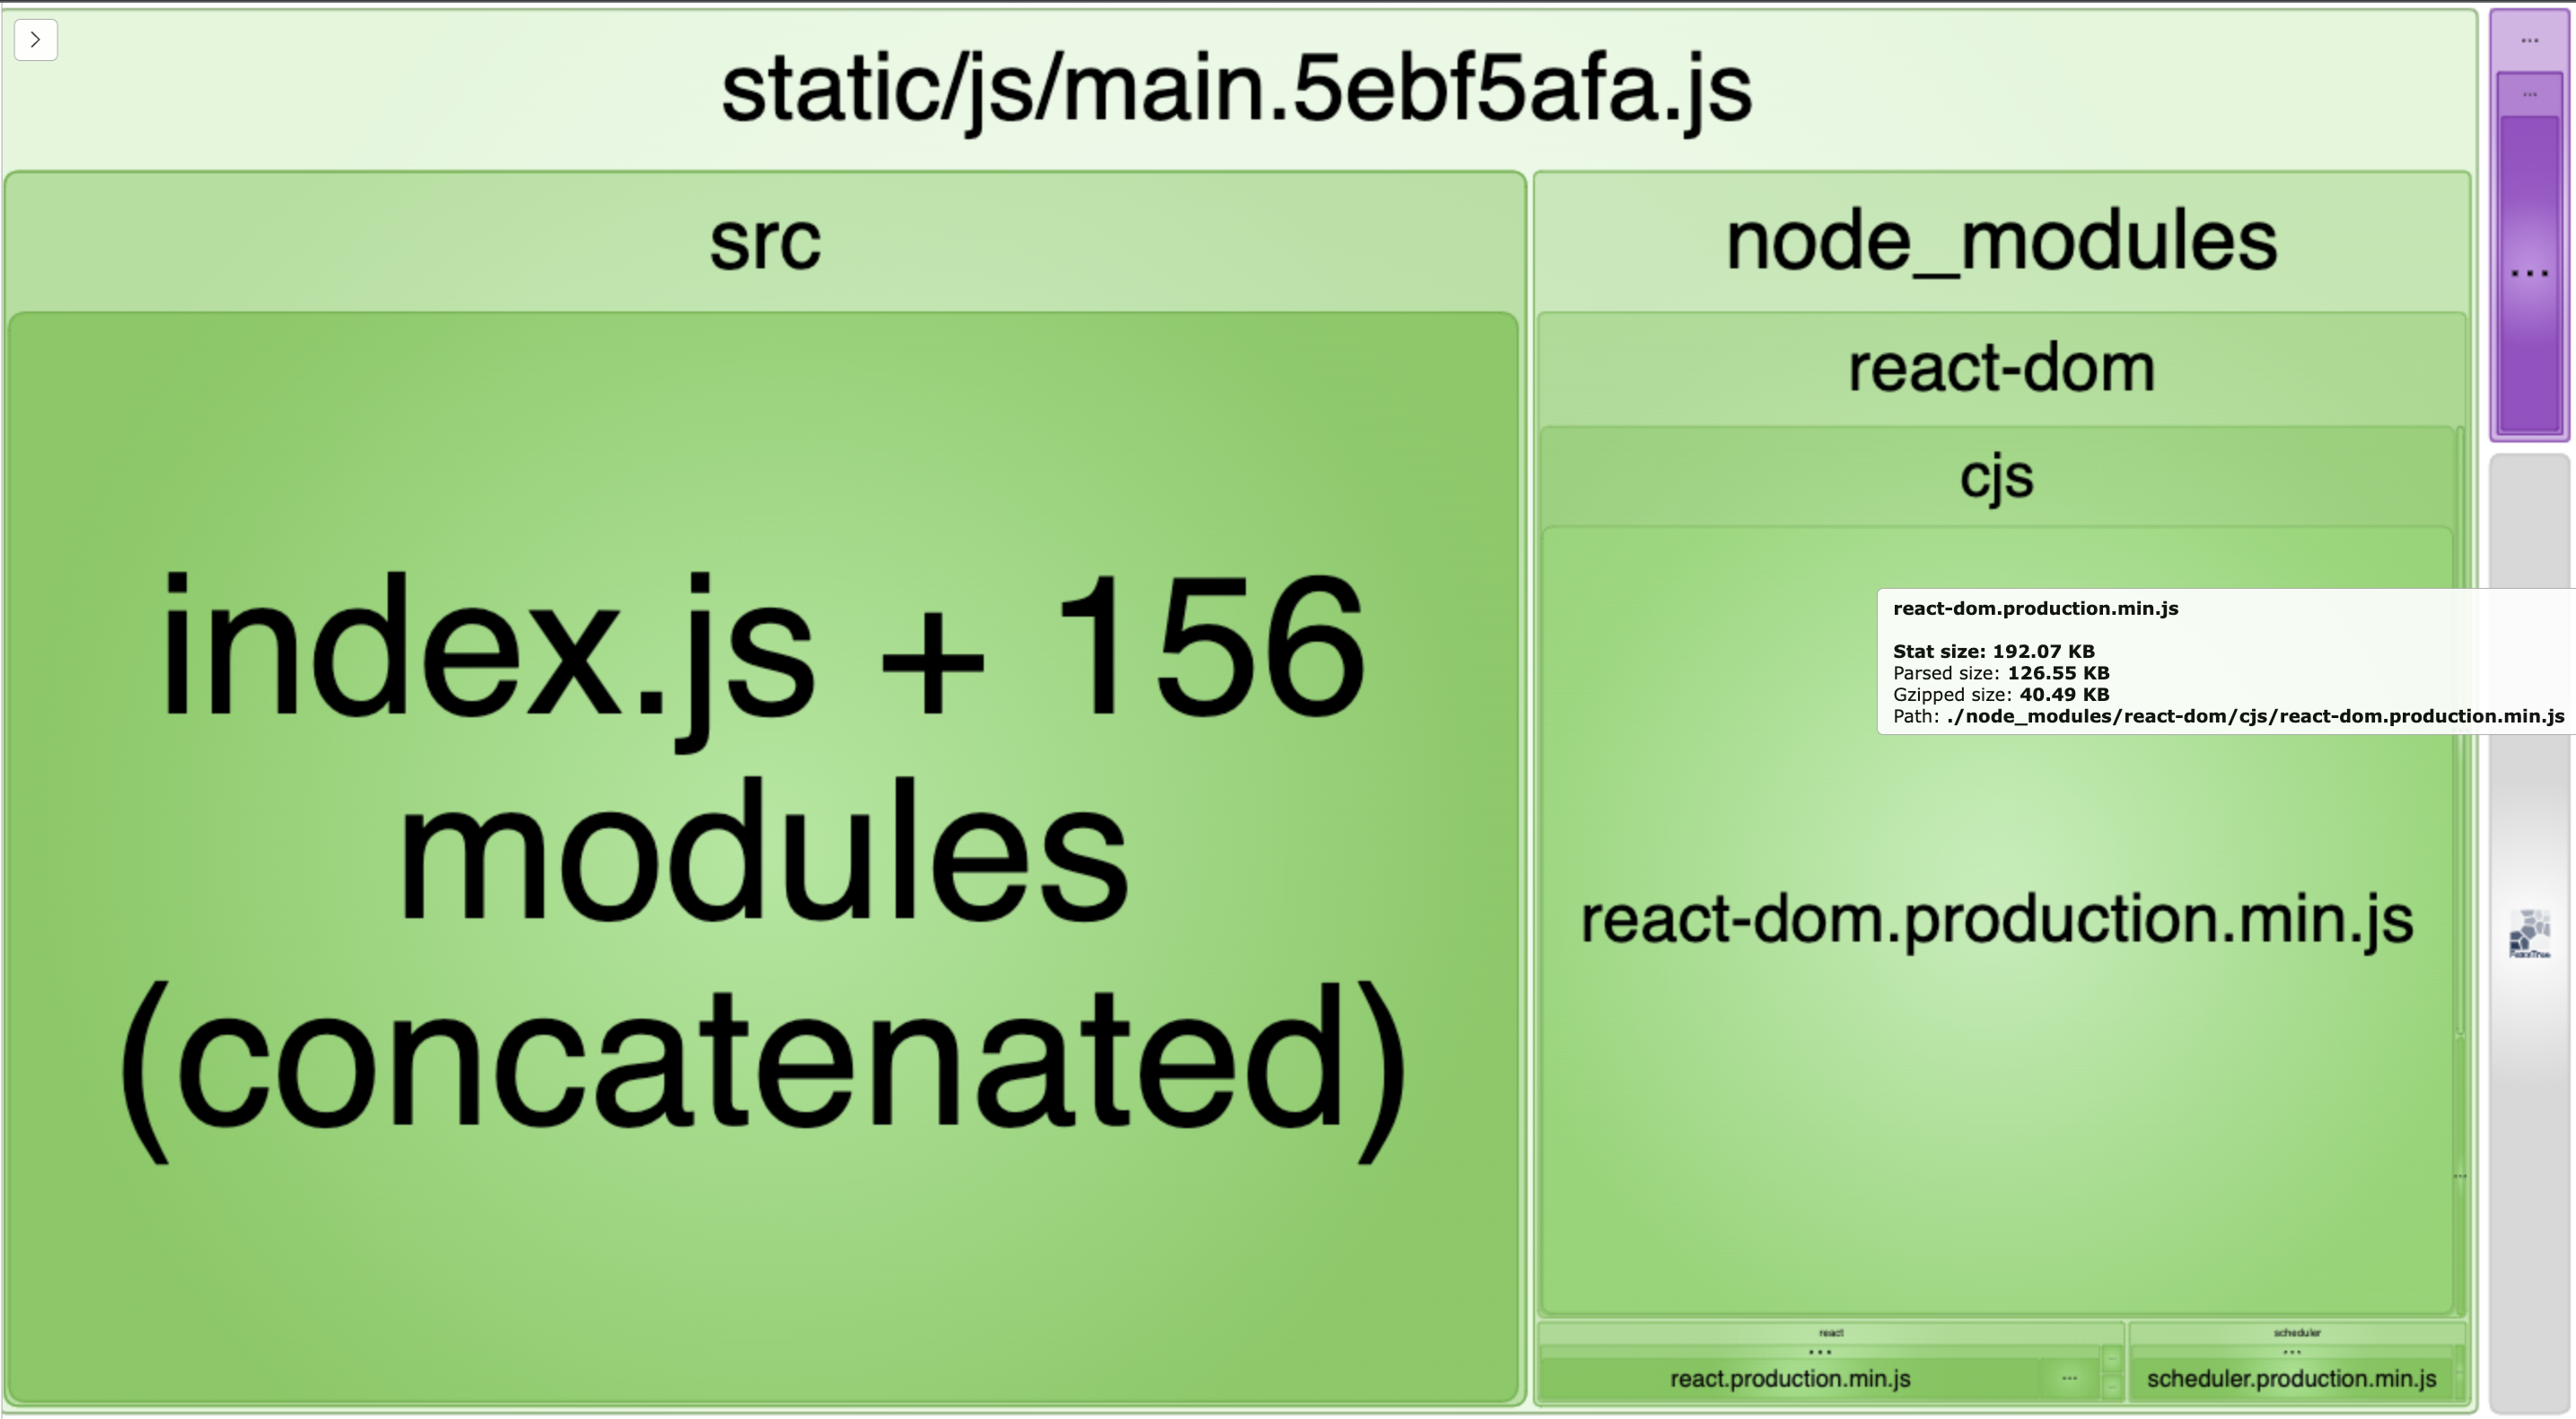
You'll see a visual treemap where large rectangles mean "this is murdering your bundle size." Common culprits:
- Date libraries - Moment.js adds 300KB, date-fns is much smaller at ~50KB
- Lodash imports -
import _ from 'lodash'imports the entire library (70KB), use tree-shaking imports instead - Unused dependencies - That animation library you tried once but forgot to remove, check with depcheck
- Icon libraries - Including 5,000 icons to use 10 of them, consider custom SVG icons
- Duplicate dependencies - Different versions of React or React-DOM, use npm ls to detect
The Fixes That Actually Work:
// ❌ BEFORE - Imports entire libraries
import _ from 'lodash';
import moment from 'moment';
import * as MaterialIcons from '@material-ui/icons';

// ✅ AFTER - Tree-shakeable imports
import debounce from 'lodash/debounce';
import { format } from 'date-fns/format';
import { Home, Settings } from '@material-ui/icons';
For more bundle analysis tools, check out webpack-bundle-analyzer documentation and source-map-explorer guide.
Here's the breakdown that'll make you want to punch something:
- Under 100KB - Holy shit, users actually wait for it to load
- 100KB to 500KB - Acceptable on decent connections. 3G users will hate you but whatever
- 500KB to 1MB - Slow as hell everywhere. Took me 3 weeks to get our main bundle from 800KB to 400KB
- Over 1MB - Might as well ask users to mail you a check and wait 6-8 weeks. I've seen 2MB+ bundles that took 45+ seconds on mobile, maybe a full minute
2. Render Performance Hell: Components That Won't Stop Re-rendering
The Problem: Your components re-render constantly, making the UI feel laggy and unresponsive.
I've debugged components that re-render 20+ times on a single keystroke - maybe 30 or 40 times on really fucked up forms. Typing felt like you were on 56k dial-up in 1995 - every character took like 200ms to appear because React was losing its shit re-rendering the entire form tree for no good reason.
Real Re-rendering Disasters:
Form Component Nightmare:
// ❌ This component re-renders on EVERY character typed
function ContactForm() {
  const [form, setForm] = useState({ name: '', email: '', message: '' });

  // Creates new object on every render = re-render hell
  const formConfig = {
    validation: { required: true, minLength: 3 },
    styling: { theme: 'dark', size: 'large' }
  };

  useEffect(() => {
    validateForm(form, formConfig); // Runs on every keypress
  }, [form, formConfig]); // formConfig is always "different"

  return (
    <div>
      <ExpensiveComponent config={formConfig} />
      <input
        value={form.name}
        onChange={(e) => setForm({...form, name: e.target.value})}
      />
    </div>
  );
}
What this clusterfuck felt like for users:
- Typing felt like you were on a 56k modem in 1998
- My laptop fans started spinning like it was mining Bitcoin, just from typing in a text field
- Mobile users definitely thought the app was broken - hell, it basically was
✅ The Optimized Version:
function ContactForm() {
  const [form, setForm] = useState({ name: '', email: '', message: '' });

  // Memoized configuration - stable reference
  const formConfig = useMemo(() => ({
    validation: { required: true, minLength: 3 },
    styling: { theme: 'dark', size: 'large' }
  }), []);

  // Debounced validation - doesn't run on every keystroke
  const debouncedValidation = useCallback(
    debounce((formData) => validateForm(formData, formConfig), 300),
    [formConfig]
  );

  useEffect(() => {
    debouncedValidation(form);
  }, [form, debouncedValidation]);

  return (
    <div>
      <ExpensiveComponent config={formConfig} />
      <input
        value={form.name}
        onChange={(e) => setForm({...form, name: e.target.value})}
      />
    </div>
  );
}

// Memoized expensive component
const ExpensiveComponent = React.memo(({ config }) => {
  // Only re-renders when config actually changes
  return <div>Expensive calculations here...</div>;
});
How to Debug Re-rendering Issues:
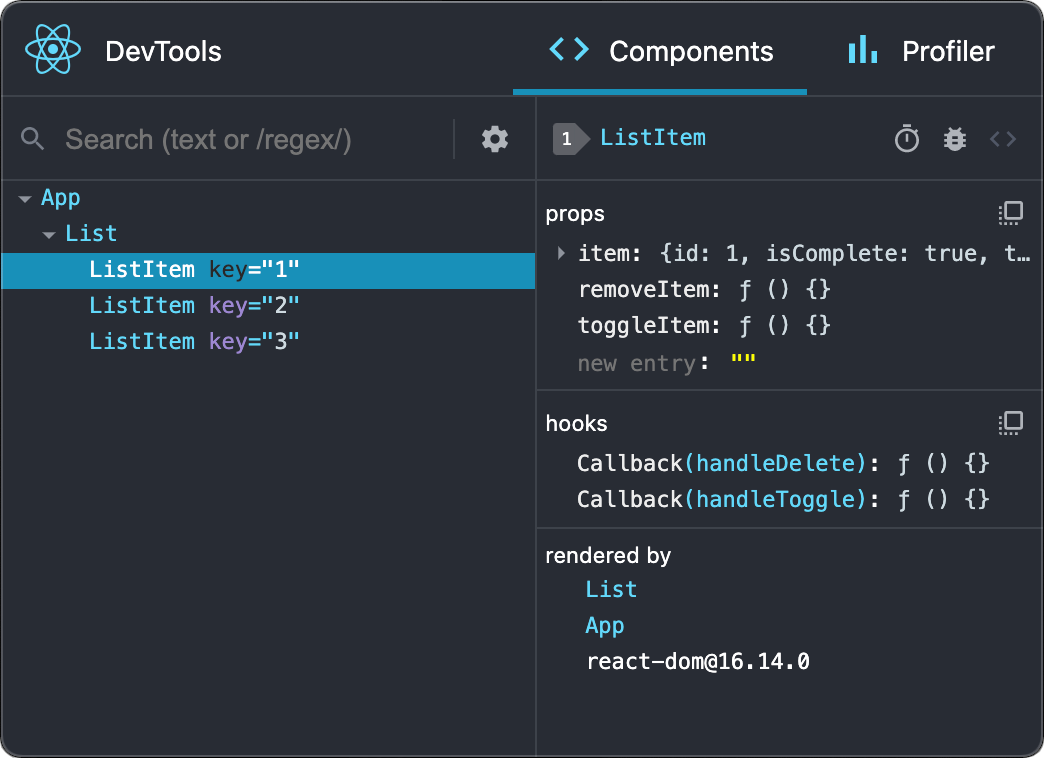
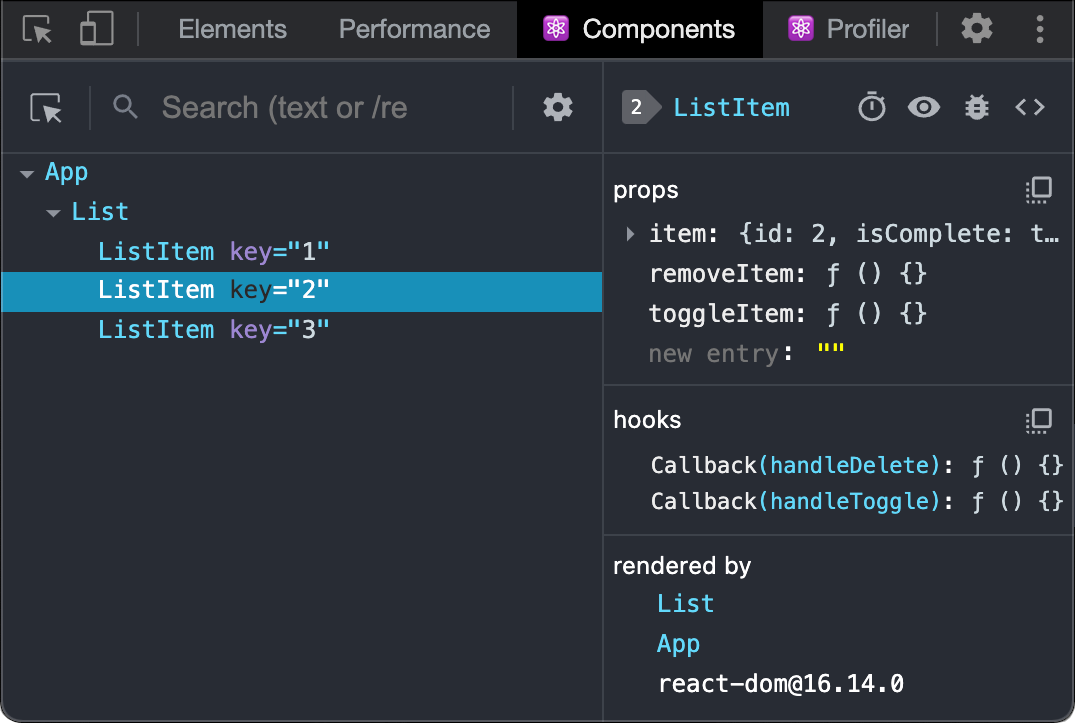
Use React DevTools Profiler:
- Enable "Highlight updates when components render"
- Record a profile during problematic interactions
- Look for components that render multiple times
- Check "Why did this render?" to see what changed
Add Strategic Logging:
function ProblematicComponent({ data, filters, settings }) {
  // Log what's causing re-renders
  const renderCount = useRef(0);
  renderCount.current++;

  console.log(`Render #${renderCount.current}`, {
    data: data,
    filters: filters,
    settings: settings,
    timestamp: Date.now()
  });

  return <div>Component content</div>;
}
3. Context API Performance Disasters
The Problem: Using React Context for frequently changing data causes massive re-render cascades.
Context works fine for stuff that barely changes - user auth, themes, whatever. But it's absolutely terrible for anything that updates constantly like form inputs or shopping cart updates. Trust me on this one.
The Context nightmare:
// ❌ This will re-render EVERYTHING consuming UserContext
function App() {
  const [user, setUser] = useState({
    id: 1,
    name: 'John',
    preferences: { theme: 'dark', notifications: true },
    cart: { items: [], total: 0 }
  });

  return (
    <UserContext.Provider value={{ user, setUser }}>
      <Navigation /> {/* Re-renders when cart changes */}
      <ProductList /> {/* Re-renders when theme changes */}
      <ShoppingCart /> {/* Re-renders when notifications change */}
      <Footer /> {/* Re-renders for everything */}
    </UserContext.Provider>
  );
}
Every time the shopping cart updates, the navigation, product list, and footer all re-render unnecessarily.
✅ Split Contexts by Update Frequency:
// Rarely changing data
function UserPreferencesProvider({ children }) {
  const [preferences, setPreferences] = useState({ theme: 'dark' });
  return (
    <UserPreferencesContext.Provider value={{ preferences, setPreferences }}>
      {children}
    </UserPreferencesContext.Provider>
  );
}

// Frequently changing data
function ShoppingCartProvider({ children }) {
  const [cart, setCart] = useState({ items: [], total: 0 });
  return (
    <ShoppingCartContext.Provider value={{ cart, setCart }}>
      {children}
    </ShoppingCartContext.Provider>
  );
}

// Composed providers
function App() {
  return (
    <UserPreferencesProvider>
      <ShoppingCartProvider>
        <Navigation /> {/* Only re-renders for cart changes */}
        <ProductList /> {/* Only re-renders for theme changes */}
        <ShoppingCart /> {/* Only re-renders for cart changes */}
        <Footer /> {/* Never re-renders unless needed */}
      </ShoppingCartProvider>
    </UserPreferencesProvider>
  );
}
4. Image and Asset Loading Disasters
The Problem: Massive, unoptimized images and assets kill your app's performance.
I've seen React apps loading 180MB hero videos on every page visit, 5MB uncompressed images for 200px thumbnails, and loading all images immediately regardless of viewport visibility.
Image Performance Killers:
Marketing disaster I inherited:
- Some marketing genius uploaded a massive hero video - had to be 150MB or 180MB, maybe more? I stopped measuring after it hit "stupid big" territory. On every single fucking page.
- Product images were insane - definitely 4MB+, probably closer to 6MB each - just to show 200px thumbnails. Loading like 30 or 40 at once because infinite scroll
- Mobile users waited forever - 45 seconds at least, maybe a full minute on 3G - just to interact with the page
- Lighthouse score was pathetic - single digits for sure. Got an 8, then a 12, then a 9. Thought my connection was broken
✅ Image Optimization Fixes:
// ❌ BEFORE - Performance killer
function ProductGallery({ products }) {
  return (
    <div>
      {products.map(product => (
        <img
          key={product.id}
          src={product.highResImage} // 5MB image
          alt={product.name}
          style={{ width: 200, height: 200 }}
        />
      ))}
    </div>
  );
}

// ✅ AFTER - Optimized loading
function ProductGallery({ products }) {
  return (
    <div>
      {products.map(product => (
        <img
          key={product.id}
          src={product.thumbnailImage} // 50KB optimized thumbnail
          srcSet={`
            ${product.thumbnailImage} 200w,
            ${product.mediumImage} 400w,
            ${product.highResImage} 800w
          `}
          sizes="(max-width: 768px) 200px, 400px"
          alt={product.name}
          loading="lazy" // Only load when approaching viewport
          style={{ width: 200, height: 200 }}
        />
      ))}
    </div>
  );
}
Modern Image Optimization Strategies:
- Use modern formats: WebP reduces file size by 25-50% compared to JPEG
- Implement lazy loading:
loading="lazy"for below-the-fold images - Proper sizing: Use
srcSetandsizesfor responsive images - CDN optimization: Serve images from a global CDN with automatic optimization
5. Memory Leaks: The Slow Death of Your App
The Problem: Your React app gradually consumes more memory until it crashes or becomes unusably slow.
Common Memory Leak Sources:
Event Listener Leaks:
// ❌ Memory leak - listener never removed
function WindowResizeComponent() {
  const [windowSize, setWindowSize] = useState(window.innerWidth);

  useEffect(() => {
    const handleResize = () => setWindowSize(window.innerWidth);
    window.addEventListener('resize', handleResize);
    // Missing cleanup! Listener persists after component unmounts
  }, []);

  return <div>Window size: {windowSize}</div>;
}

// ✅ Proper cleanup
function WindowResizeComponent() {
  const [windowSize, setWindowSize] = useState(window.innerWidth);

  useEffect(() => {
    const handleResize = () => setWindowSize(window.innerWidth);
    window.addEventListener('resize', handleResize);

    return () => {
      window.removeEventListener('resize', handleResize);
    };
  }, []);

  return <div>Window size: {windowSize}</div>;
}
Timer and Interval Leaks:
// ❌ Memory leak - timer continues after unmount
function Timer() {
  const [count, setCount] = useState(0);

  useEffect(() => {
    const interval = setInterval(() => {
      setCount(c => c + 1);
    }, 1000);
    // Missing cleanup!
  }, []);

  return <div>Count: {count}</div>;
}

// ✅ Proper cleanup
function Timer() {
  const [count, setCount] = useState(0);

  useEffect(() => {
    const interval = setInterval(() => {
      setCount(c => c + 1);
    }, 1000);

    return () => clearInterval(interval);
  }, []);

  return <div>Count: {count}</div>;
}
How to Detect Memory Leaks:
Chrome DevTools Memory Tab:
- Take heap snapshots before and after interactions
- Look for objects that aren't being garbage collected
- Check for detached DOM nodes
Performance Monitoring:
- Monitor memory usage over time during user sessions
- Set up alerts for abnormal memory growth patterns
- Profile memory usage in production environments
The key insight: React performance problems aren't mysterious black magic - they're predictable patterns that repeat across codebases. Master these five patterns and you'll transform React apps from slow disasters into fast, responsive experiences that users actually want to use.
For deeper understanding of React performance patterns, explore these resources: