JupyterLab Will Eat Your RAM and Laugh While Doing It

I've lost more work to kernel deaths than I care to admit. You're analyzing a dataset, everything's running smooth, then BAM - kernel dies. No warning, no error message, just a dead kernel and 3 hours of work gone. If this sounds familiar, welcome to the club of developers who've learned to fear the dreaded "Kernel has died. Restarting..." message.
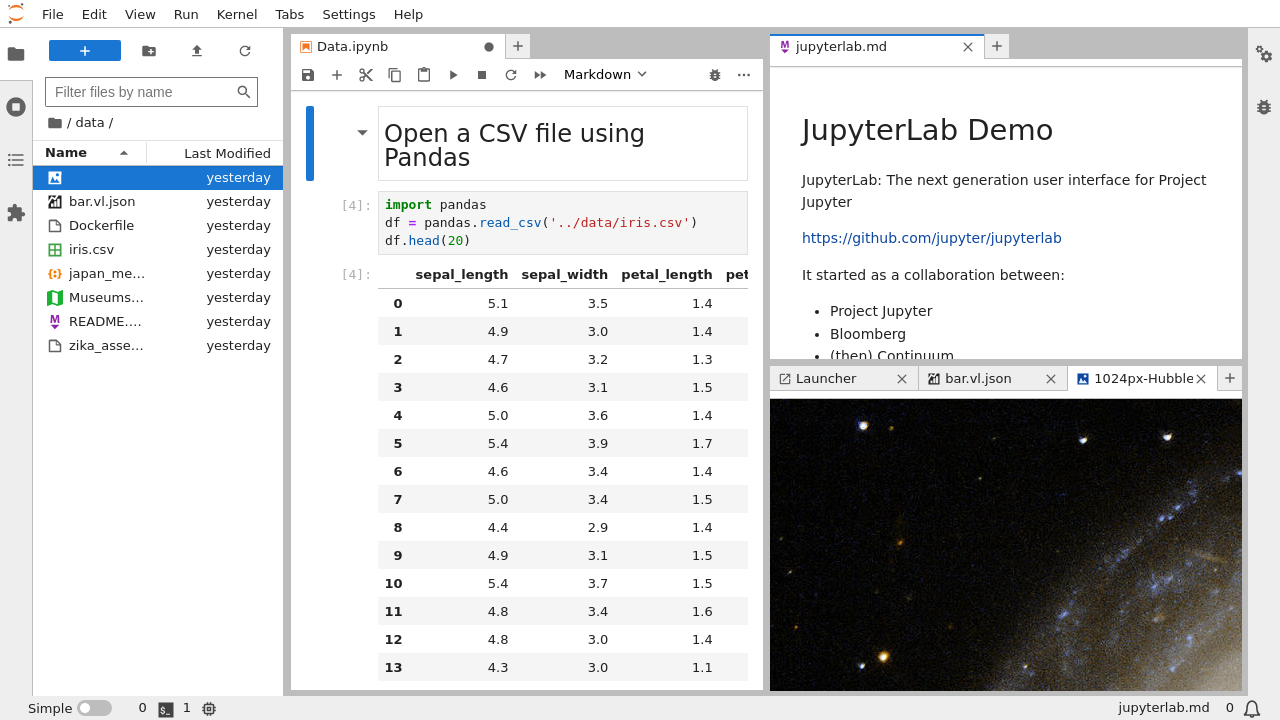
JupyterLab Interface

The Memory Management Nightmare That Is JupyterLab

Here's what nobody tells you: JupyterLab is basically a browser running inside another browser, and it's hungry as hell. You've got:

  • Browser memory: Your interface, plots, and every cell output eating RAM
  • Kernel memory: Your actual Python process with variables and data
  • System overhead: Extensions, server processes, and other background crap

I learned this the hard way when my "small" 2GB CSV crashed my 16GB laptop and froze the entire system. Turns out pandas needs 5-10x the file size in RAM just to load a CSV because it's doing type inference, creating indexes, and making temporary copies all over the place.

JupyterLab 4.4's Performance Fixes (Released May 21, 2025)

The JupyterLab 4.4 release fixed some issues but not the core problem:

  • CSS optimization: Browser doesn't choke as much with many cells
  • Memory leak fixes: Extensions clean up better (finally)
  • Better startup: Loads faster, fails faster too

But here's the brutal truth: these improvements won't save you from the fundamental issue that pandas tries to load everything into memory at once.

The Size Categories That Will Screw You Over

Small datasets (< 1GB): These seem fine until you accidentally render a massive matplotlib plot that crashes your browser. I once spent 2 hours debugging why my notebook froze, only to realize a single plot was consuming 8GB of browser memory.

Medium datasets (1-5GB): This is where shit hits the fan. Your innocent 2GB CSV becomes a 12GB memory monster when pandas starts doing its thing. Your 16GB laptop? Good luck - the OS will start swapping and everything becomes unusable.

Large datasets (> 5GB): Forget pandas. Just forget it. If you try to pd.read_csv() anything this size, you deserve the kernel death you're about to get.

Why Standard JupyterLab Monitoring Sucks

JupyterLab won't tell you about memory problems until it's too late. No warning, no "hey you're about to run out of memory" - just sudden death. You need jupyter-resource-usage installed ASAP or you're flying blind:

pip install jupyter-resource-usage
## Restart JupyterLab to see the memory indicator

Even then, it only shows total system memory, not which variables are eating your RAM. For that nightmare, you need memory_profiler or Fil profiler. You can also try psutil for system monitoring, tracemalloc for Python memory tracking, or Memray for comprehensive memory profiling.

The "Solutions" That Don't Actually Work

"Buy more RAM": Yeah, because everyone has $2000 lying around for 64GB. Plus your datasets will just grow to fill whatever you have.

"Use a remote server": Great, now your notebook is slow as hell AND you can't see what's happening when it crashes. Network timeouts become your new best friend.

"Optimize your pandas code": Sure, but pandas still needs to make temporary copies during operations. Your "optimized" groupby still spikes to 40GB before settling down.

The actual solution is to stop trying to load everything into memory at once. Use Dask for familiar pandas syntax with lazy evaluation, Vaex for billion-row interactive exploration, Polars for lightning-fast performance, or Ray for distributed data processing. For traditional databases, consider DuckDB for analytical workloads.

How Your Kernel Will Die (A Field Guide)

I've seen these failure patterns countless times:

  1. Silent death: Kernel just stops. No error message, no logs, no nothing. Check your system logs for the OS memory killer.
  2. Browser freeze: Everything locks up, can't even save your work. Force-quit and hope autosave worked.
  3. System lockup: Your entire computer becomes unusable as swap files fill up. Hard reset incoming.
  4. Timeout death: Long-running operations just... stop. No completion, no error, just eternal waiting.

Each one requires different survival strategies, which we'll cover in the tools section.

JupyterLab Performance Problems That Will Ruin Your Day

Q

Why does my kernel randomly die with no fucking error message?

A

Your kernel got murdered by the OS memory killer.

JupyterLab's interface won't tell you this

  • it just pretends everything is fine while your kernel is already dead. Check the terminal where you started JupyterLab and you'll see the brutal truth: Killed (signal 15) SIGTERM or similar.

Install jupyter-resource-usage or you'll keep getting blindsided by these deaths.

Q

How do I stop JupyterLab from crashing my entire goddamn computer?

A

This nightmare happens when JupyterLab eats all your RAM and your OS starts desperately swapping to disk. Everything becomes slower than molasses. Your only option? Kill the power button and lose everything. The fix: run JupyterLab in Docker with memory limits so the container dies instead of your system:

docker run --memory="4g" -p 8888:8888 jupyter/datascience-notebook

I learned this the hard way after losing a day's work to system freezes. Now the Docker container gets killed instead of my laptop turning into a brick.

Q

What's pandas' evil memory multiplication factor?

A

Pandas needs 5-10x your file size in RAM. That innocent 1GB CSV? It'll consume 8GB of memory when pandas does its type inference dance. I've seen a 500MB file spike to 6GB during read_csv() because pandas creates temporary copies for every operation.

Use %memit df = pd.read_csv('your_file.csv') to see the brutal truth. When your dataset approaches half your available RAM, abandon pandas and switch to Dask before you hate your life.

Q

How do I actually see what's eating my memory?

A

First, install the essential extension or you're flying blind:

pip install jupyter-resource-usage
## Restart JupyterLab - you'll see memory/CPU in the status bar

For the nuclear option when debugging memory spikes, use Fil profiler:

pip install filprofiler
fil-profile run your_script.py

Fil will generate a report showing exactly which line of code allocated the most memory. It's saved my ass multiple times when hunting down memory leaks.

Q

Why does a simple matplotlib plot crash my browser tab?

A

Because JupyterLab stores every plot in browser memory forever. Create one high-DPI plot or a complex scatter with 100k points? Your browser tab just consumed 4GB of RAM just to display it.

The fix: limit your figure sizes and close plots immediately:

plt.figure(figsize=(8,6), dpi=100)  # Don't go crazy with size
plt.plot(data)
plt.savefig('plot.png')
plt.close()  # THIS IS CRITICAL - frees the memory

For interactive plots, use plotly with WebGL - it doesn't store everything in browser memory.

Q

How the hell do I work with datasets larger than my RAM?

A

Stop. Just stop trying to pd.read_csv() that 10GB file. It will not work. Here are the options that actually work:

Chunking (for sequential processing):

results = []
for chunk in pd.read_csv('huge_file.csv', chunksize=50000):
    processed = chunk.groupby('category').mean()
    results.append(processed)
final_df = pd.concat(results).groupby(level=0).mean()

Dask (for familiar pandas syntax but lazy):

import dask.dataframe as dd
df = dd.read_csv('huge_file.csv')  # Doesn't actually load anything
result = df.groupby('category').mean().compute()  # Now it processes

Database approach (query first, load results):

query = "SELECT category, AVG(value) FROM huge_table GROUP BY category"
result = pd.read_sql(query, connection)  # Load only the results
Q

What do I do when JupyterLab turns into molasses?

A

Your notebook is probably hoarding memory like a digital pack rat. Here's the emergency cleanup:

  1. Clear all outputs: Cell → All Output → Clear - frees browser memory
  2. Kill variables: %reset - nukes everything in kernel memory
  3. Close tabs: Each notebook tab eats browser RAM
  4. Restart kernel: Nuclear option when namespace is cluttered

If it's still slow, install system monitor to see what's actually consuming resources.

Q

How do I stop losing hours of work to kernel crashes?

A

I've lost so much work to surprise kernel deaths that I'm basically traumatized. Here's my survival strategy:

Enable autosave (if it's not already on):

  • Settings → Document Manager → Autosave Interval: 120 seconds

Manual save obsessively:

  • Ctrl+S after every meaningful change
  • I literally have muscle memory for this now

Checkpoint critical work:

import joblib
## After expensive computation
joblib.dump(expensive_result, 'checkpoint.pkl')
## Later: expensive_result = joblib.load('checkpoint.pkl')

Wrap risky operations:

try:
    risky_memory_operation()
except MemoryError:
    # Save what you can before it all dies
    joblib.dump(partial_results, 'emergency_save.pkl')
    raise
Q

Can I limit memory so my notebook doesn't kill my laptop?

A

Standard JupyterLab? Nope. You need external help:

Docker approach (recommended):

docker run --memory="6g" -p 8888:8888 jupyter/datascience-notebook
## Container dies, laptop lives

For teams: JupyterHub with resource limits

Linux users: Use cgroups to limit memory, but good luck with that setup nightmare.

Q

When should I abandon pandas and switch to Dask?

A

When you start seeing kernel deaths or your system starts swapping. Rule of thumb: if your dataset is more than 50% of your available RAM, pandas is going to hurt you.

I learned this after spending a weekend trying to optimize pandas code that kept crashing on a 4GB dataset with 8GB of RAM. Switched to Dask and the same operations just worked:

import dask.dataframe as dd
## This doesn't crash
df = dd.read_csv('4gb_file.csv')
result = df.groupby('category').value.mean().compute()

The syntax is almost identical to pandas, but with lazy evaluation. Start with Dask early - converting existing pandas code later is a nightmare.

Q

How do I profile memory usage for specific operations?

A

Use %memit magic command: %memit result = expensive_operation() shows peak memory usage. For line-by-line analysis: %load_ext memory_profiler then %mprun -f function_name function_name(). The Fil profiler provides comprehensive memory allocation tracking without code modification: fil-profile run your_script.py.

Q

What are the best practices for JupyterLab performance?

A

Clear outputs regularly, especially large dataframes and plots.

Use lazy loading: pd.read_parquet() is faster than CSV for repeated access.

Limit dataframe display: pd.set_option('display.max_rows', 50). Use generators for large iterations. Profile before optimizing

  • %time and %timeit identify actual bottlenecks, not perceived ones.
Q

Can I use GPU acceleration to improve performance?

A

Yes, but GPU memory is typically smaller than system RAM.

Use RAPIDS cuDF for GPU-accelerated pandas operations.

Install NVDashboard to monitor GPU usage in JupyterLab. GPU is excellent for compute-heavy operations (ML training) but doesn't solve large dataset loading problems

  • you still need chunking strategies.
Q

How do I optimize JupyterLab startup time?

A

Disable unused extensions: jupyter labextension disable extension-name.

Use minimal environments

  • don't install every package available. The JupyterLab 4.4 improvements reduced startup time significantly. For development, use jupyter lab --dev-mode=False to skip development builds.
Q

What should I do about memory leaks in long-running notebooks?

A

Restart the kernel periodically

  • Python's garbage collector doesn't catch everything.

Clear circular references explicitly: del variable_name.

For interactive widgets, ensure proper cleanup: widget.close(). Use gc.collect() after large operations, though this rarely helps with true memory leaks. Monitor memory growth with %memit over time to identify accumulating usage.

Tools That Actually Prevent Your Notebook From Dying

I've debugged enough 3am kernel crashes to know which tools actually prevent your notebook from eating all your RAM. Here's what works when your data is trying to murder your laptop.

Memory Monitoring and Profiling Tools

Jupyter Resource Usage

Jupyter Resource Usage Extension
Install jupyter-resource-usage first or you're flying blind. Shows real-time memory and CPU in the status bar so you can see death coming before it hits.

pip install jupyter-resource-usage
## Restart JupyterLab to see memory indicator

Memory Profiler for Line-by-Line Analysis
memory_profiler shows exactly which lines consume memory:

%load_ext memory_profiler

@profile
def memory_intensive_function():
    # Line-by-line memory usage will be tracked
    large_array = np.random.random((10000, 10000))
    processed = np.sqrt(large_array)
    return processed.mean()

%mprun -f memory_intensive_function memory_intensive_function()

Fil Profiler for Peak Memory Detection
The Fil profiler identifies peak memory usage without code modification:

pip install filprofiler
fil-profile run your_notebook.py

Fil generates detailed reports showing exactly which bastard line of code ate all your memory. I've used this to catch everything from pandas reading CSV files wrong to matplotlib hoarding memory like a pack rat.

Out-of-Core Computing Libraries

Dask for Familiar Pandas Syntax

Dask Logo

Dask provides pandas-like operations on datasets larger than memory:

import dask.dataframe as dd

## Lazy loading - doesn't read data immediately
df = dd.read_csv('large_dataset.csv')

## Operations are lazy until .compute()
result = df.groupby('category').value.mean().compute()

Dask saved my ass when I was trying to process a 6GB dataset on an 8GB laptop. The parallel processing actually works across cores, chunked operations stay within memory limits, and the Dask dashboard lets you watch it not crash in real-time.

Vaex for Interactive Large Dataset Exploration

Vaex handles billion-row datasets interactively by using memory mapping and lazy evaluation:

import vaex

## Memory-mapped - doesn't load into RAM
df = vaex.open('huge_dataset.hdf5')

## Instant aggregations on billion rows
df.plot('x', 'y')  # Plots without loading data

Polars for Speed
Polars offers pandas-like syntax with significantly better memory efficiency:

import polars as pl

## Lazy evaluation by default
df = pl.scan_csv('large_file.csv')
result = df.filter(pl.col('value') > 100).collect()

Chunking Strategies for Large Datasets

Pandas Chunking
Process large files in manageable pieces:

chunk_size = 10000
results = []

for chunk in pd.read_csv('large_file.csv', chunksize=chunk_size):
    processed_chunk = chunk.groupby('category').sum()
    results.append(processed_chunk)

final_result = pd.concat(results).groupby(level=0).sum()

Database-Style Processing
Use SQL queries to limit data loading:

import sqlite3

## Process data in database, load only results
conn = sqlite3.connect('data.db')
query = """
SELECT category, AVG(value) as avg_value 
FROM large_table 
WHERE date >= '2024-01-01'
GROUP BY category
"""
result = pd.read_sql_query(query, conn)

JupyterLab Configuration Optimization

Memory Settings
Configure JupyterLab for better memory management:

// ~/.jupyter/jupyter_lab_config.py
c.NotebookApp.max_buffer_size = 1024*1024*1024  # 1GB buffer
c.NotebookApp.iopub_data_rate_limit = 1000000000  # Increase output limit

Extension Management
Disable unnecessary extensions that consume memory:

jupyter labextension disable @jupyterlab/extensionmanager
jupyter labextension list  # Check active extensions

Browser Optimization
Chrome/Firefox consume significant memory for JupyterLab:

  • Use Chrome with --max_old_space_size=8192 for more JavaScript heap
  • Firefox with about:config → dom.ipc.processCount → 4 limits processes
  • Consider JupyterLab Desktop for better resource management

Advanced Performance Monitoring

System Monitoring

JupyterLab System Monitor
The jupyterlab-system-monitor extension provides comprehensive system metrics:

pip install jupyterlab-system-monitor
## Shows CPU, memory, and network usage graphs

NVDashboard for GPU Monitoring
For GPU workloads, NVDashboard monitors NVIDIA GPU usage:

pip install jupyterlab-nvdashboard
## Displays GPU memory, utilization, and temperature

Running JupyterLab in Containers (So It Can Die Instead of Your Laptop)

Docker Memory Limits

Docker Logo

Run JupyterLab in Docker so the container gets killed instead of your entire system turning into a brick:

docker run -p 8888:8888 --memory=\"4g\" --cpus=\"2.0\" \
  jupyter/datascience-notebook start-notebook.sh \
  --NotebookApp.token='' --NotebookApp.password=''

Kubernetes Resource Management

Kubernetes

For team deployments, JupyterHub on Kubernetes lets you control exactly how much RAM each user can burn through before getting shut down:

singleuser:
  memory:
    limit: 4G
    guarantee: 1G
  cpu:
    limit: 2
    guarantee: 0.5

Code Optimization Techniques

Efficient Data Types
Use appropriate pandas dtypes to reduce memory:

## Before optimization
df.info(memory_usage='deep')  # Check current memory usage

## Optimize dtypes
df['category'] = df['category'].astype('category')
df['id'] = pd.to_numeric(df['id'], downcast='integer')
df['value'] = pd.to_numeric(df['value'], downcast='float')

Generator Patterns
Replace memory-intensive loops with generators:

## Memory-intensive (loads everything)
results = [process_item(item) for item in large_dataset]

## Memory-efficient (lazy evaluation)
def process_items(dataset):
    for item in dataset:
        yield process_item(item)

results = process_items(large_dataset)

Context Managers for Cleanup
Ensure proper resource cleanup:

from contextlib import contextmanager

@contextmanager
def large_computation():
    temp_arrays = []
    try:
        yield temp_arrays
    finally:
        del temp_arrays
        gc.collect()

with large_computation() as arrays:
    # Large computations here
    pass  # Arrays automatically cleaned up

Performance Benchmarking

Built-in Magic Commands
Use JupyterLab's timing magic for benchmarking:

%time result = expensive_operation()  # Single execution time
%timeit small_operation()             # Average over multiple runs
%prun expensive_function()            # Detailed profiling

Memory Benchmarking
Track memory usage patterns:

import psutil
import os

def memory_usage():
    process = psutil.Process(os.getpid())
    return process.memory_info().rss / 1024 / 1024  # MB

print(f\"Memory before: {memory_usage():.1f} MB\")
result = large_operation()
print(f\"Memory after: {memory_usage():.1f} MB\")

Start with monitoring tools so you can see the crash coming, then pick the right weapons for your specific data size and stupidity level. The goal is to stop losing work to surprise kernel deaths - everything else is just optimization porn.

JupyterLab Performance Solutions Comparison

Approach

Best For

Memory Efficiency

Learning Curve

Performance Gain

Cost/Setup

Standard Pandas

Small datasets (< 1GB)

⭐ (5-10x data size in RAM)

⭐⭐⭐⭐⭐ Easy

⭐⭐⭐ Good for small data

🆓 Free

Pandas Chunking

Medium datasets (1-5GB)

⭐⭐⭐ (Only chunk in memory)

⭐⭐⭐⭐ Moderate

⭐⭐ Slower due to iteration

🆓 Free

Dask DataFrame

Large datasets (5GB+)

⭐⭐⭐⭐ (Lazy evaluation)

⭐⭐⭐ Steeper learning

⭐⭐⭐⭐ Parallel processing

🆓 Free

Vaex

Exploratory analysis on huge datasets

⭐⭐⭐⭐⭐ (Memory mapping)

⭐⭐⭐ Different API

⭐⭐⭐⭐⭐ Interactive billion rows

🆓 Free

Polars

Speed-critical operations

⭐⭐⭐⭐ (Efficient memory use)

⭐⭐⭐ Similar to pandas

⭐⭐⭐⭐⭐ 10-100x faster

🆓 Free

Database Queries

Structured data analysis

⭐⭐⭐⭐⭐ (Server-side processing)

⭐⭐ SQL knowledge needed

⭐⭐⭐⭐ Depends on DB

💰 DB hosting costs

More RAM

Quick fix for small teams

⭐ (Doesn't solve core issue)

⭐⭐⭐⭐⭐ No learning

⭐⭐⭐ Linear scaling only

💰💰 Expensive scaling

Docker Containers

Resource isolation

⭐⭐⭐⭐ (Prevents system crash)

⭐⭐ Container knowledge

⭐⭐⭐ Same performance, safer

🆓 Free (local)

JupyterHub

Team deployment

⭐⭐⭐⭐ (Per-user limits)

⭐ Complex setup

⭐⭐⭐ Multi-user efficiency

💰💰 Infrastructure costs

Cloud Notebooks

Elastic scaling

⭐⭐⭐⭐ (Pay for what you use)

⭐⭐⭐⭐ Vendor-specific

⭐⭐⭐⭐ Auto-scaling

💰💰💰 Usage-based pricing

Essential Performance Optimization Resources

Related Tools & Recommendations

tool
Similar content

pandas Overview: What It Is, Use Cases, & Common Problems

Data manipulation that doesn't make you want to quit programming

pandas
/tool/pandas/overview
100%
tool
Similar content

Debugging AI Coding Assistant Failures: Copilot, Cursor & More

Your AI assistant just crashed VS Code again? Welcome to the club - here's how to actually fix it

GitHub Copilot
/tool/ai-coding-assistants/debugging-production-failures
85%
tool
Similar content

LM Studio Performance: Fix Crashes & Speed Up Local AI

Stop fighting memory crashes and thermal throttling. Here's how to make LM Studio actually work on real hardware.

LM Studio
/tool/lm-studio/performance-optimization
74%
tool
Similar content

Apache NiFi: Visual Data Flow for ETL & API Integrations

Visual data flow tool that lets you move data between systems without writing code. Great for ETL work, API integrations, and those "just move this data from A

Apache NiFi
/tool/apache-nifi/overview
74%
tool
Similar content

Webpack: The Build Tool You'll Love to Hate & Still Use in 2025

Explore Webpack, the JavaScript build tool. Understand its powerful features, module system, and why it remains a core part of modern web development workflows.

Webpack
/tool/webpack/overview
74%
tool
Similar content

React Production Debugging: Fix App Crashes & White Screens

Five ways React apps crash in production that'll make you question your life choices.

React
/tool/react/debugging-production-issues
65%
tool
Similar content

TaxBit Enterprise Production Troubleshooting: Debug & Fix Issues

Real errors, working fixes, and why your monitoring needs to catch these before 3AM calls

TaxBit Enterprise
/tool/taxbit-enterprise/production-troubleshooting
65%
troubleshoot
Similar content

Fix Slow Next.js Build Times: Boost Performance & Productivity

When your 20-minute builds used to take 3 minutes and you're about to lose your mind

Next.js
/troubleshoot/nextjs-slow-build-times/build-performance-optimization
59%
news
Popular choice

The Browser Company Killed Arc in May, Then Sold the Corpse for $610M

Turns out pausing your main product to chase AI trends makes for an expensive acquisition target

Arc Browser
/news/2025-09-05/arc-browser-development-pause
58%
tool
Similar content

Android Studio: Google's Official IDE, Realities & Tips

Current version: Narwhal Feature Drop 2025.1.2 Patch 1 (August 2025) - The only IDE you need for Android development, despite the RAM addiction and occasional s

Android Studio
/tool/android-studio/overview
56%
tool
Similar content

AWS CodeBuild Overview: Managed Builds, Real-World Issues

Finally, a build service that doesn't require you to babysit Jenkins servers

AWS CodeBuild
/tool/aws-codebuild/overview
53%
tool
Similar content

Certbot: Get Free SSL Certificates & Simplify Installation

Learn how Certbot simplifies obtaining and installing free SSL/TLS certificates. This guide covers installation, common issues like renewal failures, and config

Certbot
/tool/certbot/overview
53%
tool
Similar content

Celery: Python Task Queue for Background Jobs & Async Tasks

The one everyone ends up using when Redis queues aren't enough

Celery
/tool/celery/overview
53%
tool
Similar content

PostgreSQL: Why It Excels & Production Troubleshooting Guide

Explore PostgreSQL's advantages over other databases, dive into real-world production horror stories, solutions for common issues, and expert debugging tips.

PostgreSQL
/tool/postgresql/overview
53%
tool
Similar content

Bun Production Optimization: Deploy Fast, Monitor & Fix Issues

Master Bun production deployments. Optimize performance, diagnose and fix common issues like memory leaks and Docker crashes, and implement effective monitoring

Bun
/tool/bun/production-optimization
53%
tool
Similar content

HashiCorp Packer Overview: Automated Machine Image Builder

HashiCorp Packer overview: Learn how this automated tool builds machine images, its production challenges, and key differences from Docker, Ansible, and Chef. C

HashiCorp Packer
/tool/packer/overview
53%
tool
Similar content

Technical Resume Builders: Bypass ATS & Land Tech Jobs

Master technical resume building to beat ATS systems and impress recruiters. Get expert tips, compare top builders, and learn from 200+ applications to secure y

CV Compiler
/tool/technical-resume-builders/overview
53%
tool
Similar content

shadcn/ui Production Troubleshooting: Fix Build & Hydration Errors

Troubleshoot and fix common shadcn/ui production issues. Resolve build failures, hydration errors, component malfunctions, and CLI problems for a smooth deploym

shadcn/ui
/tool/shadcn-ui/production-troubleshooting
53%
tool
Similar content

Git Disaster Recovery & CVE-2025-48384 Security Alert Guide

Learn Git disaster recovery strategies and get immediate action steps for the critical CVE-2025-48384 security alert affecting Linux and macOS users.

Git
/tool/git/disaster-recovery-troubleshooting
53%
tool
Similar content

Fix TaxAct Errors: Login, WebView2, E-file & State Rejection Guide

The 3am tax deadline debugging guide for login crashes, WebView2 errors, and all the shit that goes wrong when you need it to work

TaxAct
/tool/taxact/troubleshooting-guide
53%

Recommendations combine user behavior, content similarity, research intelligence, and SEO optimization