When your build is broken and everyone's breathing down your neck, here's the order that actually saves time:
1. Is It "Works on My Machine" Syndrome?
The most infuriating and common cause of pipeline failures. Your code runs perfectly locally but dies in CI with errors that make no fucking sense.
Quick test: Can you reproduce the failure locally? If not, it's an environment difference, and you're in for a long night.
## Copy the exact environment from CI
docker run -it --rm \
  -e NODE_ENV=production \
  -e DATABASE_URL=postgres://user:pass@db:5432/myapp \
  node:18-alpine \
  sh
Common gotchas I've learned the hard way:
- Case sensitivity: Your MacBook doesn't care about file case, Linux does.
import './Component'works locally but fails in CI when the file iscomponent.tsx - Path separators: Windows uses
\, everything else uses/. Hardcoded paths break across platforms - Environment variables: Your
.envfile works locally but CI doesn't have access to it - Node version drift: You're running Node 18.2.0 locally, CI is using 18.1.0, and that patch version broke something
Last month I spent 4 hours debugging why our tests passed locally but failed in CI with Cannot resolve module '@/components/Button'. Turns out the CI image was missing the TypeScript path mapping configuration. The fix was adding tsconfig.json to our Docker build context.
One line in the Dockerfile. One fucking line. Four hours of my life I'll never get back.
But you know what? Finding that bug felt incredible. Like solving a puzzle that's been taunting you. That moment when the build finally goes green after hours of red failures? Pure dopamine hit. This is why we do this job.
Recent gotcha: Newer Node versions sometimes change how module resolution works. If you're getting ERR_MODULE_NOT_FOUND errors that work fine in older versions, check if your CI is pulling a different Node version than expected:
## Check exactly what Node version CI is using
node --version
npm --version

## If using nvm in CI, pin the version
echo "22.9.0" > .nvmrc
nvm use
2. Check the Obvious Shit First
Has anything changed recently? I know, I know, "nothing changed" - but check anyway:
- Package updates in the last 48 hours
- Environment variable changes
- Infrastructure updates (Node version, base Docker images)
- New team members who might have merged something
## Check recent commits that might be cursed
git log --oneline --since="2 days ago"

## See what packages changed
git diff HEAD~5 package.json
git diff HEAD~5 package-lock.json
Are the dependencies actually installing?
npm installhanging for 30+ minutes usually means network issues or registry problemspip installfailing with SSL errors means your base image is too oldbundle installtiming out means RubyGems is having a bad day
3. Resource Limits: The Silent Killer
Your pipeline was working fine until your codebase grew or your test suite got bigger. Now builds randomly fail with unhelpful error messages.
Memory exhaustion symptoms:
JavaScript heap out of memoryduring webpack buildsKilledwith no other context (Linux OOM killer)- Tests that pass individually but fail when run together
- Docker builds that hang during
npm install
## Check if you're hitting memory limits
docker stats --no-stream

## Increase Node.js heap size for builds
export NODE_OPTIONS="--max-old-space-size=4096"
I learned this the hard way when our webpack build started failing after adding React Query to our app. The build would get to 90% compilation and just... die. Killed. No error message, no stack trace, no helpful context.
Six fucking hours. Six hours of my Saturday debugging this while my family went to the beach without me. Tried different Node versions, cleared all caches, rebuilt the Docker image from scratch. Nothing.
Finally ran docker stats and saw memory usage spike to 2GB and flatline. The CI runner was silently OOM-killing the process. Bumped memory to 4GB in our GitHub Actions config and boom - build worked perfectly.
Sometimes I hate this job. But sometimes it's kind of beautiful how simple the solution is once you find it.
4. Network Connectivity Hell
Your CI environment might not have access to the same resources as your development machine.
Common network failures:
- Corporate firewalls blocking package registries
- DNS resolution issues in containerized environments
- Registry authentication failures
- Proxy configuration problems
## Test network connectivity from your CI environment
curl -I https://registry.npmjs.org/
nslookup github.com
ping google.com
The registry authentication nightmare: Your personal access token works locally but fails in CI because you're using a different account or the token has different permissions.
5. Timing and Race Conditions
Some failures only happen under specific timing conditions that are more likely in CI environments.
Classic race conditions:
- Tests that depend on database seeds not being fully applied
- File system operations that assume synchronous completion
- Network requests without proper timeout handling
- Process startup dependencies that aren't properly awaited
// This works locally but fails in CI
const server = require('./server');
const request = require('supertest');

// Server might not be ready yet
test('should return 200', async () => {
  const response = await request(server).get('/health');
  expect(response.status).toBe(200);
});

// Better: wait for server to be ready
test('should return 200', async () => {
  await server.ready(); // Wait for server startup
  const response = await request(server).get('/health');
  expect(response.status).toBe(200);
});
The Nuclear Debugging Options
When nothing else works and you're getting desperate:
SSH into the CI runner (if possible):
## For self-hosted runners
docker exec -it runner-container bash

## For GitHub Actions with tmate
- name: Debug with tmate
  uses: mxschmitt/action-tmate@v3
Enable verbose logging everywhere:
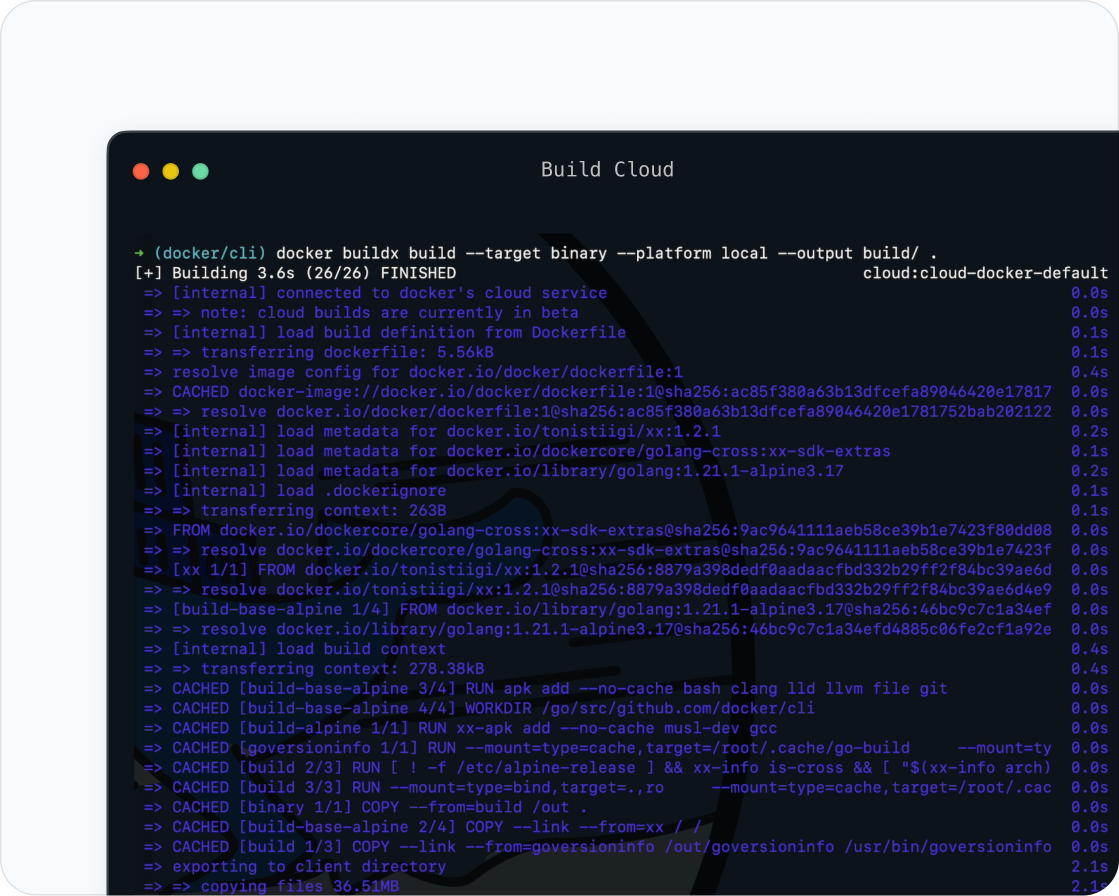
## Docker build debug
DOCKER_BUILDKIT=0 docker build --progress=plain --no-cache .

## npm debug output
npm install --loglevel=verbose

## GitHub Actions debug
export ACTIONS_STEP_DEBUG=true
export ACTIONS_RUNNER_DEBUG=true
Reproduce the exact CI environment locally:
## Pull the exact same Docker image
docker pull node:18-alpine

## Run with the same environment variables
docker run -it --rm \
  -e CI=true \
  -e NODE_ENV=production \
  -v $(pwd):/app \
  -w /app \
  node:18-alpine \
  /bin/sh
6. New 2025 Debugging Scenarios (The Fresh Hell)
GitHub Actions with Apple Silicon Runners: GitHub now offers M1/M2 runners, but Docker builds targeting x86 fail in weird ways:
## This breaks on M1 runners with Docker buildx
- name: Build for production
  run: docker build --platform linux/amd64 .

## This works
- name: Build for production
  run: |
    docker buildx create --use
    docker buildx build --platform linux/amd64 --load -t myapp .
Bun/Deno in CI: New JavaScript runtimes cause compatibility hell. I wasted a perfectly good weekend recently debugging why our Next.js app worked locally but failed CI with import.meta is not defined.
Turned out our CI image had both Node and Bun installed, and some fucking dependency was calling Bun instead of Node to run our build script. Two days of my life debugging a build tool I wasn't even trying to use.
Fixed it by explicitly setting engines.node in package.json and removing Bun from the CI image. But honestly? Bun is pretty sweet when it works. Might try it again when it's more stable.
pnpm Workspace Issues: pnpm is becoming popular, but workspace setups break differently than npm:
## This works locally but fails in CI
pnpm install

## CI needs workspace protocol understanding
pnpm install --frozen-lockfile --prefer-offline
Podman Instead of Docker: Some CI providers switched to Podman. Commands look the same but authentication breaks:
## Docker way
docker login -u $USER -p $PASS registry.com

## Podman way (different auth mechanism)
podman login --username $USER --password $PASS registry.com
The key to not losing your mind is being systematic. Most pipeline failures fall into these categories, and checking them in order saves hours of random debugging.