The Enterprise Observability Maturity Reality Check

AWS Observability Maturity Model

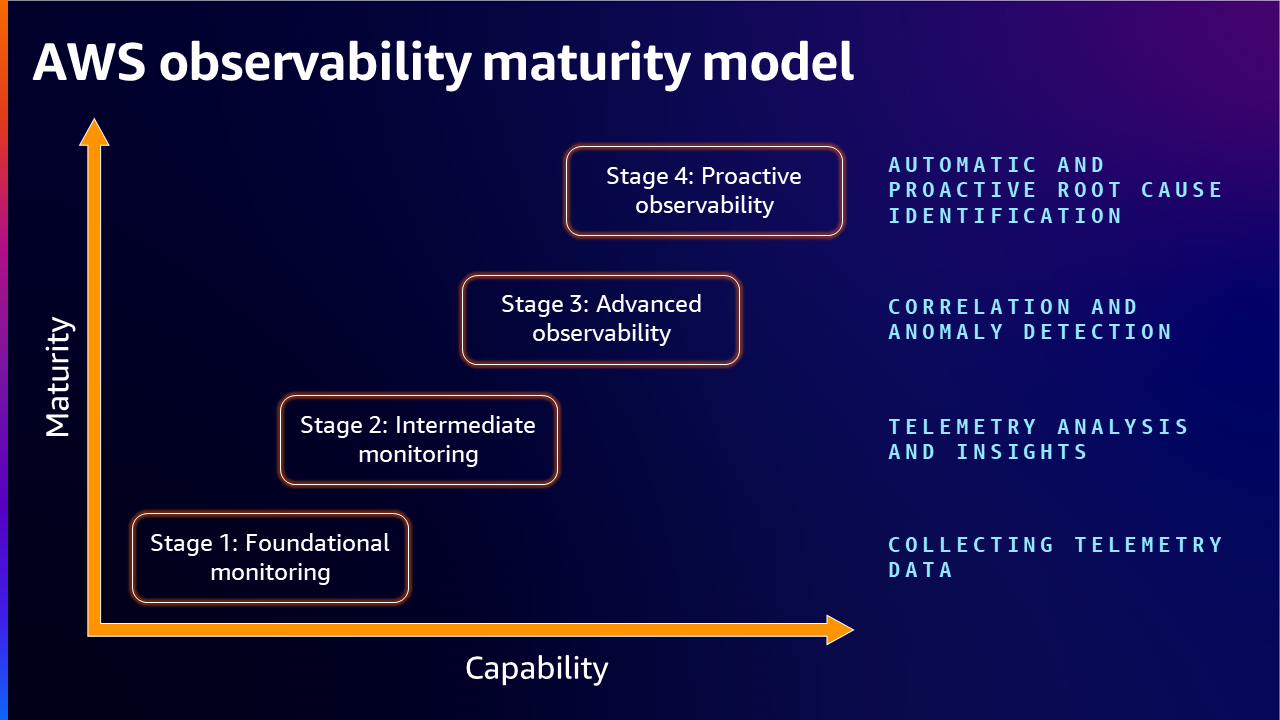
Most organizations are stuck between Stage 2 (Reactive Monitoring) and Stage 3 (Proactive Observability) of the AWS observability maturity model, creating significant enterprise readiness gaps.

Enterprise observability isn't just dashboards that look good in screenshots - here's what I've learned from watching dozens of implementations: most enterprises think they've reached Stage 3 observability maturity when they're actually stuck at Stage 2. This disconnect creates huge blind spots in security, compliance, and operational reliability. I've seen this pattern everywhere, and recent Gartner research confirms what I've been witnessing - companies have no clue where they actually stand.

The Four-Stage Enterprise Maturity Framework

I've used AWS's maturity model and CNCF frameworks to benchmark implementations across dozens of companies. Here's where organizations actually end up:

Stage 1: Tool Chaos (Where Everyone Starts)

  • Multiple monitoring tools that don't talk to each other
  • Alert storms that make engineers ignore everything
  • Reactive fire-fighting instead of actual insight
  • Reality Check: Most smaller companies are here, trying to figure their shit out

Stage 2: Integration Hell (Where Most Get Stuck)

  • Dashboards exist but don't tell you what's actually wrong
  • Alerts provide some context, but engineers still burn hours debugging
  • Leadership thinks you're "enterprise-ready" - spoiler: you're not
  • Reality Check: Most enterprises are trapped here, despite spending millions on fancy platforms

Stage 3: Actually Useful Observability

  • Everything connects - logs, metrics, traces actually correlate properly
  • When something breaks, you know why in minutes instead of hours
  • MTTR drops to something like 15 minutes for most incidents
  • Reality Check: Maybe a quarter of companies reach this level, and it requires serious work

Stage 4: The Holy Grail (Predictive Ops)

  • Problems get fixed before customers notice
  • Systems actually heal themselves (not vendor marketing lies)
  • Engineers build features instead of debugging constantly
  • Reality Check: Almost nobody reaches this - Netflix, Google, and maybe three fintech companies that threw insane money at it

Why Enterprises Get Stuck at Stage 2

1. Compliance Theater vs. Real Governance

Every vendor claims their platform is "enterprise compliance ready" - complete nonsense. SOC 2 Type II certification sounds impressive in vendor presentations until real auditors show up asking for seven years of log retention and your platform dies. NIST Cybersecurity Framework compliance looks great in slides, but try explaining to your CISO why you can't prove who accessed customer data during last week's breach investigation.

Real compliance gaps we see:

  • Audit trail limitations: Many platforms can't track who modified what alert configurations and when
  • Data residency violations: Logs containing PII accidentally stored in wrong geographic regions
  • Access control sprawl: Over-privileged service accounts accessing sensitive telemetry data
  • Retention policy conflicts: Legal teams require 7-year log retention while platforms optimize for 30-day storage

2. Vendor Lock-in Masquerading as Platform Consolidation

The "single pane of glass" promise usually becomes a single point of failure and vendor lock-in nightmare. I've seen too many enterprises regret betting everything on one vendor. OpenTelemetry offers vendor-neutral alternatives, but most enterprises avoid it because it requires real engineering work instead of just signing contracts:

  • Migration complexity: Extracting 3+ years of historical observability data for vendor transitions
  • Feature dependency: Custom dashboards and alerting logic tied to proprietary APIs
  • Cost escalation: Predictable pricing becomes unpredictable as data volumes grow
  • Innovation lag: Waiting 12-18 months for vendors to support new cloud services or frameworks

3. Security Integration Blind Spots

Traditional observability focuses on performance and availability while completely ignoring security context. Every security incident I've investigated could have been caught earlier with proper observability-security integration. Most platforms treat security as an add-on feature, not something built in. Enterprise platforms need:

  • SIEM correlation: Security events correlated with performance anomalies
  • Zero-trust verification: Identity context for every system access request
  • Threat detection: Behavioral analysis across application and infrastructure telemetry
  • Incident response automation: Automated containment based on observability signals

The Hidden Cost of Observability Immaturity

Three Pillars of Observability

Quantifiable Impact Analysis:

FinOps cost optimization research and enterprise cloud spending analysis demonstrate that observability immaturity creates hidden financial impacts beyond incident response delays.

Organizations stuck at Stage 2 get hit with:

  • MTTR that destroys team morale - production incidents take hours to fix when they should take minutes
  • Alert noise that makes you ignore everything - false alarms train engineers to tune out all notifications
  • Infrastructure costs that terrify CFOs - higher expenses from reactive scaling and resource waste
  • Engineering teams debugging instead of building - entire teams waste days per month fighting their tools instead of shipping features

Real Enterprise Example: Financial Services Migration

Saw a major bank discover their platform was completely inadequate during cloud migration. Federal regulators needed detailed reports, PCI compliance requirements were brutal, and their existing observability couldn't handle any of it. Regulatory reporting systems failed, change tracking was non-existent, and disaster recovery testing revealed they were operating blind. The cleanup cost several million dollars and took over a year.

Enterprise-Specific Readiness Criteria

Enterprise Observability Requirements

I've seen enterprise platforms collapse under organizational complexity that goes beyond standard observability capabilities. Here's what actually matters:

1. Organizational Scale Requirements

  • Support for 50,000+ monitored entities across global regions
  • Role-based access control for 500+ engineering team members
  • Multi-tenant isolation for business units with different compliance requirements

2. Governance and Risk Management

  • Automated compliance reporting for SOC 2, FedRAMP, ISO 27001, and industry-specific regulations
  • Change management integration with corporate governance processes
  • Risk scoring and business impact correlation for production incidents

3. Vendor Risk Assessment

  • Financial stability analysis of observability platform vendors
  • Roadmap alignment with enterprise cloud strategy (5+ year horizon)
  • Professional services capacity for enterprise-scale implementations
  • Contractual commitments for SLA, data protection, and service continuity

Here's what actually matters: objectively assess your current maturity stage and identify the specific gaps preventing enterprise-grade observability. Most organizations discover they need fundamental platform architecture changes, not just configuration improvements.

Key Enterprise Assessment Questions:

  • Can you trace a customer complaint back to specific infrastructure events in under 5 minutes?
  • Do your observability access controls actually work with your corporate identity management?
  • Would your current platform survive a 10x increase in telemetry data without collapsing?
  • Can you generate compliance reports automatically or do you still copy-paste data into spreadsheets?

These questions separate companies with actual enterprise observability from those just running fancy dashboards. Understanding your current state is only half the problem. The real challenge is figuring out which platforms can handle enterprise requirements when everything goes wrong.

Time to cut through vendor marketing and examine how major observability platforms actually perform under enterprise pressure.

Enterprise Readiness Scorecard: Major Observability Platforms

Enterprise Criteria

Datadog

Dynatrace

New Relic

Elastic Observability

Splunk

🔒 Security Compliance

⭐⭐⭐⭐⭐

⭐⭐⭐⭐⭐

⭐⭐⭐⭐

⭐⭐⭐

⭐⭐⭐⭐⭐

SOC 2 Type II

Certified 2025

Certified

Certified

✅ Certified

✅ Certified

ISO 27001

ISO 27001:2022

ISO 27001:2013

✅ Certified

✅ Certified

✅ Certified

FedRAMP Authorization

🟡 Moderate "In Process"

❌ Not Available

Moderate ATO

❌ Not Available

✅ Moderate

HIPAA Compliance

✅ BAA Available

✅ Available

✅ Available

✅ Available

✅ Available

🏛️ Governance & Risk

⭐⭐⭐⭐

⭐⭐⭐⭐⭐

⭐⭐⭐

⭐⭐⭐

⭐⭐⭐⭐

Enterprise SSO/SAML

✅ Full Support

✅ Full Support

✅ Full Support

✅ Full Support

✅ Full Support

RBAC Granularity

✅ Team/Service Level

✅ Fine-grained

✅ Basic Roles

✅ Custom Policies

✅ Advanced

Audit Trail Completeness

✅ Config + Access

✅ Comprehensive

✅ Basic Logging

✅ Query + Config

✅ Comprehensive

Data Residency Control

Multi-region

✅ Regional Control

✅ Regional Options

✅ Self-managed

✅ On-prem Available

📈 Enterprise Scale

⭐⭐⭐⭐

⭐⭐⭐⭐⭐

⭐⭐⭐⭐

⭐⭐⭐⭐⭐

⭐⭐⭐⭐⭐

Maximum Hosts/Containers

500K+ instances

25K+ per environment

100K+ hosts

Unlimited (self-managed)

1M+ entities

Petabyte-Scale Logs

✅ Supported

✅ Supported

✅ Supported

✅ Native Capability

✅ Native Capability

Global Load Distribution

✅ CDN + Edge

✅ Smart Routing

✅ Multi-region

✅ Cluster Federation

✅ Distributed Search

API Rate Limits

6,000/hour standard

Enterprise negotiated

3,600/hour

Self-managed unlimited

Enterprise tiers

💰 Enterprise Pricing

⭐⭐

⭐⭐

⭐⭐⭐

⭐⭐⭐⭐

⭐⭐

Price Predictability

🟡 Usage-based spikes

🟡 Complex licensing

✅ Consumption model

✅ Transparent tiers

🟡 Enterprise negotiated

Volume Discounts

✅ Available

✅ Available

✅ Available

✅ Available

✅ Available

Multi-year Commitments

✅ 20-30% discounts

✅ Custom terms

✅ Flexible terms

✅ Standard discounts

✅ Enterprise rates

🔧 Vendor Stability

⭐⭐⭐⭐⭐

⭐⭐⭐⭐

⭐⭐⭐⭐

⭐⭐⭐

⭐⭐⭐⭐

Market Cap/Revenue

~$45B (Public)

~€1.2B (Public)

~$900M (Public)

~$8B (Elastic N.V.)

~$23B (Public)

Years in Market

14 years

20+ years

17 years

13 years (as Elastic)

22+ years

Enterprise Customer Base

29,000+ customers

3,000+ enterprises

18,000+ customers

18,000+ customers

90,000+ customers

Professional Services

✅ Global presence

✅ Extensive network

✅ Available

✅ Partner network

✅ Comprehensive

The Hidden Enterprise Implementation Realities

Observability Implementation Challenges

Enterprise observability implementations face predictable failure patterns that vendors rarely discuss during sales cycles.

After watching dozens of enterprise observability implementations, I keep seeing the same patterns - what actually breaks when you deploy to real environments. Marketing promises of "easy integration" and "out-of-the-box enterprise readiness" crash into operational reality. Every implementation I've seen takes at least 6 months longer than vendors estimate. Budget-wise? Plan for around 3x their initial quotes - I've never seen one come in under budget.

The Three Enterprise Implementation Failure Modes

1. The Compliance Surprise (Most Failures Start Here)

Enterprise compliance isn't just about checking certification boxes—it's about operational compliance that works under pressure.

Real Failure Example: Healthcare System Migration

Healthcare company implemented Datadog across multiple hospitals. Worked fine during testing, completely failed during their first compliance audit. Patient data was leaking through logs in plaintext, access controls broke down during emergency situations, and retention policies prioritized cost savings over compliance requirements. The cleanup cost hundreds of thousands and took nearly a year to fix.

The Pattern: Platforms work perfectly in vendor demos with sanitized test data, but become compliance disasters when real incidents happen at 2AM. Emergency access procedures break audit trails, data volumes spike beyond planning estimates, and cross-team coordination falls apart under pressure.

The Scale Reality Gap (When Demos Meet Reality)

Vendor POCs are basically fantasy demos with unicorn data that bears no resemblance to your production nightmare. Here's what actually happens when you deploy to enterprise reality:

Real Failure Example: Financial Services Platform

Major bank implemented Dynatrace and discovered production was a mess. DEBUG logging was enabled everywhere - generating massive amounts of data nobody anticipated. Every microservice used customer IDs as metric tags, which destroyed platform performance. Multi-region deployments broke dashboard functionality, and legacy systems proved impossible to monitor effectively.

The Hidden Scaling Challenge: Most enterprises have architectural nightmares combining modern cloud services with legacy mainframes, custom protocols, and vendor-specific monitoring systems. Platform consolidation means handling edge cases that never appear in standard vendor demos.

What this looked like at 9:30 AM EST (market open):

  • Dashboard failures: Dynatrace UI throwing 504 errors when traders needed real-time data
  • Alert storm: Something like 15,000 alerts in 10 minutes because every customer transaction generated "high cardinality detected" warnings
  • Budget disaster: Monthly costs jumped from around $80K (POC estimate) to over $340K because nobody understood cardinality pricing
  • System failure: Production went down for 2 hours while we figured out why connection timeout errors were flooding our logs

The Organizational Readiness Crisis (People Problems Kill Projects)

Technology readiness doesn't guarantee organizational readiness. Enterprise observability requires coordinated changes across multiple teams, processes, and existing tooling. I've learned this the hard way - technical success means nothing if your organization isn't ready for the change.

Real Failure Example: Retail Technology Transformation

Major retailer attempted to implement New Relic across their entire technology stack and hit organizational problems:

Skills Gap Reality:

  • Platform expertise shortage: Only 2 engineers out of 150 had prior experience with comprehensive observability platforms
  • Alert fatigue multiplication: Consolidating 8 monitoring tools into one platform initially increased alert volume by 400%
  • Workflow disruption: Existing incident response procedures became obsolete, requiring 6 months to rebuild operational muscle memory

Process Integration Failures:

  • Change management conflicts: Observability configurations weren't integrated with existing change control processes
  • Security team resistance: InfoSec team blocked several integrations due to concerns about data exposure and access control
  • Budget ownership disputes: Different teams couldn't agree on cost allocation for shared observability infrastructure.

Enterprise-Specific Success Patterns

Prometheus Architecture

I've seen maybe half a dozen implementations actually succeed, and they all followed specific patterns that vendors never discuss in their implementation guides:

1. Executive Sponsorship with Technical Understanding

Successful implementations had C-level sponsors who understood both business impact and technical complexity. Failed implementations had either pure business sponsors (who underestimated technical challenges) or pure technical sponsors (who couldn't navigate organizational politics).

2. Dedicated Observability Center of Excellence

Organizations that established dedicated observability teams (5-8 people minimum) succeeded more consistently than those trying to distribute responsibilities across existing teams.

Core responsibilities:

  • Platform architecture and standards governance
  • Cross-team integration planning and execution
  • Training and enablement for application teams
  • Compliance and security policy enforcement
  • Cost optimization and vendor relationship management

3. Phased Implementation with Business Value Validation

Successful enterprises used phased rollouts tied to measurable business outcomes:

Phase 1 (Months 1-6): Critical production systems only

  • Success criteria: Reduce MTTR for production incidents by 30%
  • Business validation: Quantified cost savings from faster incident resolution

Phase 2 (Months 7-12): Development and staging environments

  • Success criteria: Improve developer productivity metrics
  • Business validation: Faster feature delivery and reduced debugging time

Phase 3 (Months 13-18): Full enterprise deployment

  • Success criteria: Achieve target observability maturity level
  • Business validation: Comprehensive ROI analysis including avoided costs

The Vendor Partnership Reality

Enterprise implementations require true partnerships, not just customer-vendor relationships.

What Actually Matters in Vendor Selection:

Professional Services Quality (Not Just Availability)

  • Dedicated enterprise architects who understand your industry
  • Proven track record with similar organizational scale and complexity
  • Commitment to multi-month engagements (not just initial setup)

Roadmap Alignment Assessment

  • Vendor product roadmap must align with your 3-5 year enterprise strategy
  • Open APIs and data portability to avoid future vendor lock-in scenarios
  • Commitment to supporting hybrid and legacy system integration

Financial Stability Analysis

  • Vendor acquisition risk assessment (especially for VC-backed platforms)
  • Customer references from similar enterprise implementations
  • Contractual commitments for service continuity and data access

Enterprise Implementation Risk Mitigation

Technical Risk Mitigation:

  • Parallel deployment strategy: Run new observability platform alongside existing tools for 6+ months
  • Data validation protocols: Implement automated testing to verify observability data accuracy and completeness
  • Rollback procedures: Plan for rapid rollback to previous monitoring systems if new platform fails

Organizational Risk Mitigation:

  • Cross-training requirements: Minimum 20% of engineering team must achieve platform proficiency
  • Documentation standards: Comprehensive runbooks for common scenarios and edge cases
  • Change management integration: Observability changes must follow existing enterprise change control processes

Financial Risk Mitigation:

  • Usage monitoring and controls: Implement automated cost monitoring to prevent budget surprises
  • Contract flexibility: Negotiate pricing adjustments for significant architecture or usage pattern changes
  • Multi-vendor strategy: Maintain relationships with alternative vendors to avoid single-vendor dependency

The Enterprise Observability Maturity Timeline Reality

Enterprise Implementation Timeline

Realistic Enterprise Timeline Expectations:

Months 1-6: Foundation Establishment

  • Platform deployment and basic instrumentation
  • Core team training and initial policy development
  • Reality check: Expect 2-3x longer than vendor estimates

Months 7-18: Operational Integration

  • Advanced feature deployment and workflow integration
  • Organization-wide training and adoption
  • Reality check: This phase determines long-term success or failure

Months 19-36: Maturity Achievement

  • Advanced analytics, automation, and optimization
  • Full enterprise observability maturity (Stage 3+)
  • Reality check: Most organizations plateau at Stage 2 without dedicated ongoing investment

Bottom line: Observability isn't a software installation project. This is a 2-3 year organizational commitment requiring dedicated engineers, substantial budget, and executives who understand that "just make it work" isn't a strategy. Companies that succeed plan for 24+ months and commit real resources. Everyone else ends up with expensive dashboards that fail during production emergencies.

Lesson learned: When your observability platform starts throwing connection errors during incidents, you'll wish you'd planned better. Every engineer who's lived through platform failures during critical incidents has bookmarked troubleshooting resources for these scenarios.

Key Enterprise Implementation Questions:

  • Do you have dedicated budget for 24+ months of professional services?
  • Can you commit 5-8 FTEs to observability platform management and governance?
  • Are you prepared to modify existing operational procedures to align with new observability workflows?
  • Do you have executive sponsorship that understands both technical and organizational change requirements?

These questions reveal the difference between successful enterprise observability transformation and expensive technology deployments that fail to deliver business value.

Implementation realities separate the prepared from the unprepared, but even organizations that nail the technical deployment often struggle with the day-to-day operational questions that determine long-term success. The questions that keep CTOs and CFOs awake at night require honest, experience-based answers.

Enterprise Observability Platform FAQ: The Questions CFOs and CTOs Actually Ask

Q

What should we actually budget for enterprise observability implementation?

A

Plan for 3-4x whatever the vendor quoted, or prepare for uncomfortable budget conversations. Here's the breakdown that sales reps don't mention (learned this when our $500K quote somehow became over $2M):

  • Platform costs: Maybe 25-30% of what you'll actually spend (the pretty number vendors quote)
  • Professional services: 30-40% (implementation, training, all the shit they don't include)
  • Internal resources: 25-35% (dedicated team, training, opportunity cost of not shipping features)
  • Infrastructure and integration: 10-15% (surprise! you need more compute, storage, networking)

Real example: That $500K annual platform license? You'll likely spend closer to $2M once everything's included.

Q

How do we avoid the "Datadog bill shock" that everyone warns about?

A

Set up cost controls before deployment, not after you're shocked by a $50K monthly bill. I've helped teams cut their Datadog costs in half by implementing smarter data ingestion strategies. Essential controls:

  • Data sampling: Don't log everything - sample intelligently to reduce costs by 40-60%
  • Retention tiers: Hot data (few days), warm data (couple months), cold storage (long term)
  • Alert limits: Cap alert volume so incidents don't spike your usage costs
  • Team budgets: Give teams spending limits so they think before they log

Set up cost alerts at around 80% of budget. Saw one team cut their monthly bill in half just by optimizing their data strategy.

Q

Is vendor lock-in a real concern or just theoretical?

A

Vendor lock-in is operationally real, not just contractually real. Try explaining to your CEO why switching vendors will cost $2M and take 18 months. The biggest lock-in factors that will create problems:

  • Custom dashboards: 200+ custom visualizations become platform-specific assets
  • Alert configurations: Complex alerting logic tied to platform-specific APIs
  • Historical data: 2-3 years of observability data locked in proprietary formats
  • Team expertise: Engineers develop platform-specific skills that don't transfer

Mitigation strategy: Use OpenTelemetry for data collection, maintain data export procedures, and require APIs for all configurations.

Q

How do we handle PHI/PCI/PII data in observability logs?

A

Assume your logs contain sensitive data, because they do. Developers will log sensitive information despite training and reminders. Saw a healthcare company discover thousands of patient records scattered through their logs during an audit. Protection strategy:

  • Data scrubbing at source: Fix apps to redact sensitive data before logging
  • Field-level encryption: Encrypt log fields that might contain PII/PHI
  • Access controls: Not everyone needs access to everything
  • Automated scanning: Tools that catch violations before auditors do

That healthcare organization discovered patient data throughout their log systems. The cleanup process took several months.

Q

What compliance certifications actually matter for enterprise procurement?

A

Focus on operational compliance, not just certification theater.

Must-have certifications:

  • SOC 2 Type II: Operational controls, not just policy documentation
  • ISO 27001: Information security management systems
  • Industry-specific: FedRAMP (government), HIPAA (healthcare), PCI DSS (finance)

What matters more than certifications:

  • Audit trail completeness: Can you prove who accessed what data when?
  • Data residency control: Can you guarantee data never leaves specified geographic regions?
  • Incident response integration: Does the platform integrate with your existing security incident response?
Q

How do we handle data sovereignty across global operations?

A

Plan for data locality requirements from day one. Key considerations:

  • Regional data centers: Choose platforms with data centers in your required regions
  • Data residency policies: Implement technical controls, not just contractual commitments
  • Cross-border data flows: Understand GDPR, data localization laws, and industry regulations
  • Compliance by region: Different regions may require different retention and access policies

Self-managed platforms (like Elastic) provide maximum control but require operational expertise.

Q

Can observability platforms actually handle our legacy systems?

A

Modern platforms handle 70-80% of enterprise systems out of the box. The remaining 20% requires custom work. Found this out when our AS/400 mainframe from 1987 threw MSGID: CPF2105 errors that no observability platform on earth knows how to parse.

Typically supported:

  • Modern cloud applications with standard instrumentation
  • Popular databases, message queues, and infrastructure components
  • Standard network protocols and log formats

Requires custom integration:

  • Mainframe systems and proprietary protocols
  • Custom applications without modern telemetry support
  • Legacy network devices and industrial control systems
  • Third-party software without observability APIs

Integration planning: Inventory all systems first. Budget extra for custom integration work.

Q

How do we integrate with existing ITSM/incident management?

A

Integration quality varies significantly between platforms. Evaluate:

ServiceNow integration: Datadog and Dynatrace have native integrations, others require custom work
PagerDuty integration: Most platforms support basic alerting, but context correlation varies
Slack/Teams integration: Essential for modern incident response workflows
Custom ITSM tools: Require API development and ongoing maintenance

Success pattern: Start with basic alerting integration, then gradually add context and automation.

Q

What's the real timeline for full enterprise deployment?

A

18-24 months if you want something that works during middle-of-the-night emergencies, not the 90-day timeline vendors promise. Any sales engineer who promises 90 days either hasn't deployed this at enterprise scale or isn't being honest about the complexity.

What actually happens:

  • Months 1-6: Platform setup, basic monitoring, fighting with legacy systems
  • Months 7-12: Advanced features, training people, integrating with existing workflows
  • Months 13-18: Full deployment, optimization, actually achieving maturity
  • Months 19-24: AI features, automation, making it not suck

What adds time: Legacy system integration (add 3-6 months), organizational change management (add 2-4 months), unexpected compliance requirements (add 2-3 months).

Q

How many people do we need dedicated to observability?

A

Plan for 1 observability engineer per 50-75 application developers. Typical enterprise team structure:

Core observability team (5-8 people):

  • Platform architect (1 person): Overall technical strategy and vendor relationships
  • Platform engineers (2-3 people): Configuration, integration, and maintenance
  • Data engineers (1-2 people): Data pipeline optimization and cost management
  • Training coordinators (1 person): Documentation and team enablement

Distributed responsibilities:

  • Application teams: Instrumentation and basic monitoring
  • SRE teams: Advanced analytics and incident response
  • Security teams: Compliance and access control
Q

Should we hire observability experts or train existing teams?

A

Hybrid approach works best. Successful enterprises:

  • Hire 2-3 observability platform experts for core team leadership and architecture
  • Train existing engineers on platform-specific skills and best practices
  • Partner with vendors for specialized knowledge transfer and ongoing support

Training investment: Plan for several thousand dollars per engineer for comprehensive platform training.

Q

How do we avoid alert fatigue in large organizations?

A

Alert discipline becomes critical at enterprise scale. Effective strategies:

Alert hierarchy:

  • P1 alerts: Customer-impacting issues requiring immediate response
  • P2 alerts: Degraded performance requiring investigation within business hours
  • P3 alerts: Informational trends for proactive optimization

Alert ownership: Every alert must have a designated team and escalation procedure
Alert review process: Monthly review to eliminate false positives and tune thresholds
Automated remediation: Automate responses to common alert scenarios

Success metric: Aim for <5 alerts per week per engineering team, with >90% actionable alert rate.

Q

How do we measure ROI for observability investment?

A

Track metrics that drive business decisions, not vanity metrics that look good in presentations.

Hard ROI measurements:

  • MTTR reduction: Faster incident resolution directly reduces revenue impact
  • Infrastructure optimization: Right-sizing resources based on actual usage patterns
  • Developer productivity: Reduced debugging time enables more feature development
  • Prevented outages: Proactive issue detection avoids customer-facing problems

Soft benefits measurement:

  • Team satisfaction: Reduced on-call stress and improved work-life balance
  • Compliance efficiency: Automated reporting reduces manual audit preparation
  • Business intelligence: Observability data informs product and infrastructure decisions

ROI example: One enterprise calculated millions in annual benefits from faster incident response and developer productivity improvements. The ROI was significant, but took 18 months to achieve.

Q

What's the difference between monitoring and observability for enterprise buyers?

A

Monitoring tells you "the database has problems." Observability tells you "the database is struggling because deployment #1247 introduced a connection pool leak in the user service, and here's the exact code causing it."

Traditional monitoring: CPU hits 90%, send alert, wake up engineer, spend 2 hours troubleshooting
Enterprise observability: Service response time degraded 15% → correlated to deployment at 14:32 → traced to specific database query → here's the commit that caused it

Business reality: Monitoring equals reactive troubleshooting. Observability means understanding why systems fail so you can prevent future problems.

Bottom line: If you can't trace a customer complaint to specific infrastructure events in under 5 minutes, you're still doing monitoring, not observability.

Enterprise Observability Resources: Due Diligence and Implementation

Related Tools & Recommendations

integration
Recommended

OpenTelemetry + Jaeger + Grafana on Kubernetes - The Stack That Actually Works

Stop flying blind in production microservices

OpenTelemetry
/integration/opentelemetry-jaeger-grafana-kubernetes/complete-observability-stack
100%
howto
Recommended

Set Up Microservices Monitoring That Actually Works

Stop flying blind - get real visibility into what's breaking your distributed services

Prometheus
/howto/setup-microservices-observability-prometheus-jaeger-grafana/complete-observability-setup
62%
tool
Similar content

OpenTelemetry Overview: Observability Without Vendor Lock-in

Because debugging production issues with console.log and prayer isn't sustainable

OpenTelemetry
/tool/opentelemetry/overview
58%
alternatives
Similar content

Best OpenTelemetry Alternatives & Migration Ready Tools

I spent last Sunday fixing our collector again. It ate 6GB of RAM and crashed during the fucking football game. Here's what actually works instead.

OpenTelemetry
/alternatives/opentelemetry/migration-ready-alternatives
57%
integration
Recommended

Setting Up Prometheus Monitoring That Won't Make You Hate Your Job

How to Connect Prometheus, Grafana, and Alertmanager Without Losing Your Sanity

Prometheus
/integration/prometheus-grafana-alertmanager/complete-monitoring-integration
54%
integration
Recommended

Stop Finding Out About Production Issues From Twitter

Hook Sentry, Slack, and PagerDuty together so you get woken up for shit that actually matters

Sentry
/integration/sentry-slack-pagerduty/incident-response-automation
46%
integration
Similar content

Kafka, MongoDB, K8s, Prometheus: Event-Driven Observability

When your event-driven services die and you're staring at green dashboards while everything burns, you need real observability - not the vendor promises that go

Apache Kafka
/integration/kafka-mongodb-kubernetes-prometheus-event-driven/complete-observability-architecture
45%
tool
Similar content

Datadog Enterprise Deployment Guide: Control Costs & Sanity

Real deployment strategies from engineers who've survived $100k+ monthly Datadog bills

Datadog
/tool/datadog/enterprise-deployment-guide
44%
tool
Similar content

Datadog Cost Management Guide: Optimize & Reduce Your Monitoring Bill

Master Datadog costs with our guide. Understand pricing, billing, and implement proven strategies to optimize spending, prevent bill spikes, and manage your mon

Datadog
/tool/datadog/cost-management-guide
44%
tool
Similar content

Datadog Monitoring: Features, Cost & Why It Works for Teams

Finally, one dashboard instead of juggling 5 different monitoring tools when everything's on fire

Datadog
/tool/datadog/overview
41%
pricing
Similar content

Datadog, New Relic, Sentry Enterprise Pricing & Hidden Costs

Observability pricing is a shitshow. Here's what it actually costs.

Datadog
/pricing/datadog-newrelic-sentry-enterprise/enterprise-pricing-comparison
39%
troubleshoot
Recommended

Docker Desktop Won't Install? Welcome to Hell

When the "simple" installer turns your weekend into a debugging nightmare

Docker Desktop
/troubleshoot/docker-cve-2025-9074/installation-startup-failures
37%
howto
Recommended

Complete Guide to Setting Up Microservices with Docker and Kubernetes (2025)

Split Your Monolith Into Services That Will Break in New and Exciting Ways

Docker
/howto/setup-microservices-docker-kubernetes/complete-setup-guide
37%
troubleshoot
Recommended

Fix Docker Daemon Connection Failures

When Docker decides to fuck you over at 2 AM

Docker Engine
/troubleshoot/docker-error-during-connect-daemon-not-running/daemon-connection-failures
37%
tool
Similar content

Elastic Observability: Reliable Monitoring for Production Systems

The stack that doesn't shit the bed when you need it most

Elastic Observability
/tool/elastic-observability/overview
36%
pricing
Recommended

AWS vs Azure vs GCP Developer Tools - What They Actually Cost (Not Marketing Bullshit)

Cloud pricing is designed to confuse you. Here's what these platforms really cost when your boss sees the bill.

AWS Developer Tools
/pricing/aws-azure-gcp-developer-tools/total-cost-analysis
32%
troubleshoot
Recommended

Fix Kubernetes ImagePullBackOff Error - The Complete Battle-Tested Guide

From "Pod stuck in ImagePullBackOff" to "Problem solved in 90 seconds"

Kubernetes
/troubleshoot/kubernetes-imagepullbackoff/comprehensive-troubleshooting-guide
31%
howto
Recommended

Lock Down Your K8s Cluster Before It Costs You $50k

Stop getting paged at 3am because someone turned your cluster into a bitcoin miner

Kubernetes
/howto/setup-kubernetes-production-security/hardening-production-clusters
31%
tool
Recommended

AWS API Gateway - The API Service That Actually Works

integrates with AWS API Gateway

AWS API Gateway
/tool/aws-api-gateway/overview
31%
news
Recommended

Perplexity AI Got Caught Red-Handed Stealing Japanese News Content

Nikkei and Asahi want $30M after catching Perplexity bypassing their paywalls and robots.txt files like common pirates

Technology News Aggregation
/news/2025-08-26/perplexity-ai-copyright-lawsuit
31%

Recommendations combine user behavior, content similarity, research intelligence, and SEO optimization