Why Admission Controllers Fail and Ruin Your Day

Today is Thursday, August 28, 2025. Let me tell you about admission controllers - the security gatekeepers that will absolutely ruin your deployment plans when they break. I've spent way too many 3am debugging sessions figuring out why perfectly good containers suddenly can't deploy.

The Real Problem Nobody Talks About

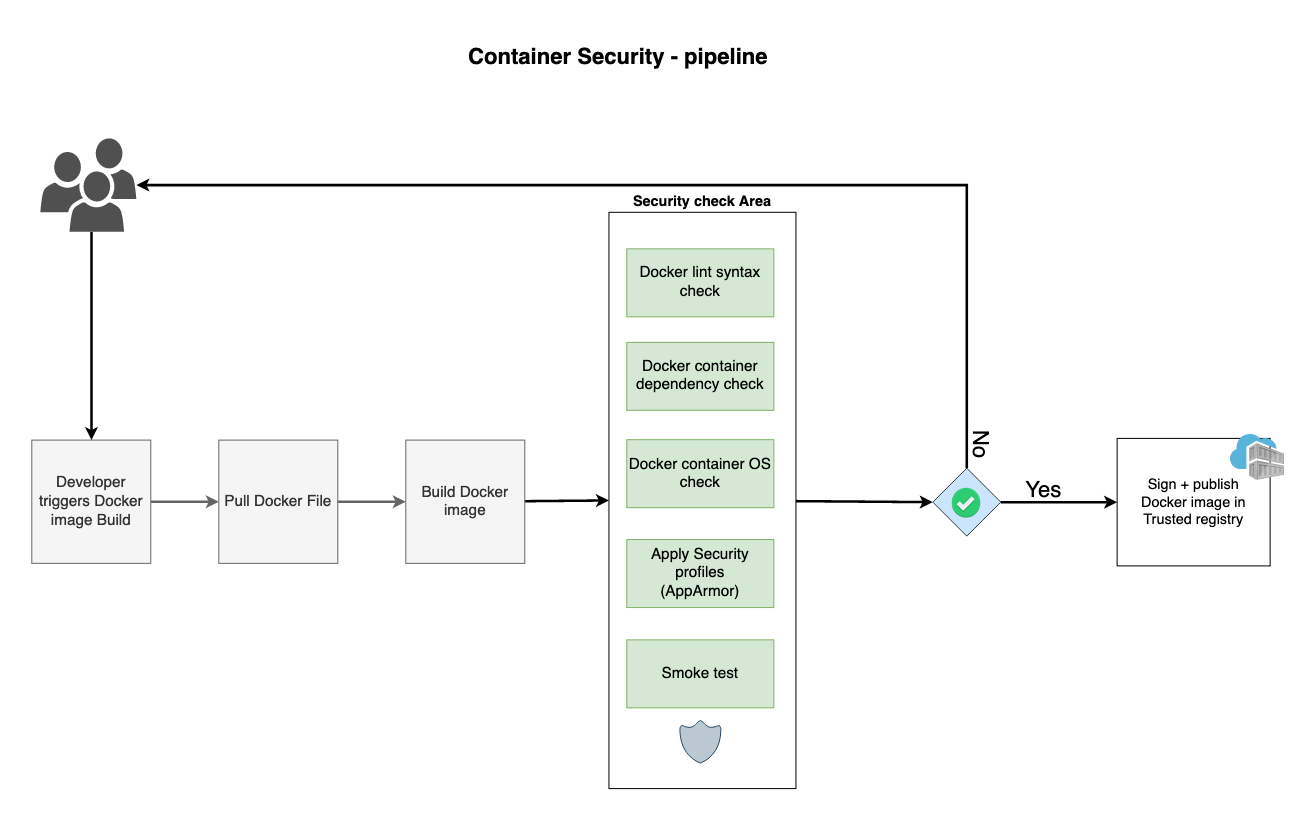
Here's what actually happens when you deploy a container in a cluster with admission controllers: your pod hits the API server, which then calls out to a webhook that's supposed to scan your image for vulnerabilities. Sounds simple, right? Wrong.

Kubernetes Admission Controller Flow

Container Security Workflow

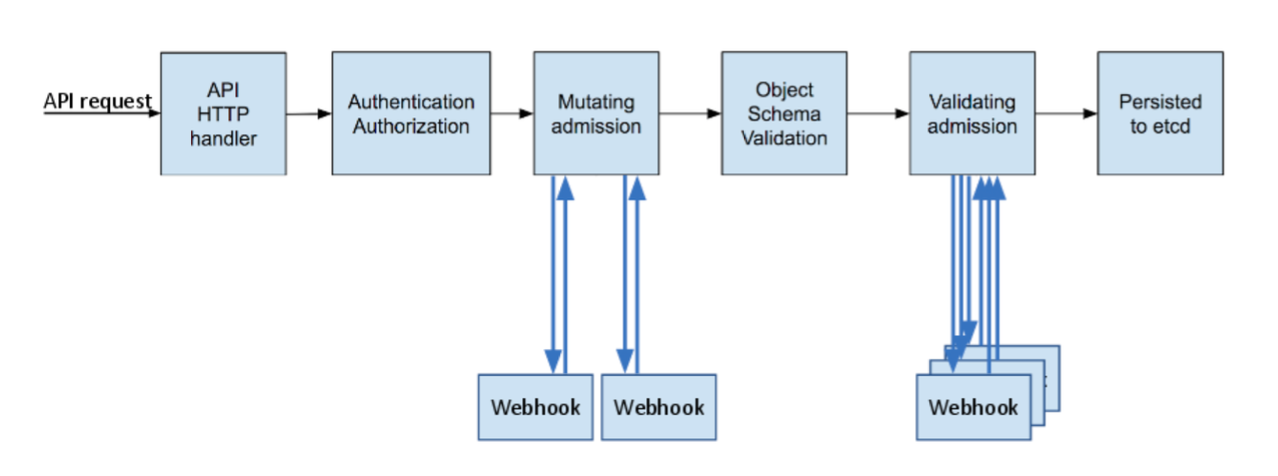
The admission controller has 10 seconds (default timeout) to:

  1. Download your potentially massive container image
  2. Run a full vulnerability scan against multiple CVE databases using tools like Trivy or Snyk
  3. Apply whatever insane security policies your security team dreamed up
  4. Return a decision

This is like asking someone to perform brain surgery during a commercial break. It's not happening.

What Actually Goes Wrong (From Personal Experience)

The "admission webhook denied the request" Nightmare

This error message is about as helpful as a screen door on a submarine. I've seen this break deployments for hours because:

  • Your vulnerability scanner (Trivy, Aqua, Snyk) went down (happens more than vendors admit)

Trivy Scanner

  • The webhook timed out because someone deployed a 2GB enterprise image with 50,000 packages
  • Network policies blocked the admission controller from talking to the scanner API
  • Two different security tools disagreed about whether the same CVE is critical or medium (check the NIST NVD for reference)

Webhook Timeouts That Will Drive You Insane

Kubernetes defaults to a 10-second timeout for webhooks. Meanwhile, scanning a typical enterprise Java application takes 45 seconds minimum according to container scanning benchmarks. The math doesn't work. When it times out, some admission controllers fail "open" (let everything through - great security!), others fail "closed" (block everything - great for your weekend plans). This is controlled by the failurePolicy setting.

I learned this the hard way when our Node.js images suddenly started taking 60 seconds to scan after a dependency update added 200 new packages. Guess what happened at deployment time?

Multiple Security Tools Playing King of the Hill

Your security team probably deployed Falco, OPA Gatekeeper, Kyverno, and three different vendor tools all doing admission control.

Snyk Container Security

They'll conflict with each other in creative ways:

  • Tool A says the image is fine
  • Tool B says it's got critical vulns
  • Tool C crashes trying to scan it
  • Your deployment fails with a generic "webhook failed" message

Good luck figuring out which one is lying.

The CI/CD Death Spiral

When admission controllers fail, they don't fail gracefully. They fail spectacularly and take your entire deployment pipeline with them.

Real Production Horror Story

I watched a team lose an entire Friday because their GitLab CI/CD pipeline started failing every deployment with Kubernetes executor issues.

Kubernetes Deployment Pipeline

The error? "admission webhook denied the request". No details. No logs. Just pain.

Turned out their vulnerability scanner had been down for 6 hours, but the admission controller was configured to fail closed. Every single deployment - dev, staging, prod - blocked. The security team was unreachable (of course), and nobody knew the emergency override procedure.

The Disable-Everything Panic Response

When deployments are failing and the CEO is breathing down your neck, teams start disabling admission controllers to "get deployments flowing again". Now you've got vulnerable containers running in production because your security automation became the problem instead of the solution.

Root Cause: Everyone's Lying to You

The dirty secret nobody mentions: the entire architecture is fundamentally broken.

Synchronous Design, Asynchronous Reality

Admission controllers expect instant responses. Vulnerability scanning is inherently slow - you're analyzing thousands of packages against constantly-updating CVE databases that can be hundreds of GB in size. It's like trying to fit an elephant through a keyhole.

Network Dependencies Are a Single Point of Failure

Your admission webhook needs to call out to external services over the network. Corporate firewalls block it. Proxy configurations break it. The scanning service goes down and takes your deployments with it.

Scanner APIs Are Unreliable

Every vulnerability scanner has different APIs (Trivy's API, Snyk's API, Grype's API), different authentication, different response formats, and different ideas about what constitutes a security vulnerability. Trying to make them all work together is like herding cats that are on fire.

The only way to fix this mess is to stop trying to do real-time vulnerability scanning at deployment time. But first, you need to survive the next outage.

How to Actually Fix This Shit When It Breaks

Emergency Triage: Find Out What's Broken

Step 1: Figure Out Which Admission Controller is Screwing You

When you see "admission webhook denied the request", your first job is figuring out which of the 47 different admission controllers your security team installed is the culprit.

## See all the admission webhooks that could be failing
kubectl get validatingadmissionwebhooks
kubectl get mutatingadmissionwebhooks

## Get more details about webhook configuration
kubectl describe validatingadmissionwebhooks

## Check recent failures - this will usually tell you which one is broken
kubectl get events --all-namespaces --field-selector reason=FailedAdmissionReview

## Check if the admission controller pod itself is even running
kubectl get pods -n security-system -l app=admission-controller

Pro tip: The error message will sometimes include the webhook name, but don't count on it. Half the time you'll get a generic "webhook failed" message that tells you nothing useful. Check the Kubernetes troubleshooting guide for more debugging techniques.

Step 2: Check If The Thing is Actually Working

Now verify the admission controller isn't completely fucked:

## Check the webhook timeout (spoiler: it's probably 10 seconds and that's your problem)
## See https://kubernetes.io/docs/reference/access-authn-authz/extensible-admission-controllers/#timeouts
kubectl get validatingadmissionwebhook <webhook-name> -o yaml | grep timeoutSeconds

## Test if you can actually reach the webhook endpoint (replace with your actual service)
kubectl exec -it <admission-controller-pod> -- curl -v https://<webhook-service>:443/validate

## Look at the logs to see what's actually failing
kubectl logs -n security-system deployment/admission-controller --tail=100 -f

If the curl fails, congrats - you've got network issues. If the logs are full of timeout errors, you've got performance issues. If there are no logs at all, the thing is probably dead.

Fix Timeout Hell

Just Increase the Damn Timeout

The default 10-second timeout is a joke. Enterprise images take 30-60 seconds to scan according to container scanning performance studies. Here's how to fix it:

## Patch the webhook config to give it more time
apiVersion: admissionregistration.k8s.io/v1
kind: ValidatingAdmissionWebhook
metadata:
  name: security-scanner-webhook
webhooks:
- name: image-security.example.com
  timeoutSeconds: 60  # Give it a minute instead of 10 seconds
  failurePolicy: Ignore  # Let stuff through when it fails

You can set failurePolicy to:

  • Fail: Block everything when scanning fails (security paranoia mode)
  • Ignore: Let deployments through when scanning fails (actually useful during outages)

Read more about failurePolicy options.

Stop Doing Real-Time Scanning (The Nuclear Option)

Real-time vulnerability scanning at deployment time is fundamentally broken. The NIST container security guide recommends shift-left scanning. Here's a better approach:

Docker Security Scanning Process

Container Security Integration

  1. Scan images when they're pushed to your registry
  2. Store the results in Redis or a database like PostgreSQL
  3. Have admission controllers just check the cached results
## Example cached results lookup instead of real-time scanning
apiVersion: v1
kind: ConfigMap
metadata:
  name: scan-cache-config
data:
  cache-ttl: "86400"  # Cache results for 24 hours
  fallback-mode: "allow"  # What to do when cache is empty

This drops admission latency from 45 seconds to under 100ms. Revolutionary, I know. Similar pattern described in Google's Binary Authorization docs.

Handle Multiple Security Tools Fighting Each Other

The Problem: Tool Wars

Your security team deployed Falco, OPA Gatekeeper, Kyverno, Aqua, Snyk, and three other tools, all doing admission control. They disagree about everything:

  • Trivy: "This image has critical vulnerabilities!"
  • Snyk: "This image is totally fine."
  • Admission controller: catches fire

Solution: Pick One Tool and Stick With It

Use something like Kyverno to aggregate all the different scanner results with sane logic:

apiVersion: kyverno.io/v1
kind: ClusterPolicy
metadata:
  name: stop-the-tool-wars
spec:
  validationFailureAction: enforce
  rules:
  - name: unified-security-check
    match:
      any:
      - resources:
          kinds: ["Pod"]
    validate:
      message: "Image failed security checks (check annotations for details)"
      anyPattern:
      # Allow if ANY scanner says it's OK (because they're all lying anyway)
      - metadata:
          annotations:
            "scanner.security/trivy": "PASSED"
      - metadata:
          annotations:
            "scanner.security/snyk": "PASSED"

Debug Mode When Everything's on Fire

Test your policies without breaking production:

## Test a deployment without actually deploying it (dry-run documentation)
## https://kubernetes.io/docs/reference/generated/kubectl/kubectl-commands#apply
kubectl apply --dry-run=server -f your-broken-deployment.yaml

## Turn on debug logging to see what the hell is happening
kubectl patch deployment admission-controller -n security-system \
  -p '{"spec":{"template":{"spec":{"containers":[{"name":"controller","env":[{"name":"LOG_LEVEL","value":"debug"}]}]}}}}'

Fix Network Issues (Because Your Corporate Network Hates You)

Corporate Proxy Hell

Your corporate proxy is blocking the admission controller from talking to the vulnerability scanner API. I learned this one the hard way when our admission controller worked perfectly in dev but died spectacularly in production - turns out our corporate firewall was silently dropping all outbound HTTPS traffic from the security namespace. Took 4 hours and three different network teams to figure out why Trivy could scan local images but not reach the CVE database.

Corporate proxy configuration is a common issue. Here's how to fix it:

apiVersion: apps/v1
kind: Deployment
metadata:
  name: admission-controller
spec:
  template:
    spec:
      containers:
      - name: controller
        env:
        - name: HTTPS_PROXY
          value: "proxy.corporate-hell.com:8080"
        - name: NO_PROXY
          value: "127.0.0.1,localhost,*.cluster.local"

Make Scanning Services Less Shitty

Run multiple scanner instances so when one dies, you're not totally fucked. Follow high availability patterns for critical services:

apiVersion: apps/v1
kind: Deployment
metadata:
  name: trivy-scanner
spec:
  replicas: 3  # Run 3 instances because redundancy
  selector:
    matchLabels:
      app: trivy-scanner
  template:
    spec:
      containers:
      - name: trivy
        image: aquasec/trivy:latest
        resources:
          limits:
            memory: "4Gi"  # Give it enough memory to not crash
            cpu: "2"

Emergency Procedures (When Everything's on Fire)

The Nuclear Option: Disable Everything

When you need to deploy NOW and security can go cry about it later. Emergency procedures should follow incident response best practices:

## Make the webhook fail open instead of closed
kubectl patch validatingadmissionwebhook security-scanner \
  --type='merge' -p='{"webhooks":[{"name":"scanner","failurePolicy":"Ignore"}]}'

## Create an emergency namespace that bypasses all security
kubectl create namespace emergency-prod
kubectl label namespace emergency-prod security.bypass/emergency=true

Cover Your Ass with Audit Logs

When you bypass security, make sure you document it so you don't get fired:

## Export all admission controller decisions for the last 24 hours
## Events documentation: https://kubernetes.io/docs/reference/kubernetes-api/cluster-resources/event-v1/
kubectl get events --all-namespaces --field-selector reason=AdmissionWebhook \
  -o custom-columns=TIME:.firstTimestamp,NAMESPACE:.involvedObject.namespace,POD:.involvedObject.name,MESSAGE:.message \
  --sort-by=.firstTimestamp > admission-bypass-$(date +%Y%m%d).log

## Save admission controller logs as evidence
kubectl logs -n security-system deployment/admission-controller --since=24h > admission-controller-failure-$(date +%Y%m%d).log

Test That You Actually Fixed It

Before you declare victory, make sure shit actually works:

## Deploy a test pod to make sure admission control is working
kubectl run test-pod --image=nginx:1.20 --restart=Never

## Check that it actually got scanned and approved
kubectl describe pod test-pod | grep -A5 -B5 "admission"

If the test pod deploys without errors and you can see security annotations on it, congratulations - you might have actually fixed something.

Frequently Asked Questions

Q

My deployment worked yesterday, now it's failing with "admission webhook denied the request" - what the hell?

A

This is the most frustrating error message in Kubernetes.

It tells you absolutely nothing useful. The admission webhook is probably timing out trying to scan your image, or the vulnerability scanner went down (again).First thing to check: kubectl logs -n security-system deployment/admission-controller --tail=50.

Look for timeout errors or connection failures. If you see "context deadline exceeded", your webhook timeout is too short. Most are set to 10 seconds, which is a joke for scanning enterprise images.Quick fix: `kubectl get validatingadmissionwebhook -o yaml | grep timeout

Seconds`

  • if it's 10, change it to 60.
Q

How do I figure out WHICH admission controller is screwing me over?

A

kubectl get validatingadmissionwebhooks shows you all the webhooks that could be failing. Then run kubectl get events --all-namespaces --field-selector reason=FailedAdmissionReview to see recent failures.The error message sometimes includes the webhook name, but don't count on it. Half the time you get "webhook failed" with zero context. If that happens, check logs for each admission controller pod until you find the one that's actually broken.

Q

Why does my image scan take 45 seconds but the webhook times out in 10?

A

Because whoever configured your admission controller didn't think about real-world image sizes. Enterprise Java images with 50,000+ packages need time to scan. The default 10-second timeout was designed by someone who's never scanned an actual production container.Fix it: patch the webhook config with timeoutSeconds: 60 or just implement cached scanning so you're not doing real-time analysis during deployment.

Q

Trivy says my image is critical, Snyk says it's fine - now what?

A

Welcome to vulnerability scanner hell. Different scanners use different CVE databases, update at different times, and have different opinions about severity. It's like asking three doctors to diagnose the same symptom

  • you'll get three different answers.Pick one scanner as the source of truth, or implement logic that requires consensus. Don't try to make them all agree
  • you'll go insane.
Q

I need to deploy NOW and admission control is blocking everything. Emergency override?

A

kubectl patch validatingadmissionwebhook <name> --type='merge' -p='{"webhooks":[{"name":"<webhook-name>","failurePolicy":"Ignore"}]}'This makes the webhook fail open instead of closed. Your security team will hate you, but your deployment will work. Don't forget to change it back and document what you did so you don't get fired.

Q

My vulnerability scanner crashed and now ALL deployments are blocked. How do I not get fired?

A

Scale up your scanner service: kubectl scale deployment trivy-scanner --replicas=3If that doesn't work, temporarily disable the admission controller: kubectl patch validatingadmissionwebhook security-scanner --type='merge' -p='{"webhooks":[{"name":"scanner","failurePolicy":"Ignore"}]}'Then fix the scanner and re-enable blocking mode. Always have backup scanner instances running.

Q

"failed to call webhook" - is this a network issue?

A

Yeah, probably.

The API server can't reach your admission webhook service. Check:

  • Is the webhook pod running? kubectl get pods -n security-system
  • Can you reach the service? kubectl get endpoints <service-name>
  • Is your corporate firewall blocking internal cluster traffic? (Classic enterprise move)
Q

Works in dev, fails in prod - why does this always happen?

A

Production has different network policies, resource limits, proxy configs, and probably half the RAM your admission controller needs.Check resource usage: kubectl top pods -n security-system. If your admission controller is OOMing or CPU throttled, give it more resources. Production images are also usually bigger and take longer to scan.

Q

I have 5 different admission controllers and they're fighting each other

A

This is why we can't have nice things. Your security team deployed Falco, OPA, Kyverno, Aqua, and three other tools without coordinating.Use kubectl apply --dry-run=server to test which policies are conflicting. Better yet, consolidate everything into one policy engine like Kyverno. Multiple admission controllers are a recipe for disaster.

Q

Sometimes it fails, sometimes it works - what's causing the intermittent failures?

A

Resource contention. During busy periods, your vulnerability scanner gets overwhelmed and starts timing out. Your CI/CD pipeline probably doesn't have retry logic, so one timeout kills the deployment.Scale up your scanners, implement caching, and add exponential backoff retries to your deployment pipeline. Intermittent failures are usually capacity problems.

Q

My vulnerability database is 3 days old and blocking deployments

A

Set up monitoring for database staleness and automated updates. Most scanners need daily CVE database updates to stay current.For emergencies, you can temporarily allow deployments with stale databases, but make sure your security team knows and fix the update process ASAP.

Q

Same image, different registry, different admission results?

A

Some admission controllers have registry-specific configs or authentication issues. Check if your webhook is configured to scan images from all registries consistently, not just your internal one.Also verify that the admission controller can actually reach and authenticate with all your registries. Network policies love to break this.

Q

How do I stop false positives from blocking legitimate deployments?

A

Maintain a suppression list of known false positives and integrate it into your admission policies. Some scanners let you ignore specific CVEs or packages that you've manually reviewed.For critical deployments, implement multi-scanner validation where multiple tools need to agree before blocking.

Q

I want to monitor this mess - what metrics should I track?

A
  • Admission webhook response times (P95/P99)
  • Timeout rates and failure counts
  • Scanner service availability and queue depth
  • How often you're bypassing security (this should be near zero)Set up Prometheus metrics and alert when timeout rates spike or scanners go down. You want to know about problems before deployments start failing.
Q

Air-gapped environment - how do I handle vulnerability scanning?

A

Set up local vulnerability database mirrors and sync them regularly from internet-connected systems. Configure your admission controllers to use internal scanner services only.Pre-scan images before they enter the air-gapped environment, or implement periodic scanning with manual review processes for new vulnerabilities.

How to Not Get Burned by This Again

Cache Your Scans or Watch Everything Die

Stop doing vulnerability scanning at deploy time. It's fucking stupid. By the time you're trying to deploy, you should already know if an image is clean or not.

Container Security Pipeline

Here's what I learned after dealing with this shit for 3 years: scan images when they get pushed to your registry, cache the results in Redis, and have your admission controller just check the cache. Simple concept, but it'll save you from 90% of timeout hell.

## This actually works - I've used it in prod for 2 years
apiVersion: v1
kind: ConfigMap
metadata:
  name: scan-results-cache
data:
  cache-ttl: \"86400\"  # 24 hours is usually enough
  fallback-mode: \"allow\"  # Don't break everything when cache is empty
  max-age-seconds: \"604800\"  # Reject images older than a week

Went from 45-second deployment times to under 2 seconds. Night and day difference. Your developers will stop hating you.

Run Multiple Scanner Instances (Because Shit Dies)

Single points of failure are death in production. I learned this when our one Trivy instance crashed and blocked deployments for 6 hours. Now I run 3 instances minimum:

Trivy Logo

apiVersion: apps/v1
kind: Deployment
metadata:
  name: vulnerability-scanner
spec:
  replicas: 3  # Never run just one
  selector:
    matchLabels:
      app: vuln-scanner
  template:
    spec:
      containers:
      - name: trivy
        image: aquasec/trivy:latest
        resources:
          requests:
            memory: \"2Gi\"  # Trivy needs memory
            cpu: \"1000m\"
          limits:
            memory: \"4Gi\"  # Don't let it eat everything
            cpu: \"2000m\"
        livenessProbe:
          httpGet:
            path: /healthz
            port: 8080
          periodSeconds: 30
        readinessProbe:
          httpGet:
            path: /ready
            port: 8080
          periodSeconds: 10

Also, put them in different availability zones if your cloud provider doesn't suck. When AWS has another "isolated incident" in us-east-1, you'll still be able to deploy.

Stop the Vendor Tool Wars

Your security team bought every vulnerability scanner on the market. Trivy says the image is fine, Snyk screams bloody murder, and Aqua thinks it's moderately concerning. Meanwhile, your admission controller has no idea who to believe.

Pick ONE scanner as the source of truth and make everything else advisory. Here's a Kyverno policy that actually works:

Kyverno Logo

apiVersion: kyverno.io/v1
kind: ClusterPolicy
metadata:
  name: single-source-of-truth
spec:
  validationFailureAction: enforce
  rules:
  - name: trust-trivy-only
    match:
      any:
      - resources:
          kinds: [\"Pod\"]
    validate:
      message: \"Trivy scan required (other scanners are just noise)\"
      pattern:
        metadata:
          annotations:
            \"trivy.security/status\": \"PASSED\"

Or if you want to be fancy and require consensus from multiple scanners (masochistic but comprehensive):

## This requires 2 out of 3 scanners to agree
validate:
  message: \"At least 2 scanners must approve this image\"
  anyPattern:
  - metadata:
      annotations:
        \"trivy.security/status\": \"PASSED\"
        \"snyk.security/status\": \"PASSED\"
  - metadata:
      annotations:
        \"trivy.security/status\": \"PASSED\"
        \"aqua.security/status\": \"PASSED\"
  - metadata:
      annotations:
        \"snyk.security/status\": \"PASSED\"
        \"aqua.security/status\": \"PASSED\"

Monitor the Right Shit

Don't monitor every possible metric. Focus on the ones that'll wake you up at 3am:

Webhook Response Time: If P95 latency goes over 30 seconds, you're about to have a bad time. I learned this when our webhook latency slowly crept from 8 seconds to 35 seconds over two weeks - nobody noticed until deployments started timing out during our Black Friday prep. Set up alerts in Prometheus and Grafana with thresholds that actually matter.

Scanner Uptime: Track how often your vulnerability scanners are actually working. Anything below 99% and you'll start seeing deployment failures.

Policy Violation Rate: If suddenly 50% of deployments are getting blocked, either your developers are doing something stupid or your scanner broke.

## Example Prometheus monitoring config
apiVersion: monitoring.coreos.com/v1
kind: ServiceMonitor
metadata:
  name: admission-controller-metrics
spec:
  selector:
    matchLabels:
      app: admission-controller
  endpoints:
  - port: metrics
    interval: 30s
    path: /metrics

Build Escape Hatches

Sometimes you need to deploy something RIGHT NOW and security can file a complaint later. Build emergency procedures before you need them.

Emergency Namespace: Create a namespace that bypasses all security scanning. Use it sparingly or your security team will murder you:

## Create the emergency namespace
kubectl create namespace emergency-deploy

## Label it to bypass admission control
kubectl label namespace emergency-deploy \
  admission.security/bypass=true \
  emergency.security/approved-by=\"$(whoami)\" \
  emergency.security/created-at=\"$(date -Iseconds)\"

Fail-Open Mode: Configure your admission controllers to allow deployments when scanning fails completely. Your security team will hate this, but your uptime will thank you:

## Switch webhook to fail-open during incidents
kubectl patch validatingadmissionwebhook security-scanner \
  --type='merge' -p='{
    \"webhooks\": [{
      \"name\": \"scanner\",
      \"failurePolicy\": \"Ignore\"
    }]
  }'

Document Everything: When you use the escape hatches, document why. Generate audit reports so you can prove you weren't just being reckless:

## Export admission decisions from the last 24 hours
kubectl get events --all-namespaces \
  --field-selector reason=AdmissionReview \
  -o custom-columns=TIME:.firstTimestamp,NAMESPACE:.involvedObject.namespace,POD:.involvedObject.name,DECISION:.message \
  --sort-by=.firstTimestamp > emergency-bypass-$(date +%Y%m%d).log

Resource Requirements (The Real Numbers)

Forget what the vendors tell you. Here's what actually running these scanners in production requires:

Trivy needs serious memory: 4-8GB per instance minimum. Java applications with massive dependency trees? Give it 12GB or watch it OOM kill itself. I learned this when our Spring Boot apps kept timing out.

CPU isn't usually the bottleneck: 2 cores per scanner is plenty unless you're scanning enormous images. Network I/O to download CVE databases is usually what kills performance.

Storage grows like cancer: CVE databases are huge and getting bigger. Plan for 200GB minimum, and they update daily. Set up S3 bucket mirroring if you're in an air-gapped environment.

## Real resource limits that actually work
resources:
  requests:
    memory: \"4Gi\"
    cpu: \"1000m\" 
    ephemeral-storage: \"10Gi\"
  limits:
    memory: \"8Gi\"
    cpu: \"2000m\"
    ephemeral-storage: \"20Gi\"

The key to preventing these failures is accepting that shit will break. Build systems that degrade gracefully instead of falling over completely. Cache aggressively, run redundant services, and always have an escape hatch for emergencies.

Start with caching your scan results - that alone will fix 80% of your timeout issues. Then add redundancy for your scanners. The fancy policy consolidation can wait until you're not getting paged at 3am.

Essential Documentation and Resources

Related Tools & Recommendations

integration
Similar content

Jenkins Docker Kubernetes CI/CD: Deploy Without Breaking Production

The Real Guide to CI/CD That Actually Works

Jenkins
/integration/jenkins-docker-kubernetes/enterprise-ci-cd-pipeline
100%
troubleshoot
Similar content

Trivy Scanning Failures - Common Problems and Solutions

Fix timeout errors, memory crashes, and database download failures that break your security scans

Trivy
/troubleshoot/trivy-scanning-failures-fix/common-scanning-failures
69%
troubleshoot
Similar content

Fix Snyk Authentication Registry Errors: Deployment Nightmares Solved

When Snyk can't connect to your registry and everything goes to hell

Snyk
/troubleshoot/snyk-container-scan-errors/authentication-registry-errors
63%
troubleshoot
Similar content

Fix Kubernetes Service Not Accessible: Stop 503 Errors

Your pods show "Running" but users get connection refused? Welcome to Kubernetes networking hell.

Kubernetes
/troubleshoot/kubernetes-service-not-accessible/service-connectivity-troubleshooting
58%
compare
Recommended

Twistlock vs Aqua Security vs Snyk Container - Which One Won't Bankrupt You?

We tested all three platforms in production so you don't have to suffer through the sales demos

Twistlock
/compare/twistlock/aqua-security/snyk-container/comprehensive-comparison
58%
tool
Recommended

Google Kubernetes Engine (GKE) - Google's Managed Kubernetes (That Actually Works Most of the Time)

Google runs your Kubernetes clusters so you don't wake up to etcd corruption at 3am. Costs way more than DIY but beats losing your weekend to cluster disasters.

Google Kubernetes Engine (GKE)
/tool/google-kubernetes-engine/overview
52%
tool
Similar content

Aqua Security - Container Security That Actually Works

Been scanning containers since Docker was scary, now covers all your cloud stuff without breaking CI/CD

Aqua Security Platform
/tool/aqua-security/overview
48%
tool
Recommended

GitHub Actions Security Hardening - Prevent Supply Chain Attacks

integrates with GitHub Actions

GitHub Actions
/tool/github-actions/security-hardening
44%
alternatives
Recommended

Tired of GitHub Actions Eating Your Budget? Here's Where Teams Are Actually Going

integrates with GitHub Actions

GitHub Actions
/alternatives/github-actions/migration-ready-alternatives
44%
tool
Recommended

GitHub Actions - CI/CD That Actually Lives Inside GitHub

integrates with GitHub Actions

GitHub Actions
/tool/github-actions/overview
44%
tool
Recommended

Jenkins - The CI/CD Server That Won't Die

compatible with Jenkins

Jenkins
/tool/jenkins/overview
39%
tool
Recommended

Jenkins Production Deployment - From Dev to Bulletproof

compatible with Jenkins

Jenkins
/tool/jenkins/production-deployment
39%
troubleshoot
Similar content

Fix Docker Daemon Not Running on Linux: Troubleshooting Guide

Your containers are useless without a running daemon. Here's how to fix the most common startup failures.

Docker Engine
/troubleshoot/docker-daemon-not-running-linux/daemon-startup-failures
36%
tool
Recommended

Snyk Container - Because Finding CVEs After Deployment Sucks

Container security that doesn't make you want to quit your job. Scans your Docker images for the million ways they can get you pwned.

Snyk Container
/tool/snyk-container/overview
36%
tool
Recommended

GitLab CI/CD - The Platform That Does Everything (Usually)

CI/CD, security scanning, and project management in one place - when it works, it's great

GitLab CI/CD
/tool/gitlab-ci-cd/overview
31%
tool
Recommended

Azure DevOps Services - Microsoft's Answer to GitHub

integrates with Azure DevOps Services

Azure DevOps Services
/tool/azure-devops-services/overview
26%
troubleshoot
Recommended

Docker Won't Start on Windows 11? Here's How to Fix That Garbage

Stop the whale logo from spinning forever and actually get Docker working

Docker Desktop
/troubleshoot/docker-daemon-not-running-windows-11/daemon-startup-issues
26%
howto
Recommended

Stop Docker from Killing Your Containers at Random (Exit Code 137 Is Not Your Friend)

Three weeks into a project and Docker Desktop suddenly decides your container needs 16GB of RAM to run a basic Node.js app

Docker Desktop
/howto/setup-docker-development-environment/complete-development-setup
26%
news
Recommended

Docker Desktop's Stupidly Simple Container Escape Just Owned Everyone

integrates with Technology News Aggregation

Technology News Aggregation
/news/2025-08-26/docker-cve-security
26%
tool
Recommended

Aqua Security Production Troubleshooting - When Things Break at 3AM

Real fixes for the shit that goes wrong when Aqua Security decides to ruin your weekend

Aqua Security Platform
/tool/aqua-security/production-troubleshooting
24%

Recommendations combine user behavior, content similarity, research intelligence, and SEO optimization