I'll be honest - these are the only Ultimate features that actually justify the subscription cost. The database tools and profiler aren't some half-ass plugins. They're the full DataGrip experience built into IntelliJ, which means I don't have to alt-tab between three different applications fifty times a day.
Database Tools That Don't Constantly Break
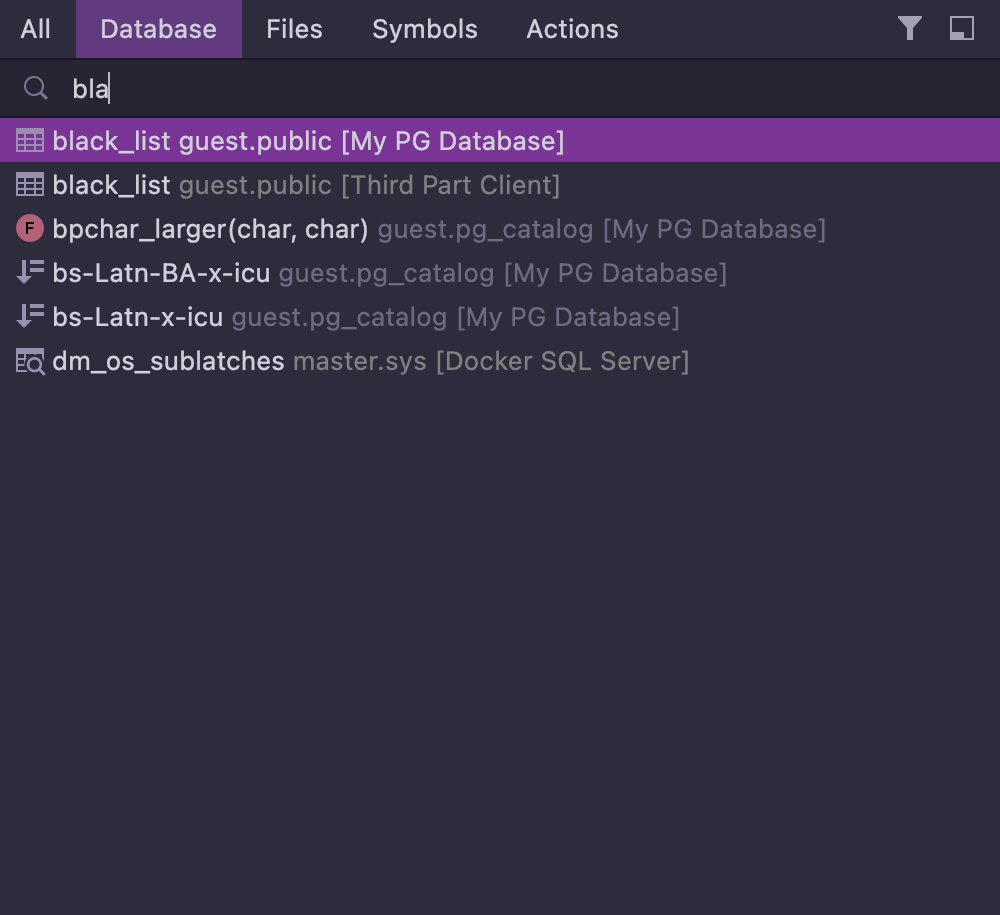
Remember those VS Code database extensions? The ones that break every time you update Node? Yeah, Ultimate's database tools are nothing like that. They actually work and stay working. I can connect to PostgreSQL, MySQL, Redis, MongoDB - pretty much anything you throw at it.
The 2025.2 update finally fixed the most annoying thing: you can edit data from SELECT statements with JOINs. Before, you'd run a query, see the problem, then manually write UPDATE statements. Now you just fix the data inline. Small thing, but saves me probably an hour a week.
The stuff that actually works:
Schema browsing - click through tables and relationships without writing DESCRIBE statements. SQL completion knows your actual table names and column types (finally). Query plans show why your JOIN is taking 30 seconds - usually missing indexes, obviously.
Data export to CSV, JSON, whatever doesn't crash on large datasets. Schema diffs compare dev vs prod schemas so you can see what broke in production before the 3am emergency call.
Profiler That Actually Helps Debug Performance Issues
The profiler uses Java Flight Recorder under the hood, so it's legit. When my Spring Boot app started eating 6GB of heap after a dependency upgrade, the profiler showed exactly which Jackson deserializer was creating million-object arrays. Took 20 minutes instead of the usual 4-hour debug session with print statements.
Real debugging scenarios where this saved me:
- Found a service holding references to 50,000 cached objects (took down prod for 2 hours)
- Discovered some dipshit regex that was taking 2 seconds per validation
- Saw which database connection pool was exhausted during a traffic spike
- Found Spring beans taking 30+ seconds to initialize (thanks, @ComponentScan on the entire classpath)
The profiler works great when it doesn't crash on startup. Pro tip: if it hangs loading, kill the java process and restart - happens about once a week on complex heap dumps. Still better than setting up JProfiler for the third time this month.
Why I Keep Paying $599/Year for This
Look, I was spending 2 hours a day switching between IntelliJ, DataGrip, and whatever profiling tool didn't crash. Ultimate puts everything in one window. When I need to debug a slow query, I can look at the execution plan, check the JPA mapping, and profile the service method without opening three different apps.
The unified distribution means my whole team uses the same setup. No more "works on my machine" bullshit because Dave is using DBeaver while everyone else uses DataGrip. Everyone gets the same database tools, same profiler configuration, same everything.