The Most Common Ways KrakenD Breaks (And How to Fix Them)

KrakenD Production Troubleshooting

After dealing with production KrakenD deployments for years, these are the problems that wake you up at 3am. Most of them have simple fixes once you know what to look for.

Memory Leaks and OOM Kills

Symptom: KrakenD containers randomly restart, kubectl logs shows exit code 137, Kubernetes keeps killing your pods.

KrakenD Memory Usage Monitoring

This usually hits when you're handling concurrent requests without proper resource limits. KrakenD spawns goroutines like crazy during traffic spikes, and if you don't configure memory limits correctly, Kubernetes will murder your pods. Check the Kubernetes deployment guide and Docker deployment best practices for proper resource configuration.

The fix that actually works:

resources:
  limits:
    memory: "1Gi"
    cpu: "1000m"
  requests:
    memory: "512Mi"
    cpu: "100m"

Set explicit memory limits in your Kubernetes deployment. Don't trust the defaults. I've seen teams lose entire weekends because they skipped this basic step. Also check your circuit breaker configuration - aggressive timeouts can cause request pileups. For monitoring, set up Prometheus metrics and Grafana dashboards to catch these issues early.

Configuration Validation Hell

Symptom: KrakenD starts but endpoints return 404s, config changes don't take effect, mysterious routing issues.

The number one cause: your JSON config has subtle syntax errors that don't break startup but break routing. KrakenD's error messages for config issues are... not great. You'll spend hours debugging what should be a 30-second fix. Use the configuration check command and configuration audit tool to catch these before deployment.

Check this first:

## Always validate before deploying
krakend check --config krakend.json

Common gotchas:

  • Missing http:// in backend URLs (this one cost me 2 hours last month)
  • Trailing slashes in endpoint paths - /api/users/ vs /api/users are different endpoints
  • Wrong url_pattern vs endpoint matching - read the docs because this trips everyone up. Also check backend configuration and parameter forwarding guide.

Backend Service Discovery Failures

Symptom: 502 errors, "connection refused", KrakenD can't reach your services even though they're running.

In Kubernetes, this is usually DNS resolution. KrakenD tries to connect to backend-service:8080 but can't resolve the hostname because of namespace issues or service naming problems. Check the service discovery documentation and Kubernetes networking guide.

Debug the networking:

## From inside your KrakenD pod
kubectl exec -it krakend-pod -- nslookup backend-service
kubectl exec -it krakend-pod -- curl your-backend-service:8080/health
## Replace 'your-backend-service' with your actual service name and add http://

Kubernetes-specific fixes:

  • Use full service names: backend-service.namespace.svc.cluster.local:8080
  • Check your service selector labels match your backend pods
  • Verify port numbers - common mistake is exposing 80 but backend listens on 8080

JWT Validation Breaking Authentication

Symptom: 401 errors for valid tokens, authentication works sporadically, users getting logged out randomly.

KrakenD's JWT validation is picky about token format and timing. Clock drift between services can cause valid tokens to be rejected as expired.

Common authentication failures:

  • JWK endpoint unreachable - KrakenD can't fetch public keys
  • Token algorithm mismatch - your auth service uses RS256, config says HS256
  • Clock synchronization issues - NTP drift causes timing validation failures

The nuclear option that usually works:

{
  "auth/validator": {
    "alg": "RS256",
    "jwk_url": "https://your-auth.com/.well-known/jwks.json",
    "cache_ttl": "15m",
    "disable_jwk_security": true
  }
}

disable_jwk_security is a temporary hack while you fix the real issue. Don't leave it in production.

Rate Limiting Gone Wrong

Symptom: Legitimate traffic getting 429 errors, rate limits triggering during normal load, users complaining about blocked requests.

KrakenD's rate limiting configuration is confusing and the defaults are aggressive. Token bucket settings don't behave like most people expect.

Rate limiting that doesn't suck:

{
  "qos/ratelimit/token-bucket": {
    "max_rate": 1000,
    "capacity": 1000,
    "every": "1s"
  }
}

Start with generous limits and tune down based on actual traffic patterns. Monitor your rate limiting metrics in Grafana to see what's actually being blocked.

Emergency Debugging Questions (Quick Fixes)

Q

Why is KrakenD returning 502 errors for backends that are clearly running?

A

Check the obvious stuff first:

  • Is the backend URL spelled correctly in your config? Missing http:// prefix is the most common mistake
  • Can KrakenD actually reach the backend? kubectl exec -it krakend-pod -- curl backend-url
  • Are you using the right port? Service port vs container port confusion kills 30% of deployments

Real fix: Add health checks to your backend services and monitor connectivity from KrakenD pods. Circuit breakers will help isolate failing services but they won't fix basic networking issues.

Q

KrakenD keeps crashing with exit code 137 - what's killing it?

A

It's almost always memory limits. Exit code 137 means Kubernetes killed your pod for using too much RAM. KrakenD can consume massive amounts of memory during traffic spikes if you don't set proper resource limits.

resources:
  limits:
    memory: "1Gi"    # Set this based on your actual usage
  requests:
    memory: "256Mi"

Debugging memory issues: Check your concurrent requests settings. Default is unlimited, which will eat all available memory.

Q

Config changes aren't taking effect - what am I doing wrong?

A

Most likely culprits:

  1. Config not mounted properly - check your Kubernetes ConfigMap and volume mounts
  2. KrakenD didn't restart - config changes require a restart unless you have hot reload enabled
  3. Invalid JSON - use krakend check --config krakend.json to validate
  4. Wrong config file path - KrakenD defaults to looking for /etc/krakend/krakend.json

Quick validation: kubectl exec -it krakend-pod -- cat /etc/krakend/krakend.json to see what config KrakenD is actually using.

Q

JWT validation is randomly failing - tokens work sometimes but not others

A

Classic symptoms of clock drift or JWK caching issues. JWTs have expiration times that are sensitive to clock synchronization between services.

Immediate fixes:

  • Check NTP synchronization on all nodes
  • Increase JWK cache TTL in your config to reduce key fetching issues
  • Verify your auth service's JWK endpoint is always reachable
  • Consider setting cookie_key if you're using JWT signing with cookies
Q

Rate limiting is blocking legitimate traffic - how do I tune it?

A

KrakenD's rate limiting is per-instance, not global. If you have 3 KrakenD pods, each gets the full rate limit allocation. This catches everyone off guard.

{
  "qos/ratelimit/token-bucket": {
    "max_rate": 100,
    "capacity": 200,
    "every": "1s"
  }
}

Start high and tune down based on actual metrics. Use your monitoring dashboard to see what's being rate limited before adjusting limits.

Q

KrakenD won't start and logs show "bind: address already in use"

A

Port conflict. Another process is using port 8080 (KrakenD's default). This happens in Docker environments when you have multiple containers trying to use the same port.

Quick fixes:

  • Change KrakenD's port in config: "port": 8081
  • Check what's using the port: lsof -i :8080 or netstat -tulpn | grep 8080
  • In Kubernetes, check for port conflicts in your service definitions
Q

Backend services are slow and KrakenD is timing out - how do I fix timeouts?

A

Timeout hell is common with microservices. KrakenD has multiple timeout settings that can conflict with each other.

Timeout hierarchy (from most specific to least):

  1. Backend timeout: "timeout": "30s" in backend config
  2. Endpoint timeout: "timeout": "45s" in endpoint config
  3. Global timeout: "timeout": "60s" in root config

Rule of thumb: Backend timeout < Endpoint timeout < Global timeout. Give yourself buffer time for aggregation and processing.

Q

Why can't I see detailed error messages from my backends?

A

KrakenD sanitizes backend errors by default. You're probably seeing generic 500 errors instead of the actual backend error messages.

Enable detailed errors:

{
  "backend": [{
    "url_pattern": "/api/service",
    "host": ["http://backend:8080"],
    "extra_config": {
      "backend/http": {
        "return_error_details": "backend_alias"
      }
    }
  }]
}

Security warning: Don't enable this in production unless you're sure your backend errors don't leak sensitive information.

Production Monitoring That Actually Helps

Production Monitoring That Actually Helps

When KrakenD breaks in production, you need monitoring that tells you what's wrong instead of just that something is wrong.

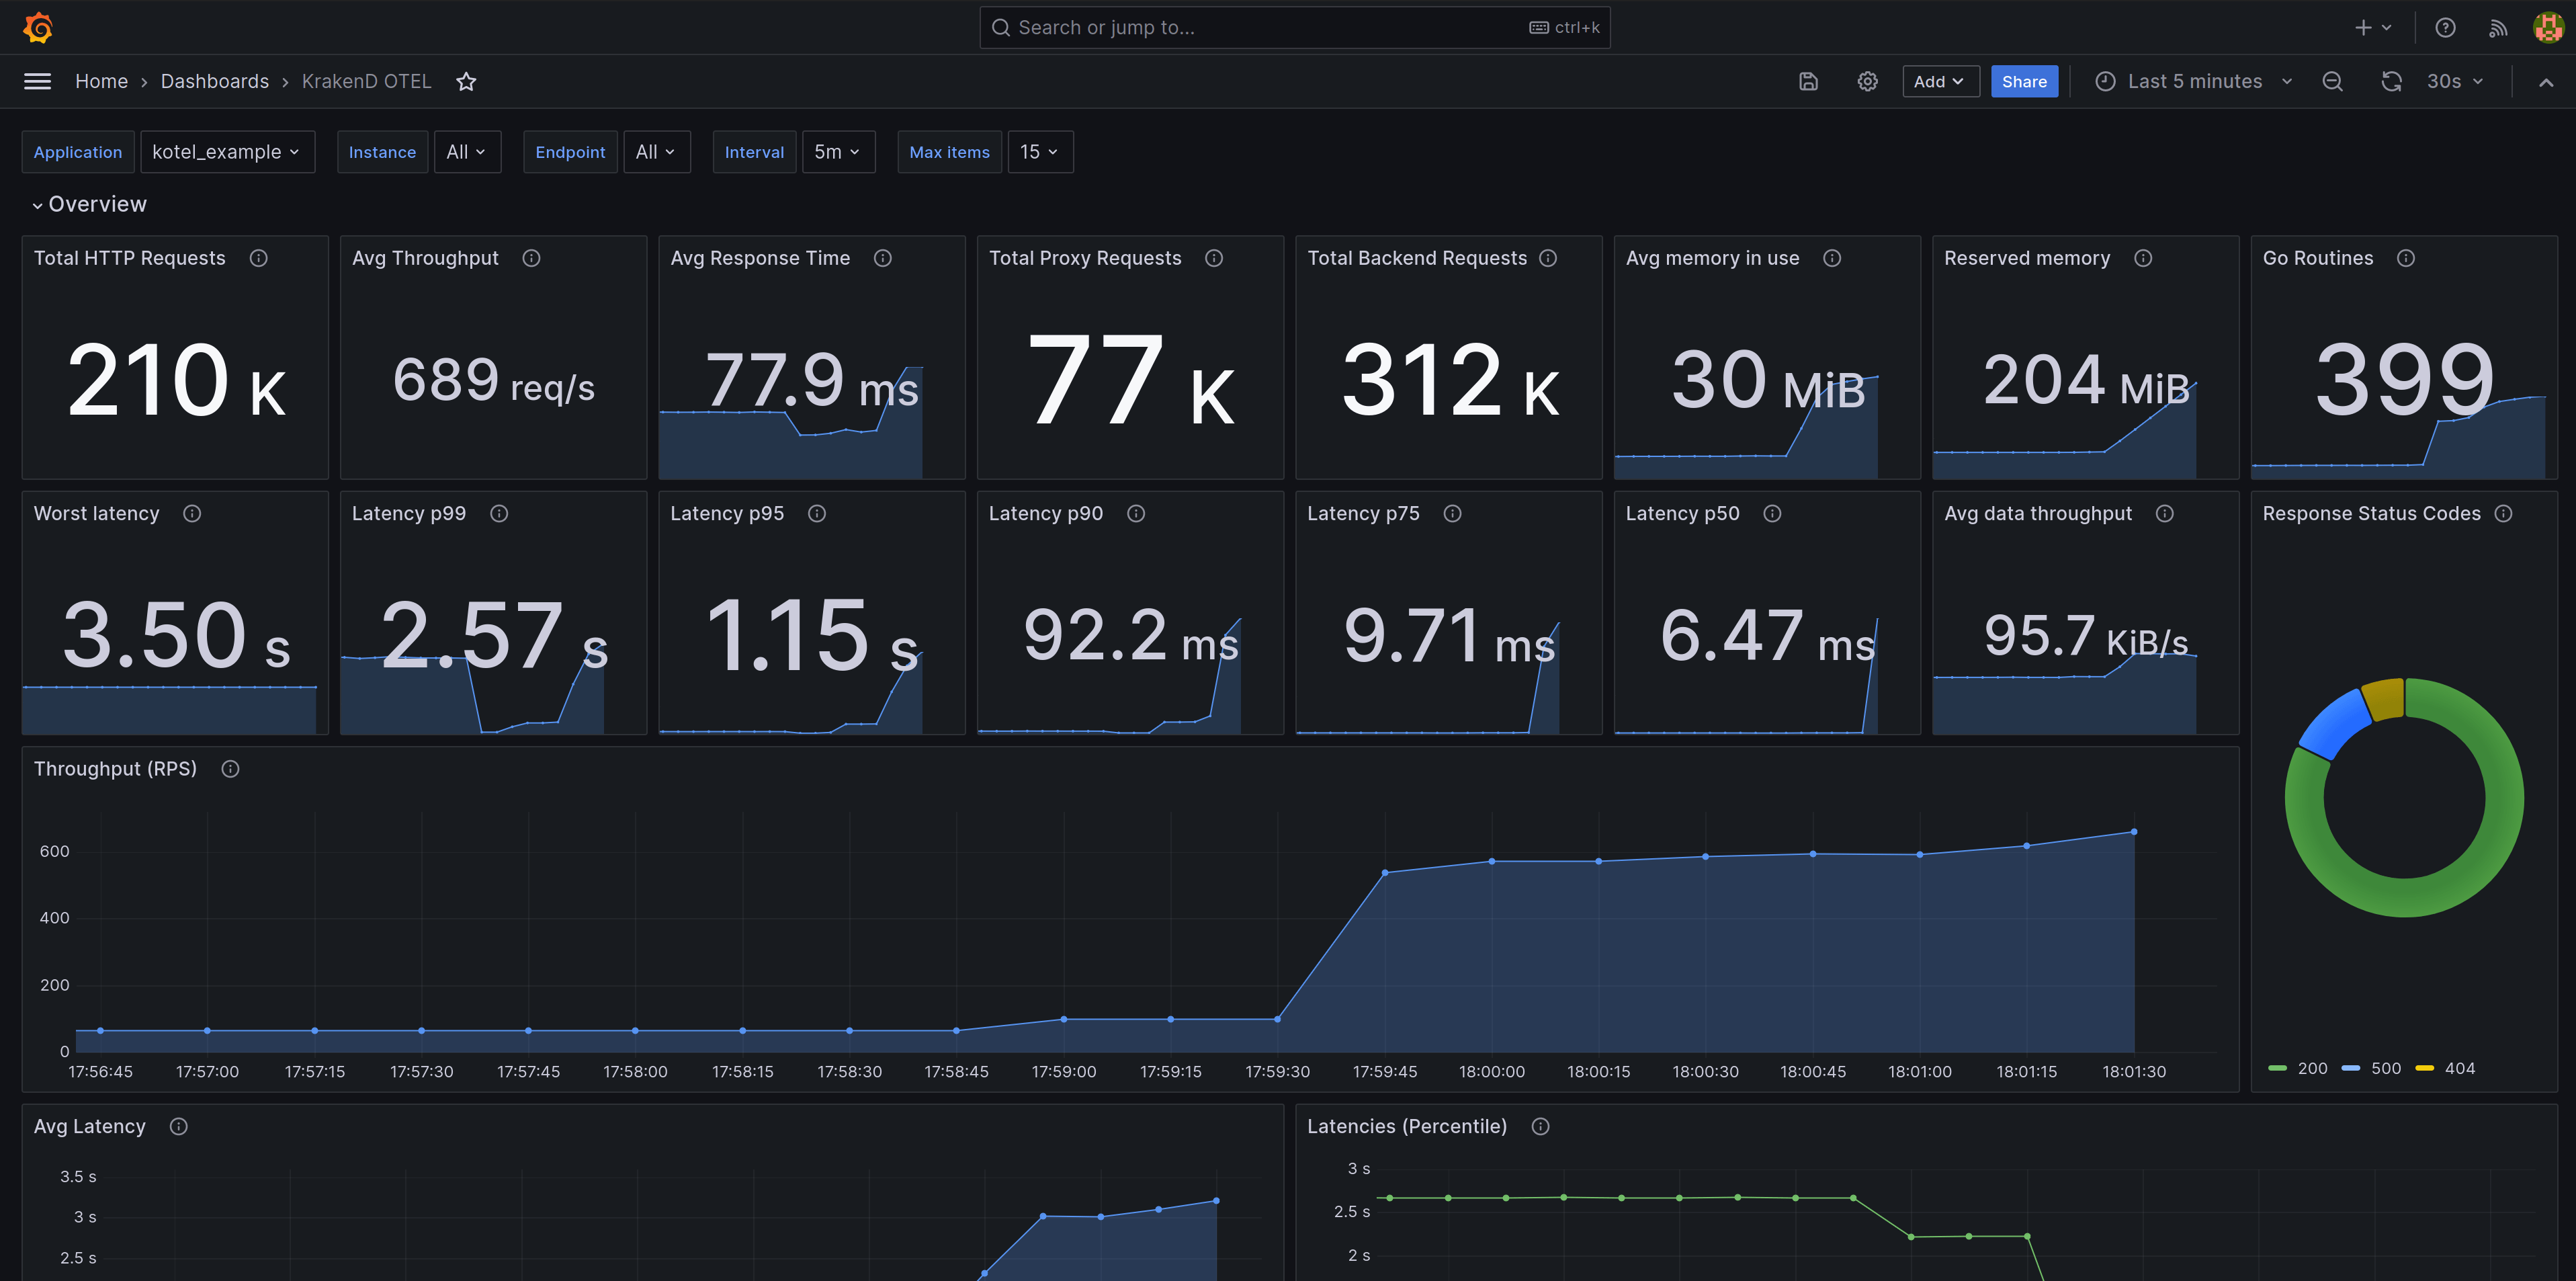
Most teams set up the basic metrics but miss the ones that matter during incidents. Check the telemetry overview and OpenTelemetry implementation guide for comprehensive monitoring setup.### Essential Metrics for Production KrakenD**Memory and CPU are basic

  • these are the ones that save your ass:**KrakenD Detailed Performance DashboardResponse time percentiles by endpoint:

P95 and P99 latencies tell you which endpoints are struggling before users complain. Monitor these per endpoint, not just globally. Set up Prometheus monitoring and Grafana dashboards for visualization.Circuit breaker state changes:

When circuit breakers start opening, you have maybe 60 seconds before the incident escalates. Set alerts on circuit breaker state transitions, not just error rates.Backend connection failures: Track connection refused, timeout, and DNS resolution errors separately.

Each indicates a different type of problem requiring different fixes.JWT validation failures: Separate auth failures from other 401s.

Clock drift and JWK endpoint issues show up here first.Request queue depth: KrakenD queues requests during backend slowdowns.

Queue depth growing means you're about to have a bad time.### Logging Configuration for TroubleshootingStandard KrakenD logs are useless for production debugging. You need structured logging with the right log levels. Check the logging documentation and Graylog integration guide for structured logging setup.json{"extra_config": {"telemetry/logging": {"level": "INFO","prefix": "[KRAKEND]","syslog": false,"stdout": true,"format": "json"}}}Critical log patterns to alert on:

  • connection refused
  • Backend connectivity issues
  • context deadline exceeded
  • Timeout problems
  • jwt validation failed
  • Authentication problems
  • circuit breaker is open
  • Backend failures### Health Check StrategyKrakenD's health endpoint only tells you if the process is running, not if it's working correctly.Better health checks test actual functionality:json{"endpoints": [{"endpoint": "/__health_detailed","method": "GET","backend": [{"url_pattern": "/health","host": ["http://critical-backend:8080"]}]}]}Create a health endpoint that actually tests backend connectivity.

Use this for Kubernetes liveness probes instead of the default health endpoint.### Alert Thresholds That WorkToo many false positives train people to ignore alerts. These thresholds are based on real production experience:

  • Error rate > 1% for more than 2 minutes (not just a spike)
  • P95 response time > 2x baseline for 5 minutes
  • Circuit breaker open for any duration (immediate alert)
  • Memory usage > 80% for 10 minutes (gives you time to scale before OOM kills)
  • Backend connection failures > 10/minute for any backend### Performance Troubleshooting Workflow

When KrakenD performance goes to shit, follow this debugging sequence:**1.

Check backend health first**: 80% of KrakenD performance issues are actually backend issues.

Look at backend response times and error rates before diving into gateway metrics.2. Review traffic patterns: Sudden traffic spikes break things in predictable ways.

Check if the performance degradation correlates with traffic increases.3. Examine resource utilization: Memory and CPU spikes indicate resource constraints.

Scale horizontally before trying to tune configuration.4. Validate configuration changes: Recent config deployments cause most production issues.

Compare current config with the last known good configuration.5. Analyze request flows: Use distributed tracing to understand where requests are spending time.

Request aggregation and data manipulation can be expensive. Also check Zipkin integration and AWS X-Ray setup for tracing.### Capacity Planning Reality CheckKrakenD scales differently than other services. Most teams underestimate memory requirements and overestimate CPU needs.

Check the server dimensioning guide and clustering documentation for scaling best practices.Memory scaling:

Kraken

D uses roughly 100MB base + (concurrent_requests × 1MB) per endpoint. If you have 10 endpoints configured for 100 concurrent requests each, expect 1GB+ memory usage under load.CPU scaling: KrakenD is CPU efficient until you hit network I/O limits.

You'll usually need more replicas for network bandwidth before you need more CPU cores.Network bandwidth: API gateways push a lot of data.

Monitor network utilization

Advanced Production Problems (The Hard Stuff)

Q

KrakenD is consuming all available memory during traffic spikes - how do I fix it?

A

This is usually concurrent request limits combined with slow backends. KrakenD queues requests and spawns goroutines for each concurrent request. Slow backends mean requests pile up and consume memory.Immediate fixes:json{"endpoints": [{"concurrent_calls": 10, // Limit concurrent backend calls"extra_config": {"qos/ratelimit/token-bucket": {"max_rate": 100,"capacity": 200}}}]}Set explicit concurrent call limits per endpoint. Default unlimited concurrency will exhaust memory during traffic spikes.Resource limits that actually work:yamlresources: limits: memory: "2Gi" cpu: "1000m" requests: memory: "512Mi" cpu: "200m"

Q

Configuration changes cause intermittent 404s - what's the deployment issue?

A

Rolling updates with configuration changes break routing temporarily.

Kraken

D loads configuration at startup, so config changes require pod restarts during rolling deployments.Zero-downtime config updates: 1.

Use flexible configuration with environment variables for values that change frequently 2.

Deploy configuration changes as separate step from image updates 3. Consider hot reload for Enterprise editionConfigMap update strategy:yamlspec: template: metadata: annotations: configHash: "{{ .Values.configHash }}" # Force pod restart on config change

Q

Circuit breakers are opening unnecessarily during normal load - how do I tune them?

A

Default circuit breaker settings are too aggressive for most real-world scenarios.

They're designed for protecting against cascading failures, not normal traffic variance.json{"backend": [{"extra_config": {"qos/circuit-breaker": {"interval": 60,"max_errors": 10,"name": "backend-circuit-breaker","timeout": 10}}}]}Tuning guidelines:

  • max_errors:

Start with 20-30 errors per interval, not the default 5

  • interval: 60 seconds gives you enough data to make decisions
  • timeout: How long to wait before trying again
  • start with 10 secondsMonitor circuit breaker state in your dashboards and adjust based on actual failure patterns.
Q

JWT tokens are being rejected with "signature verification failed" errors

A

Usually a key rotation or algorithm mismatch issue.

Your auth service rotated keys but KrakenD is still caching the old public key.Debug JWT validation:bash# Check what KrakenD is seeingkubectl logs -f krakend-pod | grep "jwt"# Manually validate a failing tokenecho "your-jwt-token" | cut -d. -f2 | base64 -d | jq .Common fixes:

  • Reduce JWK cache TTL: "cache_ttl": "5m" instead of default 15 minutes
  • Verify algorithm matches: "alg": "RS256" vs what your auth service uses
  • Check JWK endpoint accessibility from KrakenD pods
Q

Backend services are healthy but KrakenD shows connection failures

A

DNS resolution problems in Kubernetes.

This is especially common in multi-namespace deployments where service discovery gets confused.Debugging network connectivity:bash# From KrakenD podkubectl exec -it krakend-pod -- nslookup backend-servicekubectl exec -it krakend-pod -- curl -v your-backend-service:8080/health# Replace 'your-backend-service' with your actual service name and add http://kubectl exec -it krakend-pod -- netstat -rn # Check routing tableService naming gotchas:

  • Use full service DNS names: backend-service.namespace.svc.cluster.local
  • Check service selector labels match backend pod labels
  • Verify service ports match backend container ports
Q

Rate limiting isn't working as expected - legitimate traffic gets blocked

A

Per-instance vs cluster-wide rate limiting confusion. KrakenD applies rate limits per instance, so 3 replicas = 3x the configured limit.Rate limiting that makes sense:json{"extra_config": {"qos/ratelimit/token-bucket": {"max_rate": 100, // Per instance limit"capacity": 200, // Burst capacity"every": "1s"}}}Calculate actual limits: (max_rate × number_of_replicas) = cluster-wide limitConsider cluster rate limiting if you need true global rate limits across replicas.

Q

KrakenD performance degrades over time - what's causing the memory leak?

A

Usually goroutine leaks from abandoned requests or connection pooling issues.

Long-running KrakenD instances accumulate connections and goroutines over time.Memory leak debugging:bash# Check goroutine count over timekubectl exec -it krakend-pod -- curl localhost:8080/__stats# Monitor connection poolskubectl exec -it krakend-pod -- netstat -an | grep ESTABLISHED | wc -lCommon causes:

  • Backend services not properly closing connections

  • Infinite timeout configurations allowing requests to hang forever

  • Missing context cancellation in custom pluginsMitigation strategies:

  • Set reasonable timeouts at all levels

  • Monitor goroutine count and restart pods when it grows too large

  • Use connection pooling limits in your HTTP client configuration

Related Tools & Recommendations

tool
Similar content

KrakenD API Gateway: Fast, Open Source API Management Overview

The fastest stateless API Gateway that doesn't crash when you actually need it

Kraken.io
/tool/kraken/overview
100%
tool
Similar content

Bolt.new Production Deployment Troubleshooting Guide

Beyond the demo: Real deployment issues, broken builds, and the fixes that actually work

Bolt.new
/tool/bolt-new/production-deployment-troubleshooting
63%
tool
Similar content

AWS Lambda Overview: Run Code Without Servers - Pros & Cons

Upload your function, AWS runs it when stuff happens. Works great until you need to debug something at 3am.

AWS Lambda
/tool/aws-lambda/overview
56%
tool
Similar content

Fix gRPC Production Errors - The 3AM Debugging Guide

Fix critical gRPC production errors: 'connection refused', 'DEADLINE_EXCEEDED', and slow calls. This guide provides debugging strategies and monitoring solution

gRPC
/tool/grpc/production-troubleshooting
56%
tool
Similar content

TaxBit Enterprise Production Troubleshooting: Debug & Fix Issues

Real errors, working fixes, and why your monitoring needs to catch these before 3AM calls

TaxBit Enterprise
/tool/taxbit-enterprise/production-troubleshooting
53%
tool
Similar content

Fix Pulumi Deployment Failures - Complete Troubleshooting Guide

Master Pulumi deployment troubleshooting with this comprehensive guide. Learn systematic debugging, resolve common "resource creation failed" errors, and handle

Pulumi
/tool/pulumi/troubleshooting-guide
50%
tool
Similar content

ArgoCD Production Troubleshooting: Debugging & Fixing Deployments

The real-world guide to debugging ArgoCD when your deployments are on fire and your pager won't stop buzzing

Argo CD
/tool/argocd/production-troubleshooting
50%
tool
Similar content

Kong Gateway: Cloud-Native API Gateway Overview & Features

Explore Kong Gateway, the open-source, cloud-native API gateway built on NGINX. Understand its core features, pricing structure, and find answers to common FAQs

Kong Gateway
/tool/kong/overview
47%
tool
Similar content

Fix TaxAct Errors: Login, WebView2, E-file & State Rejection Guide

The 3am tax deadline debugging guide for login crashes, WebView2 errors, and all the shit that goes wrong when you need it to work

TaxAct
/tool/taxact/troubleshooting-guide
46%
tool
Similar content

AWS API Gateway Security Hardening: Protect Your APIs in Production

Learn how to harden AWS API Gateway for production. Implement WAF, mitigate DDoS attacks, and optimize performance during security incidents to protect your API

AWS API Gateway
/tool/aws-api-gateway/production-security-hardening
43%
tool
Similar content

Trivy & Docker Security Scanner Failures: Debugging CI/CD Integration Issues

Troubleshoot common Docker security scanner failures like Trivy database timeouts or 'resource temporarily unavailable' errors in CI/CD. Learn to debug and fix

Docker Security Scanners (Category)
/tool/docker-security-scanners/troubleshooting-failures
43%
tool
Similar content

Solana Web3.js Production Debugging Guide: Fix Common Errors

Learn to effectively debug and fix common Solana Web3.js production errors with this comprehensive guide. Tackle 'heap out of memory' and 'blockhash not found'

Solana Web3.js
/tool/solana-web3js/production-debugging-guide
43%
tool
Similar content

npm Enterprise Troubleshooting: Fix Corporate IT & Dev Problems

Production failures, proxy hell, and the CI/CD problems that actually cost money

npm
/tool/npm/enterprise-troubleshooting
43%
integration
Recommended

Get Alpaca Market Data Without the Connection Constantly Dying on You

WebSocket Streaming That Actually Works: Stop Polling APIs Like It's 2005

Alpaca Trading API
/integration/alpaca-trading-api-python/realtime-streaming-integration
42%
integration
Recommended

ib_insync is Dead, Here's How to Migrate Without Breaking Everything

ibinsync → ibasync: The 2024 API Apocalypse Survival Guide

Interactive Brokers API
/integration/interactive-brokers-python/python-library-migration-guide
42%
tool
Recommended

Python - The Language Everyone Uses (Despite Its Flaws)

Easy to write, slow to run, and impossible to escape in 2025

Python
/tool/python/overview
42%
tool
Similar content

Arbitrum Production Debugging: Fix Gas & WASM Errors in Live Dapps

Real debugging for developers who've been burned by production failures

Arbitrum SDK
/tool/arbitrum-development-tools/production-debugging-guide
42%
troubleshoot
Similar content

Fix MongoDB "Topology Was Destroyed" Connection Pool Errors

Production-tested solutions for MongoDB topology errors that break Node.js apps and kill database connections

MongoDB
/troubleshoot/mongodb-topology-closed/connection-pool-exhaustion-solutions
42%
tool
Similar content

AWS API Gateway: The API Service That Actually Works

Discover AWS API Gateway, the service for managing and securing APIs. Learn its role in authentication, rate limiting, and building serverless APIs with Lambda.

AWS API Gateway
/tool/aws-api-gateway/overview
41%
tool
Similar content

React Production Debugging: Fix App Crashes & White Screens

Five ways React apps crash in production that'll make you question your life choices.

React
/tool/react/debugging-production-issues
41%

Recommendations combine user behavior, content similarity, research intelligence, and SEO optimization