I switched to DeepSeek because it's way cheaper than OpenAI - like $1 vs $20 for the same task cheap. But holy shit, the first implementation was painfully slow. 30-second response times that made users think the app was broken.
Turns out I was doing basically everything wrong. Here's what actually happened and how I unfucked it.
The Stupid Shit That Slows You Down
Model mix-up (cost me 2 hours of debugging): I accidentally used deepseek-reasoner instead of deepseek-chat and couldn't figure out why everything took 90 seconds. Reasoner is *supposed* to be slow - it shows its thinking. If you want fast responses, use `deepseek-chat`. Seems obvious now but the docs don't make this super clear.
Connection pool exhaustion: My app was creating a new HTTPS connection for every request like an idiot. Each connection takes about 500ms just for the TLS handshake. With 10 requests that's 5 seconds of pure overhead before DeepSeek even sees your prompt. HTTP connection pooling fixes this by reusing connections.

Geographic fuckery: DeepSeek's main servers are in Asia. If your app is in US-East, you're looking at 200-300ms round trip just for physics. Not much you can do about this except move to Singapore. Network latency calculators show realistic expectations.
Geography matters: servers in different regions will have vastly different latency to DeepSeek's Asia-based infrastructure.

World latency map showing geographic impact on network performance - DeepSeek's servers are primarily in Asia, which affects global response times.
How to Actually Measure Performance (Not Bullshit Metrics)
Skip the fancy APM tools at first. Just log response times and see what's actually slow. Python's time module is all you need:
import time

def time_deepseek_call(prompt):
    start = time.time()

    # Your API call here
    response = requests.post('https://api.deepseek.com/v1/chat/completions', ...)

    end = time.time()
    duration = end - start

    print(f"DeepSeek took {duration:.2f}s for {len(prompt)} chars")

    if duration > 5:
        print(f"SLOW REQUEST: {prompt[:100]}...")

    return response
That's it. Don't overthink it. If you see requests taking 10+ seconds, that's your problem right there.
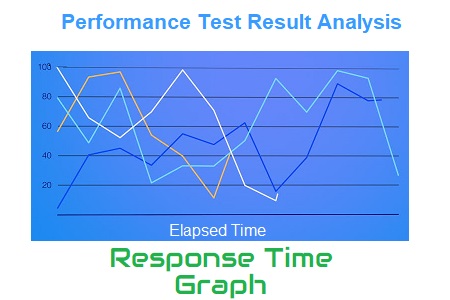
Example response time graph showing API performance over time - look for patterns and spikes that indicate performance issues.
What times to expect:
deepseek-chat: 1-4 seconds for normal promptsdeepseek-reasoner: 30-90 seconds (this is normal!)- Connection setup: ~500ms first time, ~50ms with pooling
Debugging When Shit Goes Sideways
When stuff gets slow, here's what I actually do (not some made-up framework):
Test with curl first:
## Test latency to DeepSeek API endpoint (replace with your actual API key)
time curl -X POST "https://api.deepseek.com/v1/chat/completions" \
  -H "Authorization: Bearer YOUR_ACTUAL_API_KEY_HERE" \
  -H "Content-Type: application/json" \
  -d '{"model":"deepseek-chat","messages":[{"role":"user","content":"Hello"}]}'
Replace YOUR_ACTUAL_API_KEY_HERE with your actual DeepSeek API key from the platform. This command tests network latency to the API endpoint. If curl with a real key is fast but your app is slow, your code sucks. If curl is also slow, it's network/API issues.
More debugging stuff:
- Official API docs
- DeepSeek GitHub for examples
Check if you're hitting rate limits:
Look for 429 status codes. DeepSeek rate limits are pretty generous but if you're hammering the API you'll get throttled. Check the rate limits documentation for specifics.
Connection pool debugging:
Most HTTP libraries have debugging modes. For Python requests:
import logging
logging.basicConfig(level=logging.DEBUG)
Look for tons of "Starting new HTTPS connection" messages. That means you're not reusing connections like an idiot.
The goal isn't "sub-second response times" (that's marketing bullshit). The goal is "fast enough that users don't complain."

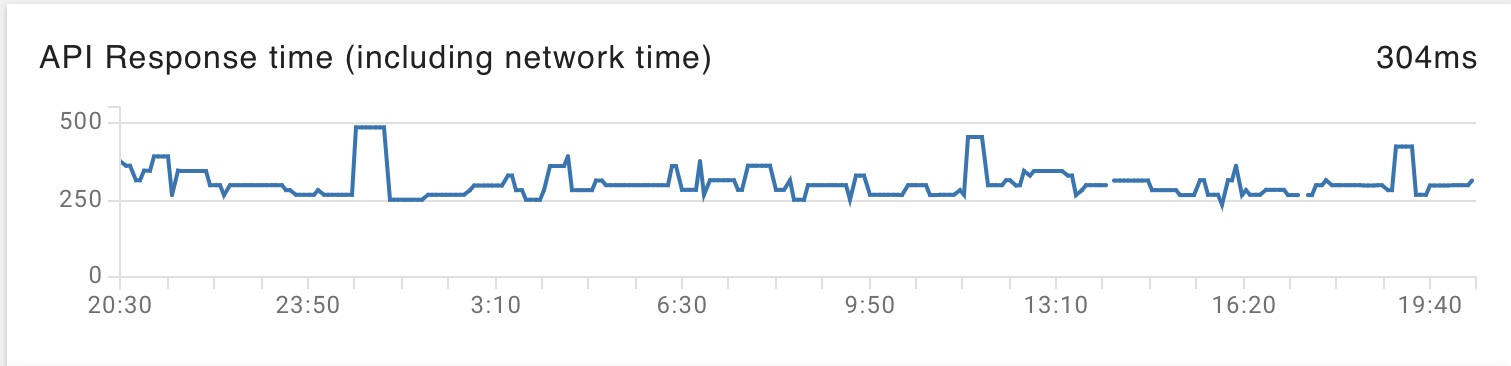
Performance analytics dashboard showing real-time metrics - this is what good monitoring looks like in practice.


 *Real performance testing graph from Stack Overflow showing fluctuating response times