Of course your Python app worked perfectly on your laptop with 10 test records. Production is where dreams go to die. After wasting weeks fighting with broken profilers and chasing phantom bottlenecks, I learned that guessing what's wrong costs you sleep and sanity. Here's what actually matters when everything's on fire.
The Performance Symptoms That Actually Matter
Memory Leaks That Kill Servers: Your Django app starts around 150MB and just keeps growing - hit 8GB before the server finally gave up and died. The server crashes during your biggest sales day because someone didn't close database connections properly. I've seen this exact scenario take down production three times - twice because developers didn't understand Django's connection management, once because someone stored user sessions in memory "temporarily."
The N+1 Query Apocalypse: Your homepage loads 200 users and their profiles. Looks innocent enough. Then you realize it's generating tons of database queries - one for users, then one query per user for their profile. Database CPU goes from 20% to 400%. I learned this the hard way when our Django ORM was generating thousands of queries - I think it was like 12,000? Maybe more? Point is, way too many for what should have been 2-3 queries.

GIL-Induced Single-Core Sadness: You bought a $500/month 16-core server and your Python code uses exactly one core while the other 15 sit there mocking you. The Global Interpreter Lock is Python's biggest middle finger to parallel processing. CPU-bound work in Python is like trying to race with your parking brake on.
Import-Time Disasters: Your Lambda function takes 5 seconds to import dependencies before it even starts running your code. Cold starts become hot garbage. Pro tip: lazy imports aren't just good practice, they're survival.
How to Actually Debug This Shit

Forget the academic bullshit about "establishing baselines." When your app is hemorrhaging money and users are leaving, you need answers fast. Here's what actually works when you're debugging a weekend outage:
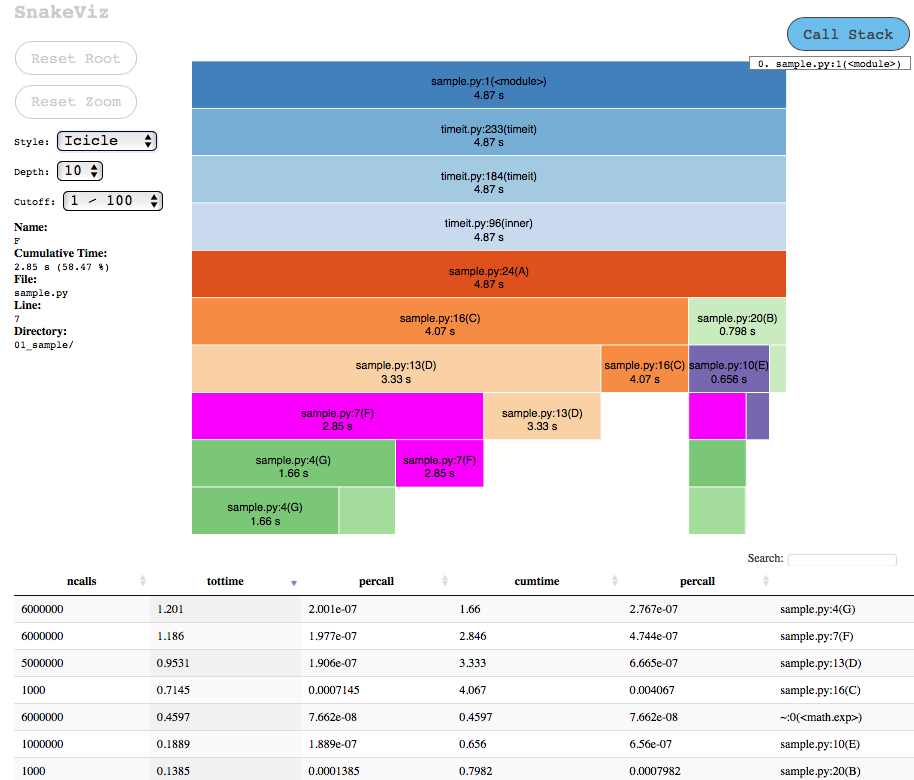
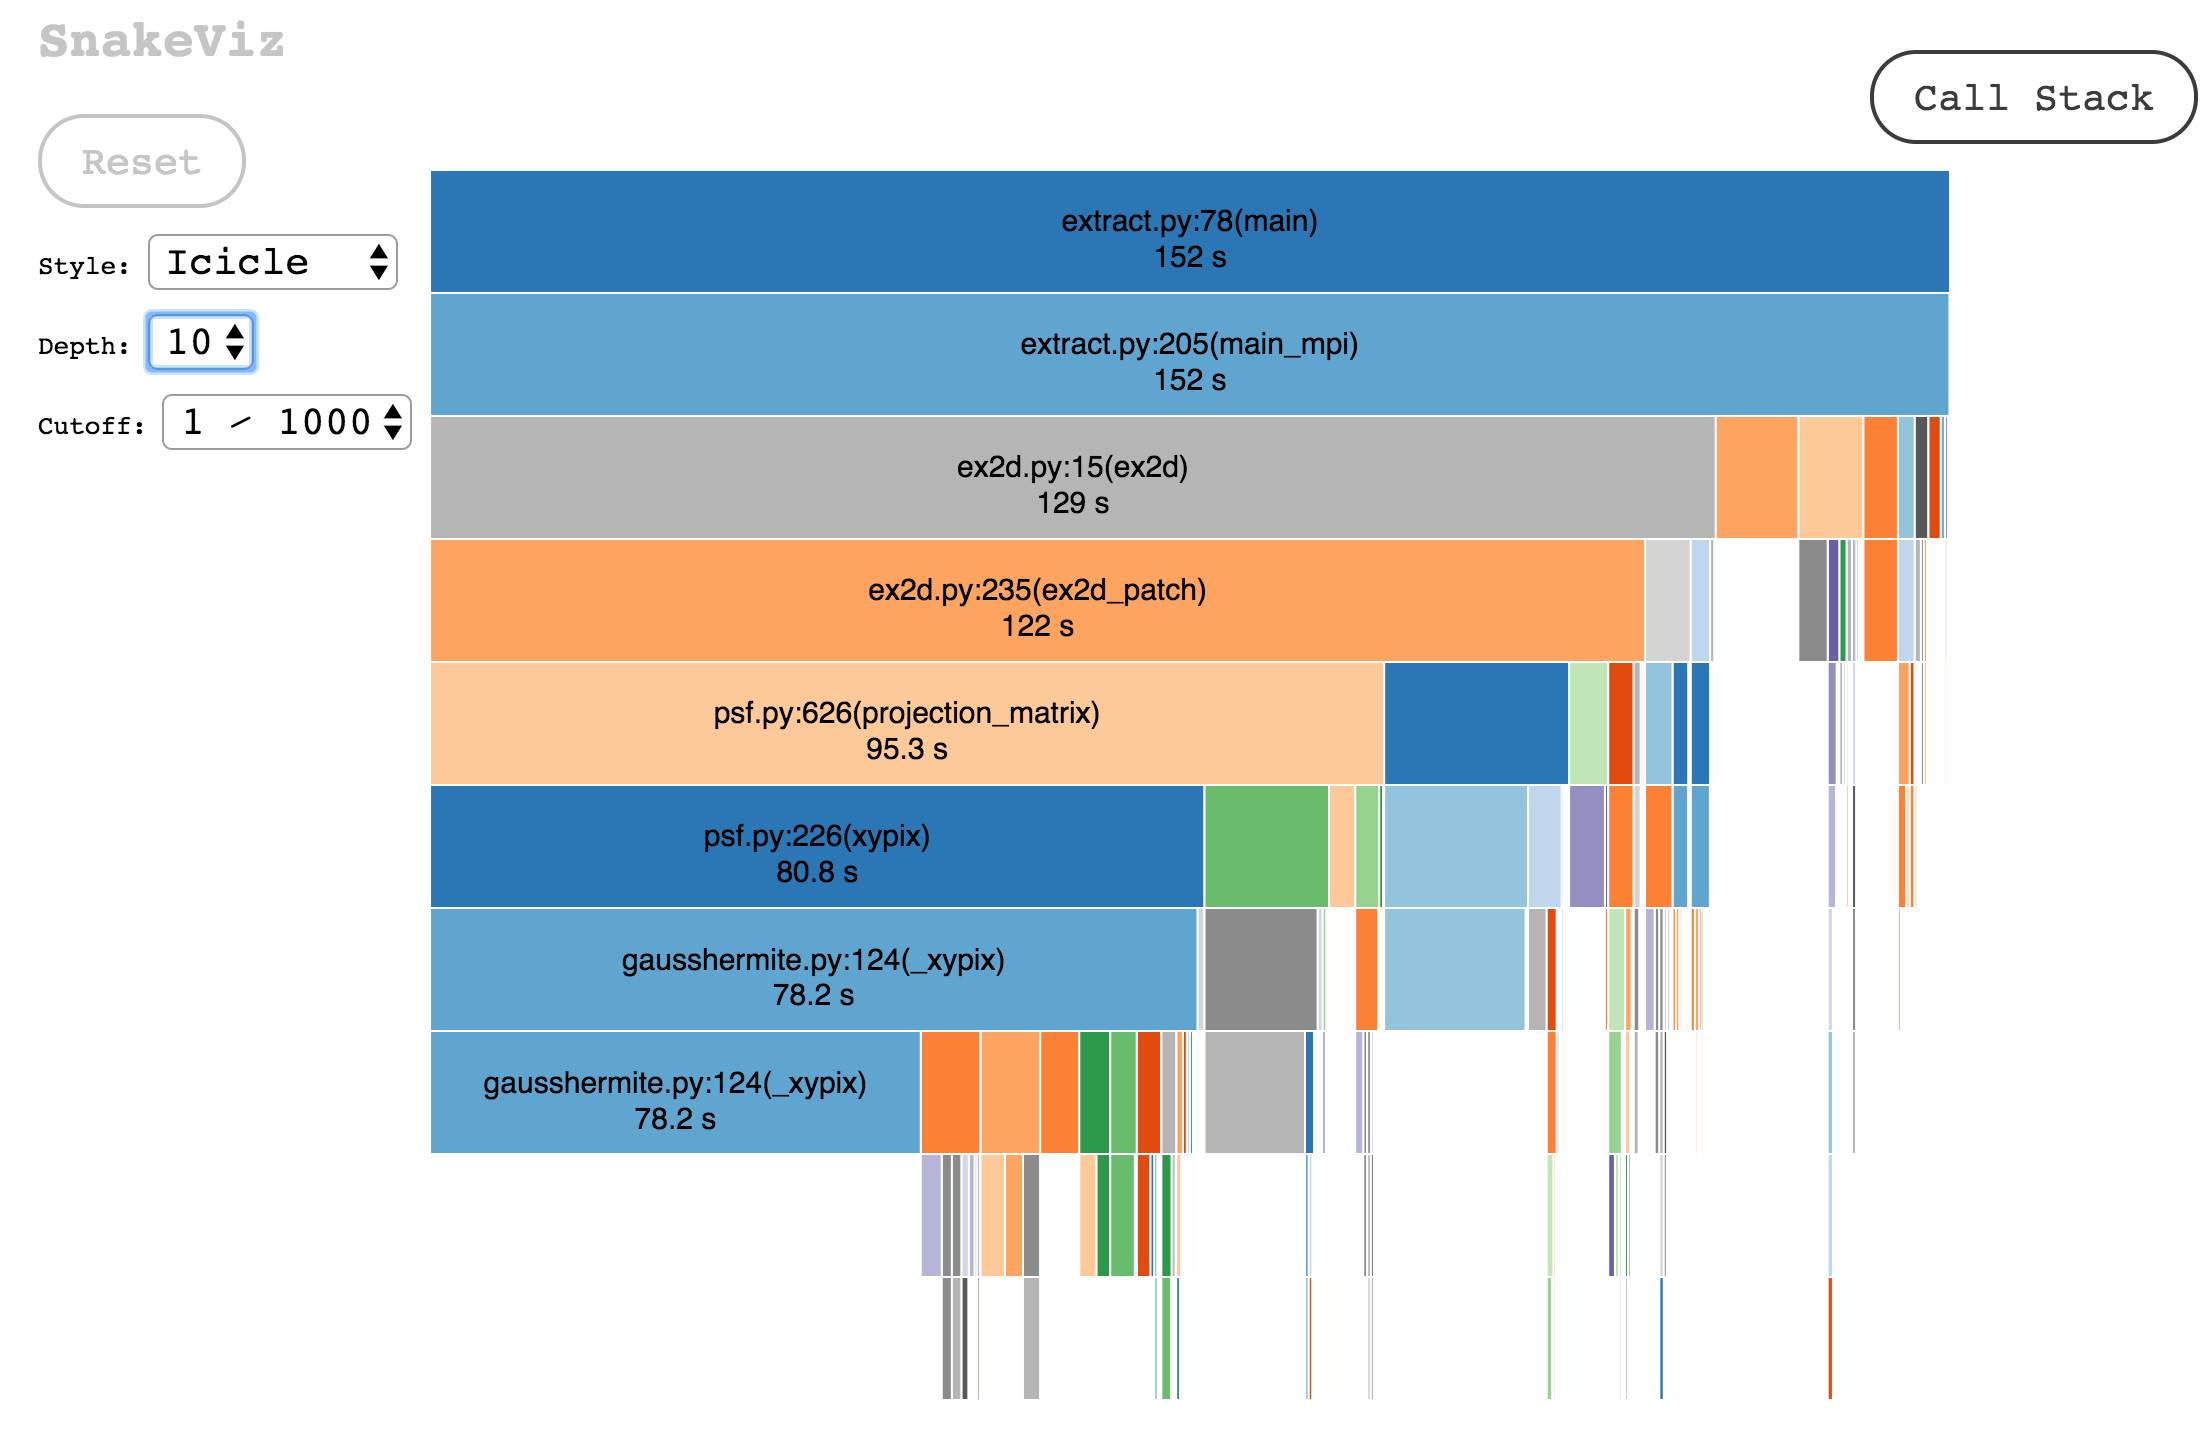
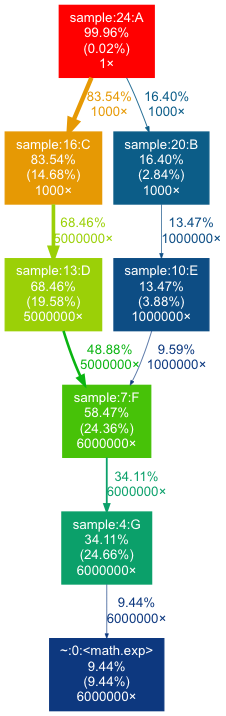
Step 1: Profile the Real Problem, Not Your Assumptions
I wasted three days optimizing a function that ran 0.01% of the time because I "knew" it was slow. Use py-spy first - it attaches to your running process without making things worse. If your app is too broken to run properly, fall back to cProfile, but expect it to slow everything down like molasses on my 2019 MacBook Pro.
## This actually works in production
py-spy record -o profile.svg --pid $(pgrep python) --duration 60
## Don't do this in prod - it'll make things worse
python -m cProfile -o profile.prof slow_app.py
Step 2: Reproduce With Production Data or Don't Bother
Your cute little test database with 100 records won't show the N+1 queries that murder performance with 100,000 records. I've debugged "performance problems" that only existed with realistic data volumes. Use Locust to generate actual load, not the gentle tickle of a single curl request.
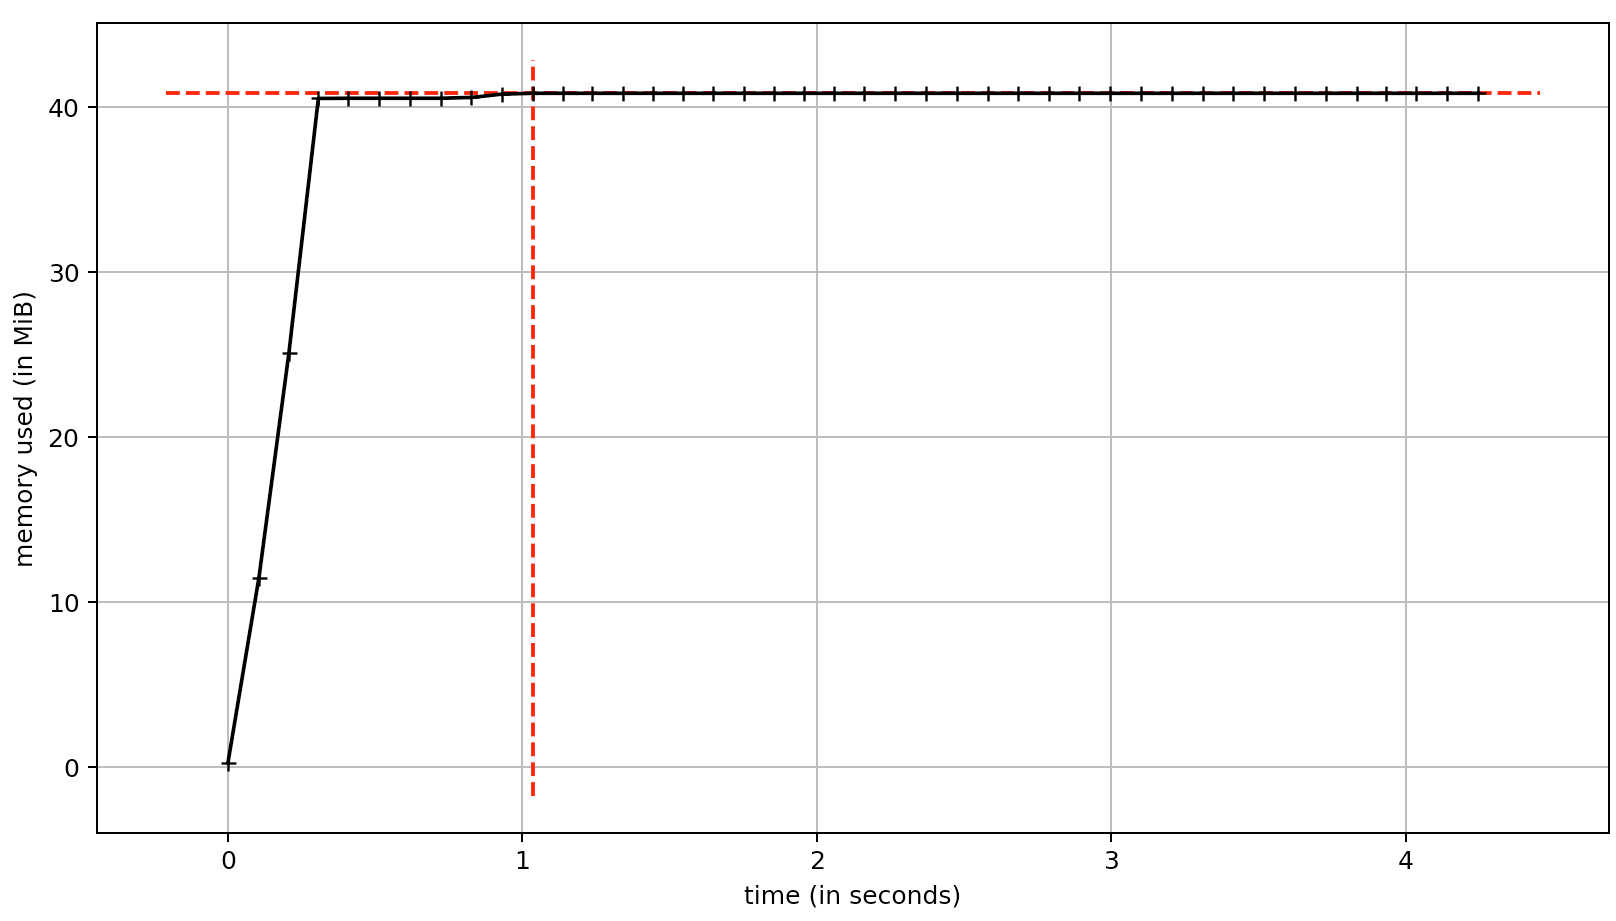
Step 3: Use Tools That Don't Lie to You
Scalene tells you if the problem is your Python code or the C libraries underneath. memory_profiler shows you line-by-line where your memory disappears. Don't trust just one tool - profilers lie, especially cProfile when you have threading.
The Performance Disasters I've Seen Kill Production
The List Comprehension That Ate All the RAM: Some asshole wrote results = [expensive_function(item) for item in million_items] and wondered why the server died. That innocent-looking line allocates memory for a million objects at once. The fix? Use a generator: results = (expensive_function(item) for item in million_items). Learned this when our ETL job crashed trying to process 500MB of CSV data.
The N+1 Query That Brought Down Black Friday: Displaying user profiles on our homepage. Simple, right? Wrong. The ORM generated one query per user instead of a single JOIN. Tons of page views meant the database was getting hammered with queries. Database CPU went to 100% and stayed there. Two hours of downtime, $50K in lost sales. select_related() would have prevented this nightmare.
String Concatenation in a Loop (The Classic): Someone built a CSV export by concatenating strings in a loop: result += new_row. With 100K rows, this becomes O(n²) performance because Python creates new string objects every time. The server timeout kicked in after 30 seconds. Fixed with ''.join(rows) - brought it down to 2 seconds.
Import-Time Computation Hell: A genius put a 10-second API call at module level. Every time we imported that module, our app froze for 10 seconds. Lambda cold starts became 15-second nightmares with timeout errors like "Task timed out after 15.03 seconds". Move expensive shit inside functions, not at import time.
The Django Debug Mode Disaster: Left DEBUG = True in production. Django keeps every SQL query in memory "for debugging." Memory usage grew linearly with traffic until the server crashed. Always check your Django settings before deploying.