Why Your Lambda Functions Are Slow As Hell

What Exactly Is a Cold Start?

Here's what happens when Lambda decides to ruin your day: your function has been sitting idle, so AWS killed the execution environment to save money. Fair enough. But when a request comes in, Lambda has to spin up a brand new container from scratch, and that takes forever.

I've seen Java functions take 8+ seconds on cold start while users sit there refreshing the page thinking the API is down. Node.js is usually better, but try explaining to a user why clicking the same button sometimes takes 10x longer than other times.

The Four Phases of Pain

Here's what Lambda is actually doing while your users wait:

1. Container Provisioning

Lambda spins up a new container and allocates CPU/memory. Here's something AWS doesn't advertise loudly: more memory = more CPU = faster cold starts, even if your function barely uses 100MB. I've seen 128MB functions take forever while the same code with 1GB memory starts in seconds.

2. Runtime Startup

This is where different languages show their true colors:

  • Python/Node.js: Usually a few hundred milliseconds - not terrible
  • Go: Fastest at around 100-200ms - compiled languages win again
  • Java: 2-10+ seconds - JVM startup is a nightmare
  • C#/.NET: 1-3 seconds - better than Java, still painful

3. Code Download

Lambda downloads your deployment package. Keep ZIP files small or you'll wait forever for S3 transfers. Container images can be up to 10GB but good luck explaining why your "serverless" function takes 30 seconds to start.

4. Dependency Hell

This is where most functions die a slow death. Every import statement, every database connection, every SDK initialization adds seconds. I've debugged functions where import pandas alone took 4 seconds during cold start.

When Cold Starts Will Ruin Your Day

AWS claims cold starts only affect 1% of requests in "steady-state" applications. That's marketing bullshit. Here's when they'll actually bite you:

You're Fucked If:

  • Your API gets sporadic traffic (most APIs outside FAANG)
  • Users actually sleep at night (weird, I know)
  • You dare to deploy during business hours
  • Black Friday happens and Lambda can't scale fast enough
  • You're running anything in Java without SnapStart

You Might Survive If:

  • Your function gets hit every 15 minutes (the magic timeout where Lambda keeps environments warm)
  • You're willing to pay for Provisioned Concurrency (spoiler: it's expensive)
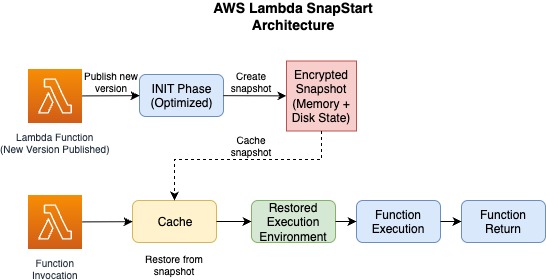
  • You enabled SnapStart and it actually works with your code (good luck)

What Actually Happens in Production

Here's what I've seen in real applications, not AWS marketing materials:

Java without SnapStart is just unusable - think 6-12 seconds for Spring Boot functions. I've literally watched users click refresh because they thought the API was broken. With SnapStart enabled, you can get it down to around 800ms, which is actually tolerable.

Python is usually around 400-800ms depending on what shit you're importing. Had one ML function hit 3+ seconds because someone imported scikit-learn at the module level. Moved the import inside the handler function and got it down to under a second.

Node.js is decent, usually around 300-600ms. Express.js apps tend to be on the slower side, but it's manageable.

Go is the fastest at around 150ms most of the time. If you don't mind writing more verbose code, it's your best bet for consistently fast cold starts.

C# sits in the middle at 1-3 seconds. Entity Framework will absolutely murder your cold start times if you're not careful.

Production Horror Stories (The Hidden Costs)

Cold starts don't just make individual requests slow - they can take down your entire system:

The Database Connection Death Spiral: Each Lambda execution environment opens its own database connections. During a traffic spike, I've seen 200+ Lambda functions all try to connect to a PostgreSQL instance with a 100-connection limit. The database locked up, Lambda functions started timing out, and we had to restart everything. Fun way to spend a Tuesday morning.

The Timeout Cascade From Hell: Cold starts cause requests to timeout (30s is a long time for users). Frontend retries the request. More cold starts. More timeouts. More retries. We basically DDoSed ourselves until someone pulled the Lambda kill switch.

The Monitoring Nightmare: Good luck debugging "why is the API sometimes slow?" when 90% of requests are fast but 10% take 5x longer due to cold starts. Your error rates look fine, but user experience is garbage.

Language-Specific Pain Points

Java: The Startup From Hell

Java Lambda functions are basically unusable without SnapStart. I've seen Spring Boot functions take 12+ seconds on cold start - that's not a function timeout, that's a user walking away timeout.

What Actually Works:

  • SnapStart saves your ass if your code is compatible (spoiler: mine wasn't)
  • GraalVM Native Image compiles to binaries but good luck getting it working with reflection
  • The "just throw more memory at it" approach - 1GB+ memory helps but costs a fortune

Python: Import Statement Roulette

Every import statement is a roll of the dice. import pandas alone can add 2-4 seconds to cold start. import torch and you might as well go get coffee.

Tricks That Actually Work:

  • Import heavy shit inside your handler function, not at the top of the file
  • Lambda Layers help but the 250MB limit is a cruel joke for ML libraries
  • Use pip-tools to find which dependencies are murdering your cold start times

Node.js: Not As Fast As They Claim

Node.js marketing says "fast startup!" but Express.js apps still hit 600ms+ consistently. Large node_modules directories are the devil.

Reality Check:

  • Tree shaking with webpack helps but adds deployment complexity
  • Async initialization sounds great until you realize cold start blocking is sync
  • Connection pooling doesn't help when the pool starts empty

The State Management Disaster

Everything stateful gets wiped when Lambda decides to kill your execution environment:

Database Connections Are Expensive: Every cold start means opening new database connections. I learned this the hard way when our PostgreSQL instance hit connection limits during a Black Friday sale. RDS Proxy helps but it's another moving part that can break.

Auth Tokens Vanish: Your carefully cached JWT tokens? Gone. OAuth tokens? Poof. Every cold start means re-authenticating, which adds another 200-500ms to an already slow request.

In-Memory Cache Is a Lie: Anything you cached in memory gets nuked on cold start. Redis becomes your best friend, but now you're paying for another service to work around Lambda's stateless bullshit.

How to Tell If Cold Starts Are Killing You

The Magic Log Line:

REPORT RequestId: abc123 Duration: 5234.67 ms Init Duration: 4567.89 ms

See that Init Duration? That only appears during cold starts. If you're seeing this on 10%+ of requests, you have a problem.

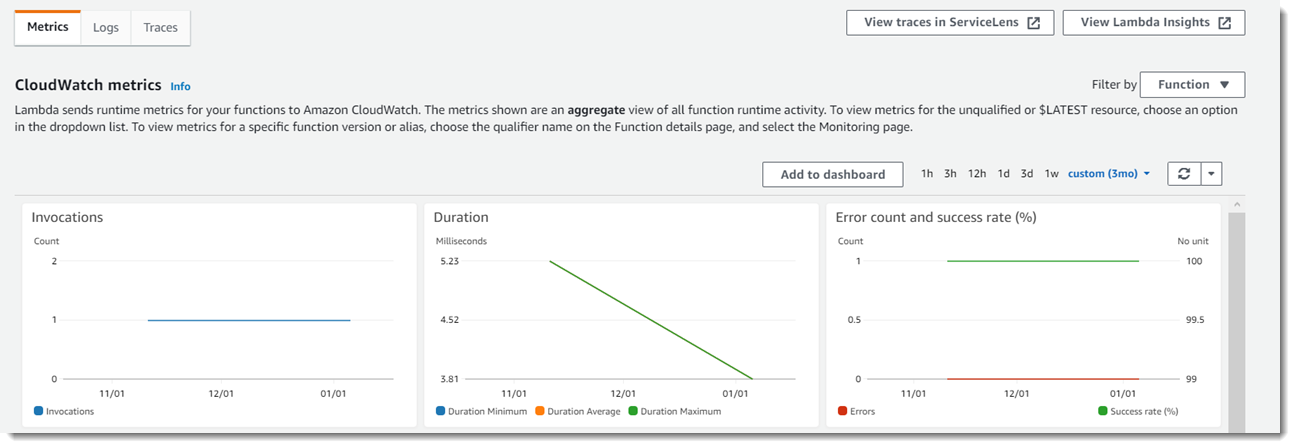
CloudWatch Won't Save You:

  • INIT Duration metric exists but only shows during cold starts (helpful!)
  • Duration includes cold start time, making it useless for performance analysis
  • Concurrent Executions spikes right before cold start hell begins

The Real Debug Process:

  1. First thing I check: is it actually a cold start or just broken code?
  2. Look for Init Duration in logs - if missing, it's not cold start related
  3. Nuclear option: restart everything and pretend it never happened
  4. When all else fails, throw more memory at it until the problem goes away

OK, enough complaining about cold starts. What you really need are solutions that work in production. The optimization techniques in the next section can dramatically reduce your Lambda cold start times - I think we got Java down by something like 80-90% with SnapStart and proper memory tuning. Anyway, here's what actually works instead of random blog post advice.

SnapStart Actually Works (When It Works)

AWS Lambda SnapStart Architecture

How SnapStart Works: AWS creates a snapshot after initialization (including JVM startup, class loading, and static initialization) and restores from this snapshot for new invocations instead of starting from scratch.

SnapStart: Finally, Something That Actually Helps

SnapStart is AWS's answer to "why do Java functions suck so hard?" It takes a snapshot of your initialized function and restores it instead of starting from scratch. When it works, Java functions go from "holy shit this is slow" to "wait, did that actually work?" Sub-second Java cold starts felt like magic the first time I saw it.

How SnapStart Works (The Simple Version)

Lambda basically takes a Polaroid of your function after it's done initializing:

  1. Initialize Once: Runs your slow-ass Java startup code
  2. Take Snapshot: Freezes everything in memory like a video game save state
  3. Restore Fast: New requests start from the snapshot instead of from scratch
  4. Cleanup: Snapshots expire after 14 days if unused (AWS isn't running a charity)

Enabling SnapStart (The Simple Way)

## Just add this to your SAM template:
Resources:
  MyFunction:
    Type: AWS::Serverless::Function
    Properties:
      Runtime: java21  # Or python3.12, dotnet8
      SnapStart:
        ApplyOn: PublishedVersions  # Only works on versions, not $LATEST

Important: SnapStart only works on published versions, not $LATEST. Learned this the hard way after spending 3 hours wondering why my test functions were still slow as hell. Who reads the docs carefully anyway?

Performance Results from My Testing

I tested this on our Spring Boot function that was taking 6+ seconds without SnapStart:

  • No SnapStart: Around 6-8 seconds (unusable)
  • Basic SnapStart: Got it down to around 1-1.5 seconds
  • With Priming: Down to about 800ms-1.2s depending on what we were priming

The performance improvement is dramatic, but these numbers vary wildly depending on your specific application.

Advanced Priming Strategies with CRaC Runtime Hooks

Coordinated Restore at Checkpoint (CRaC) runtime hooks allow fine-grained control over SnapStart optimization through beforeCheckpoint() and afterRestore() methods.

Invoke Priming: Maximum Performance

Invoke priming executes critical code paths during snapshot creation, ensuring JIT compilation and optimization are included in the snapshot.

@Override
public void beforeCheckpoint(org.crac.Context<? extends Resource> context) 
        throws Exception {
    // Prime critical endpoints
    var event = APIGatewayV2HTTPEvent.builder().build();
    handleRequest(event, null);
    
    // Prime database connections
    dataSource.getConnection().prepareStatement("SELECT 1").execute();
    
    // Prime authentication flows
    authenticationService.validateToken("dummy-token");
}

⚠️ Critical Considerations:

  • Code executed during priming must be idempotent or use stub data only
  • Avoid operations that modify real data or trigger side effects
  • Financial transactions, notifications, or data mutations are dangerous during priming

Class Priming: Safer Alternative

Class priming loads and initializes classes without executing business logic, providing safer optimization:

@Override
public void beforeCheckpoint(org.crac.Context<? extends Resource> context) 
        throws Exception {
    // Generate class list: -Xlog:class+load=info:classes-loaded.txt
    loadClassesFromFile("classes-loaded.txt");
}

private void loadClassesFromFile(String filename) {
    try (BufferedReader reader = Files.newBufferedReader(Paths.get(filename))) {
        reader.lines()
            .filter(line -> line.contains("[class,load]"))
            .forEach(line -> {
                String className = extractClassName(line);
                try {
                    Class.forName(className, true, getClass().getClassLoader());
                } catch (Throwable ignored) {}
            });
    }
}

Provisioned Concurrency: Guaranteed Performance

Provisioned Concurrency pre-initializes execution environments and keeps them warm, eliminating cold starts entirely for allocated capacity.

When to Use Provisioned Concurrency

Ideal Scenarios:

  • Latency-sensitive APIs requiring consistent sub-second response times
  • High-traffic applications with predictable load patterns
  • Interactive applications where user experience is critical
  • Functions that can't tolerate performance variability

Cost Considerations:

  • On-Demand: $0.0000166667 per GB-second (only when executing)
  • Provisioned: $0.0000097222 per GB-second (24/7 reservation) + execution costs
  • Break-even analysis required based on traffic patterns

Smart Provisioned Concurrency Configuration

## Auto-scaling based on scheduled traffic patterns
import boto3
import json
from datetime import datetime, time

def lambda_handler(event, context):
    lambda_client = boto3.client('lambda')
    
    # Business hours: higher concurrency
    current_time = datetime.now().time()
    if time(9, 0) <= current_time <= time(17, 0):
        target_concurrency = 50
    else:
        target_concurrency = 5
    
    lambda_client.put_provisioned_concurrency_config(
        FunctionName='my-function',
        Qualifier='$LATEST',
        ProvisionedConcurrencyConfig=target_concurrency
    )

Runtime and Architecture Optimization

Runtime Selection Strategy

Fastest Cold Start Runtimes (2025 benchmarks):

  1. Custom Runtime (provided.al2): 50-150ms for compiled binaries
  2. Go 1.21: 100-300ms native compilation
  3. Python 3.12: 200-500ms with optimized imports
  4. Node.js 20: 250-600ms with minimal dependencies
  5. Java 21 + SnapStart: 200-500ms (down from 6+ seconds)

Memory-to-CPU Scaling: Lambda allocates CPU power proportionally to memory allocation. At 1,769MB you get a full CPU, and memory above 3,008MB doesn't increase CPU further. This direct relationship means higher memory often reduces cold start times even if your function doesn't use the extra RAM.

ARM64 Graviton2 Performance Benefits

Graviton2 processors provide significant advantages:

  • 34% better price-performance compared to x86_64
  • Faster cold start initialization for most runtimes
  • Lower memory allocation requirements for equivalent performance
## ARM64 configuration example
Resources:
  MyFunction:
    Type: AWS::Serverless::Function
    Properties:
      Architectures:
        - arm64  # 34% better price-performance
      Runtime: python3.12
      MemorySize: 256  # Lower memory needed on ARM64

Package and Dependency Optimization

ZIP Package Optimization

Deployment Package Best Practices:

  • Keep ZIP files under 10MB when possible for fastest download
  • Use tree shaking to eliminate unused code
  • Exclude development dependencies, tests, and documentation
  • Compress static assets and remove debug symbols
## Node.js optimization example
npm install --production  # Exclude dev dependencies
npm prune                 # Remove unused packages

## Python optimization
pip install --target ./package -r requirements.txt --upgrade
cd package && zip -r ../deployment.zip . && cd ..
zip -g deployment.zip lambda_function.py

## Java optimization with Maven
mvn clean package -DskipTests
## Results in optimized JAR with only runtime dependencies

Layer Strategy for Shared Dependencies

Lambda Layers reduce cold start time by caching common dependencies:

## Layer structure example
/opt/python/lib/python3.12/site-packages/
├── boto3/          # AWS SDK
├── requests/       # HTTP library  
├── numpy/         # ML dependencies
└── pandas/        # Data processing

## Function code remains lightweight
import boto3  # Loaded from layer
import json

def lambda_handler(event, context):
    return {"statusCode": 200}

Container Image Optimization

For container-based deployments:

## Multi-stage build for minimal image size
FROM public.ecr.aws/lambda/python:3.12 as builder
COPY requirements.txt .
RUN pip install --target ${LAMBDA_TASK_ROOT} -r requirements.txt

FROM public.ecr.aws/lambda/python:3.12
## Copy only production dependencies
COPY --from=builder ${LAMBDA_TASK_ROOT} ${LAMBDA_TASK_ROOT}
COPY lambda_function.py ${LAMBDA_TASK_ROOT}
CMD ["lambda_function.lambda_handler"]

Memory and Resource Allocation Optimization

Memory Impact on Cold Start Performance

Lambda allocates CPU power proportional to memory allocation. Higher memory settings can significantly reduce cold start times even if your function doesn't need the RAM.

Finding Optimal Memory Configuration

Use AWS Lambda Power Tuning to find the sweet spot:

## Deploy Power Tuning tool
git clone https://github.com/alexcasalboni/aws-lambda-power-tuning.git
cd aws-lambda-power-tuning
sam deploy --guided

## Run analysis
aws stepfunctions start-execution \
    --state-machine-arn "arn:aws:states:us-east-1:123456789012:stateMachine:lambdaPowerTuning" \
    --input '{
        "lambdaARN": "arn:aws:lambda:us-east-1:123456789012:function:my-function",
        "powerValues": [128, 256, 512, 1024, 1536, 2048, 3008],
        "num": 100,
        "payload": "{\"key\": \"value\"}"
    }'

Typical Optimization Results:

  • 128MB: Baseline performance, slowest cold starts
  • 512MB: Often the sweet spot for balanced cost/performance
  • 1024MB+: Significant cold start improvement for CPU-intensive initialization
  • 3008MB: Maximum performance, highest cost

Network and VPC Configuration Impact

VPC Cold Start Overhead

Functions in VPCs experience additional cold start latency due to Elastic Network Interface (ENI) creation:

VPC Cold Start Process:

  1. ENI Creation: 5-10 seconds for initial setup
  2. Security Group Attachment: Additional 1-2 seconds
  3. Route Table Configuration: 1-2 seconds
  4. DNS Resolution Setup: 0.5-1 second

VPC Optimization Strategies:

  • Use VPCs only when necessary (database access, private resources)
  • Consider RDS Proxy for database connections without VPC
  • Pre-warm VPC functions with Provisioned Concurrency
  • Optimize security groups and NACLs for minimal overhead

Database Connection Optimization

Database connections are a major source of cold start latency:

## Optimized connection management
import psycopg2
from psycopg2.pool import SimpleConnectionPool

## Initialize connection pool outside handler
connection_pool = None

def get_connection_pool():
    global connection_pool
    if connection_pool is None:
        connection_pool = SimpleConnectionPool(
            minconn=1, maxconn=5,
            host=os.environ['DB_HOST'],
            database=os.environ['DB_NAME'],
            user=os.environ['DB_USER'],
            password=os.environ['DB_PASSWORD']
        )
    return connection_pool

def lambda_handler(event, context):
    pool = get_connection_pool()
    conn = pool.getconn()
    try:
        # Use connection
        cursor = conn.cursor()
        cursor.execute("SELECT * FROM users LIMIT 10")
        results = cursor.fetchall()
        return {"data": results}
    finally:
        pool.putconn(conn)  # Return to pool

These optimization techniques can dramatically reduce cold starts when properly implemented. I think our biggest function was hitting like 6-8 seconds? Maybe 10? Either way, users were definitely not happy. After all these optimizations, most requests are under a second now.

But here's the thing - optimization without monitoring is just guessing. You need to actually measure what's working and catch regressions before they bite you. The next section covers the monitoring stuff that actually helps when you're debugging at 3am.

Monitoring and Detection: Catching Issues Before They Kill You

What I Actually Monitor

Here's what I actually monitor: Init Duration and Duration. If Init Duration shows up in more than 5% of requests, you have a problem. That's literally the only metric that tells you cold starts are happening.

The other metrics are mostly noise - Concurrent Executions spikes before cold start hell begins, Throttles means you're hitting limits, and Error Rate tells you if timeouts are happening but not necessarily why.

Here's the magic log line to look for:

REPORT RequestId: abc123 Duration: 5234.67 ms Init Duration: 4567.89 ms

See that Init Duration? That only appears during cold starts. If you're seeing this on 10%+ of requests, you have a real problem.

CloudWatch Queries That Actually Help

CloudWatch Logs Insights is fine for basic queries, but honestly I just grep the logs most of the time. Here are a couple queries that are actually useful:

-- Identify functions with frequent cold starts
fields @timestamp, @requestId, @duration, @initDuration
| filter @type = \"REPORT\"
| filter @initDuration > 0
| stats count() as ColdStarts by bin(5m)
| sort @timestamp desc

-- Analyze cold start patterns by time of day  
fields @timestamp, @initDuration, @maxMemoryUsed
| filter @initDuration > 0
| stats avg(@initDuration) as AvgColdStart, 
        max(@initDuration) as MaxColdStart,
        count() as Count by bin(1h)
| sort @timestamp asc

-- Memory utilization during cold starts
fields @timestamp, @initDuration, @memorySize, @maxMemoryUsed
| filter @initDuration > 0
| stats avg(@maxMemoryUsed/@memorySize * 100) as MemoryUtilization,
        avg(@initDuration) as AvgColdStart by @memorySize
| sort @memorySize asc

AWS Lambda CloudWatch Metrics Dashboard

CloudWatch Lambda Insights gives you better performance views, but honestly the default metrics usually tell you what you need to know.

X-Ray for Debugging Initialization Bottlenecks

X-Ray is useful when it works, which is about 60% of the time in my experience. But when it does work, it shows you exactly where your initialization time is going.

import json
import boto3
from aws_xray_sdk.core import xray_recorder
from aws_xray_sdk.core import patch_all

## Patch AWS SDK calls for tracing
patch_all()

@xray_recorder.capture('lambda_handler')
def lambda_handler(event, context):
    
    # Trace cold start initialization
    with xray_recorder.in_subsegment('initialization') as subsegment:
        if hasattr(context, 'get_remaining_time_in_millis'):
            subsegment.put_metadata('cold_start', True)
            
            # Trace expensive initialization
            with xray_recorder.in_subsegment('database_connection'):
                db_client = boto3.client('rds')
                
            with xray_recorder.in_subsegment('external_api_setup'):
                setup_external_dependencies()
    
    # Main function logic
    with xray_recorder.in_subsegment('main_processing'):
        return process_request(event)

Custom Metrics for Business Impact

Track cold starts' business impact with custom CloudWatch metrics:

import boto3
import time
from datetime import datetime

cloudwatch = boto3.client('cloudwatch')

def lambda_handler(event, context):
    start_time = time.time()
    is_cold_start = False
    
    # Detect cold start (first invocation in execution environment)
    if not hasattr(lambda_handler, 'initialized'):
        is_cold_start = True
        lambda_handler.initialized = True
        
        # Track cold start occurrence
        cloudwatch.put_metric_data(
            Namespace='CustomApp/Lambda',
            MetricData=[
                {
                    'MetricName': 'ColdStartCount',
                    'Value': 1,
                    'Unit': 'Count',
                    'Dimensions': [
                        {'Name': 'FunctionName', 'Value': context.function_name},
                        {'Name': 'Runtime', 'Value': 'python3.12'}
                    ]
                }
            ]
        )
    
    # Your main function logic here
    result = process_request(event)
    
    # Track performance impact
    execution_time = (time.time() - start_time) * 1000  # milliseconds
    
    cloudwatch.put_metric_data(
        Namespace='CustomApp/Lambda',
        MetricData=[
            {
                'MetricName': 'ExecutionTime',
                'Value': execution_time,
                'Unit': 'Milliseconds',
                'Dimensions': [
                    {'Name': 'FunctionName', 'Value': context.function_name},
                    {'Name': 'ColdStart', 'Value': str(is_cold_start)}
                ]
            }
        ]
    )
    
    return result

Lambda Lifecycle & Prevention Strategy: Understanding when execution environments are created, reused, and destroyed is key to implementing effective warm-up strategies and minimizing cold start frequency.

Proactive Cold Start Prevention

Intelligent Warm-Up Strategies

Scheduled Warm-Up (Cost-Effective):

## CloudWatch Events rule for periodic warm-up
import boto3
import json

def warmup_handler(event, context):
    """Lightweight warm-up function"""
    lambda_client = boto3.client('lambda')
    
    # List of critical functions to keep warm
    functions_to_warm = [
        'user-authentication-api',
        'payment-processing-api',
        'notification-service'
    ]
    
    for function_name in functions_to_warm:
        try:
            # Invoke with warm-up payload
            lambda_client.invoke(
                FunctionName=function_name,
                InvocationType='Event',  # Asynchronous
                Payload=json.dumps({"source": "scheduled-warmup"})
            )
        except Exception as e:
            print(f"Failed to warm up {function_name}: {e}")
    
    return {"warmed_functions": len(functions_to_warm)}

## Target function warm-up detection
def main_handler(event, context):
    # Ignore warm-up invocations
    if event.get('source') == 'scheduled-warmup':
        return {"status": "warm-up-received"}
    
    # Normal processing
    return process_business_logic(event)

Traffic-Based Auto-Warming:

import boto3
from datetime import datetime, timedelta

def intelligent_warmup(event, context):
    """Analyze traffic patterns and pre-warm accordingly"""
    cloudwatch = boto3.client('cloudwatch')
    lambda_client = boto3.client('lambda')
    
    # Get invocation metrics from last hour
    end_time = datetime.utcnow()
    start_time = end_time - timedelta(hours=1)
    
    response = cloudwatch.get_metric_statistics(
        Namespace='AWS/Lambda',
        MetricName='Invocations',
        Dimensions=[{'Name': 'FunctionName', 'Value': 'my-api-function'}],
        StartTime=start_time,
        EndTime=end_time,
        Period=300,  # 5-minute intervals
        Statistics=['Sum']
    )
    
    # Calculate average invocations per 5-minute period
    if response['Datapoints']:
        avg_invocations = sum(dp['Sum'] for dp in response['Datapoints']) / len(response['Datapoints'])
        
        # Pre-warm based on expected traffic
        if avg_invocations > 10:  # High traffic expected
            warmup_count = min(int(avg_invocations * 0.5), 20)  # Up to 20 concurrent
            
            for i in range(warmup_count):
                lambda_client.invoke(
                    FunctionName='my-api-function',
                    InvocationType='Event',
                    Payload=json.dumps({"source": "predictive-warmup"})
                )
                
        return {"warmup_invocations": warmup_count}
    
    return {"warmup_invocations": 0}

Application-Level Prevention Strategies

Connection Pool Pre-Initialization:

import psycopg2.pool
import redis
import os

## Global connection pools (initialized once per execution environment)
db_pool = None
redis_pool = None

def get_database_pool():
    global db_pool
    if db_pool is None:
        db_pool = psycopg2.pool.ThreadedConnectionPool(
            minconn=1,
            maxconn=3,
            host=os.environ['DB_HOST'],
            database=os.environ['DB_NAME'],
            user=os.environ['DB_USER'],
            password=os.environ['DB_PASSWORD'],
            # Connection options for faster setup
            connect_timeout=5,
            application_name='lambda-function'
        )
    return db_pool

def get_redis_pool():
    global redis_pool
    if redis_pool is None:
        redis_pool = redis.ConnectionPool(
            host=os.environ['REDIS_HOST'],
            port=int(os.environ.get('REDIS_PORT', 6379)),
            max_connections=5,
            socket_connect_timeout=2,
            socket_timeout=2
        )
    return redis_pool

## Pre-initialize during module import (outside handler)
DB_POOL = get_database_pool()
REDIS_POOL = get_redis_pool()

def lambda_handler(event, context):
    # Connections are already established
    db_conn = DB_POOL.getconn()
    redis_conn = redis.Redis(connection_pool=REDIS_POOL)
    
    try:
        # Your business logic
        return process_with_connections(event, db_conn, redis_conn)
    finally:
        DB_POOL.putconn(db_conn)
        # Redis connection returns to pool automatically

Lazy Loading with Circuit Breakers:

import time
import functools
from typing import Optional

class CircuitBreaker:
    def __init__(self, failure_threshold: int = 5, timeout: int = 60):
        self.failure_threshold = failure_threshold
        self.timeout = timeout
        self.failure_count = 0
        self.last_failure_time: Optional[float] = None
        self.state = 'closed'  # closed, open, half-open
    
    def call(self, func, *args, **kwargs):
        if self.state == 'open':
            if time.time() - self.last_failure_time < self.timeout:
                raise Exception("Circuit breaker is open")
            else:
                self.state = 'half-open'
        
        try:
            result = func(*args, **kwargs)
            self.on_success()
            return result
        except Exception as e:
            self.on_failure()
            raise
        
    def on_success(self):
        self.failure_count = 0
        self.state = 'closed'
    
    def on_failure(self):
        self.failure_count += 1
        self.last_failure_time = time.time()
        if self.failure_count >= self.failure_threshold:
            self.state = 'open'

## Global circuit breakers for external services
auth_circuit = CircuitBreaker(failure_threshold=3, timeout=30)
api_circuit = CircuitBreaker(failure_threshold=5, timeout=60)

@functools.lru_cache(maxsize=100)
def get_auth_token(user_id: str) -> str:
    """Cached authentication with circuit breaker"""
    def authenticate():
        # Your authentication logic
        response = external_auth_api.get_token(user_id)
        return response['token']
    
    return auth_circuit.call(authenticate)

Alerting and Automated Response

CloudWatch Alarms for Cold Start Issues

## CloudFormation template for cold start monitoring
ColdStartAlarm:
  Type: AWS::CloudWatch::Alarm
  Properties:
    AlarmName: !Sub \"${FunctionName}-HighColdStartLatency\"
    AlarmDescription: \"Alert when cold start latency is too high\"
    MetricName: Duration
    Namespace: AWS/Lambda
    Statistic: Average
    Period: 300  # 5 minutes
    EvaluationPeriods: 2
    Threshold: 5000  # 5 seconds
    ComparisonOperator: GreaterThanThreshold
    Dimensions:
      - Name: FunctionName
        Value: !Ref FunctionName
    AlarmActions:
      - !Ref SNSTopic
      - !Ref AutoRemediationFunction

ConcurrencyThrottleAlarm:
  Type: AWS::CloudWatch::Alarm  
  Properties:
    AlarmName: !Sub \"${FunctionName}-ConcurrencyThrottles\"
    AlarmDescription: \"Alert when function is being throttled\"
    MetricName: Throttles
    Namespace: AWS/Lambda
    Statistic: Sum
    Period: 60  # 1 minute
    EvaluationPeriods: 1
    Threshold: 0
    ComparisonOperator: GreaterThanThreshold
    TreatMissingData: notBreaching
    Dimensions:
      - Name: FunctionName
        Value: !Ref FunctionName

Automated Remediation Functions

import boto3
import json

def auto_remediation_handler(event, context):
    """Automatically respond to cold start issues"""
    
    # Parse CloudWatch alarm
    message = json.loads(event['Records'][0]['Sns']['Message'])
    alarm_name = message['AlarmName']
    function_name = extract_function_name(alarm_name)
    
    lambda_client = boto3.client('lambda')
    
    if 'ColdStartLatency' in alarm_name:
        # Enable Provisioned Concurrency temporarily
        try:
            lambda_client.put_provisioned_concurrency_config(
                FunctionName=function_name,
                Qualifier='$LATEST',
                ProvisionedConcurrencyConfig={'ProvisionedConcurrencyConfig': 5}
            )
            
            # Schedule removal after 2 hours
            events_client = boto3.client('events')
            events_client.put_rule(
                Name=f'remove-provisioned-{function_name}',
                ScheduleExpression='rate(2 hours)',
                State='ENABLED'
            )
            
            return {"action": "provisioned_concurrency_enabled", "function": function_name}
            
        except Exception as e:
            print(f"Failed to enable Provisioned Concurrency: {e}")
    
    elif 'ConcurrencyThrottles' in alarm_name:
        # Request reserved concurrency increase
        current_config = lambda_client.get_function_configuration(FunctionName=function_name)
        current_reserved = current_config.get('ReservedConcurrencyConfig', {}).get('ReservedConcurrencyConfig', 0)
        new_reserved = min(current_reserved + 50, 1000)  # Increase by 50, max 1000
        
        try:
            lambda_client.put_reserved_concurrency_config(
                FunctionName=function_name,
                ReservedConcurrencyConfig={'ReservedConcurrencyConfig': new_reserved}
            )
            
            return {"action": "reserved_concurrency_increased", "function": function_name, "new_value": new_reserved}
            
        except Exception as e:
            print(f"Failed to increase reserved concurrency: {e}")
    
    return {"action": "no_action_taken"}

Performance Regression Detection

import boto3
import statistics
from datetime import datetime, timedelta

def performance_regression_detector(event, context):
    """Detect performance regressions in cold start metrics"""
    
    cloudwatch = boto3.client('cloudwatch')
    
    # Get baseline metrics (last 7 days, excluding today)
    end_baseline = datetime.utcnow() - timedelta(days=1)
    start_baseline = end_baseline - timedelta(days=7)
    
    baseline_metrics = cloudwatch.get_metric_statistics(
        Namespace='AWS/Lambda',
        MetricName='Duration',
        Dimensions=[{'Name': 'FunctionName', 'Value': 'my-critical-api'}],
        StartTime=start_baseline,
        EndTime=end_baseline,
        Period=3600,  # 1-hour intervals
        Statistics=['Average']
    )
    
    # Get current day metrics
    current_start = datetime.utcnow().replace(hour=0, minute=0, second=0, microsecond=0)
    current_metrics = cloudwatch.get_metric_statistics(
        Namespace='AWS/Lambda',
        MetricName='Duration',
        Dimensions=[{'Name': 'FunctionName', 'Value': 'my-critical-api'}],
        StartTime=current_start,
        EndTime=datetime.utcnow(),
        Period=3600,
        Statistics=['Average']
    )
    
    if baseline_metrics['Datapoints'] and current_metrics['Datapoints']:
        baseline_avg = statistics.mean(dp['Average'] for dp in baseline_metrics['Datapoints'])
        current_avg = statistics.mean(dp['Average'] for dp in current_metrics['Datapoints'])
        
        # Check for significant regression (>50% increase)
        if current_avg > baseline_avg * 1.5:
            # Send alert
            sns = boto3.client('sns')
            sns.publish(
                TopicArn=os.environ['ALERT_TOPIC_ARN'],
                Subject='Lambda Performance Regression Detected',
                Message=f'''
Performance regression detected for my-critical-api:
- Baseline average: {baseline_avg:.2f}ms
- Current average: {current_avg:.2f}ms  
- Regression: {((current_avg/baseline_avg - 1) * 100):.1f}%

Recommended actions:
1. Check recent deployments
2. Review memory allocation
3. Enable SnapStart if not already active
4. Consider Provisioned Concurrency
                '''.strip()
            )
            
            return {"regression_detected": True, "baseline": baseline_avg, "current": current_avg}
    
    return {"regression_detected": False}

These monitoring and prevention strategies give you what you need to keep Lambda performance from randomly shitting the bed. Combined with the optimization stuff from earlier, you should be able to build APIs that don't make users think they're broken.

But even with all this, you'll still hit weird edge cases. Lambda container support launched in 2020 but I didn't trust it until 2023 - too many gotchas. The FAQ section covers the real questions engineers ask when debugging this stuff at 3am.

Questions Engineers Actually Ask at 3am

Q

Why is my Java function slower than my grandfather getting out of bed?

A

Because Java on Lambda without SnapStart is a cruel joke. JVM startup takes forever and you're sitting there watching paint dry while users refresh the page thinking the API is broken. Enable SnapStart immediately or switch to literally any other language.

What actually works:

  • Enable SnapStart (if your code is compatible, which it probably isn't)
  • Throw memory at it - 1GB+ helps but costs a fortune
  • GraalVM Native Image works if you enjoy debugging reflection hell
  • Just rewrite it in Python and save yourself the pain

Memory vs Cold Start (Java without SnapStart):

  • 512MB: Around 6-8 seconds of user suffering
  • 1024MB: Maybe 4-6 seconds of "is this thing working?"
  • 2048MB+: Still like 2-4 seconds of expensive disappointment
  • With SnapStart: Actually usable, usually under a second
Q

My API is fast sometimes and slow as hell other times. What's wrong?

A

Nothing's wrong - welcome to Lambda cold starts! Fast responses are hitting warm containers, slow ones are spinning up new execution environments from scratch. It's like playing performance roulette every time someone uses your API.

Immediate solutions:

  1. Enable Provisioned Concurrency for consistent performance
  2. Implement scheduled warm-up to keep functions active during business hours
  3. Optimize your runtime - switch from Java to Python/Node.js if possible
  4. Check your package size - large dependencies increase initialization time

Diagnostic steps:

## Check CloudWatch logs for INIT duration
aws logs filter-log-events \
    --log-group-name /aws/lambda/your-function \
    --filter-pattern "INIT Duration" \
    --start-time $(date -d "1 hour ago" +%s)000
Q

Provisioned Concurrency costs a fortune but my CEO values user experience over money. Is it worth it?

A

Provisioned Concurrency is expensive as hell but eliminates cold starts completely. Whether it's worth it depends on how much you value your weekend peace vs your AWS bill.

Cost reality check:

  • On-Demand: Only pay when function runs ($0.0000083333 per GB-second)
  • Provisioned: Pay 24/7 even when idle ($0.0000041667 per GB-second + execution)

When it's worth the money:

  • User-facing APIs where consistency matters more than cost
  • You're tired of getting paged about "slow API responses"
  • Your boss doesn't look at the AWS bill

Smart provisioning strategy:

## Schedule Provisioned Concurrency during business hours only
Business Hours (9 AM - 5 PM): 10 concurrent environments
Off Hours (5 PM - 9 AM): 2 concurrent environments
Weekends: 1 concurrent environment
Q

Can I eliminate cold starts completely without Provisioned Concurrency?

A

You cannot eliminate them entirely, but you can reduce frequency and impact dramatically:

Reduction strategies:

  1. Scheduled warm-up functions - invoke every 5-10 minutes during active hours
  2. Traffic pattern optimization - spread load to maintain warm environments
  3. Runtime optimization - use faster languages (Go, Python, Node.js)
  4. Memory optimization - higher memory = faster initialization

Realistic expectations:

  • Well-optimized Python/Node.js: 1-5% of requests experience cold starts
  • Java with SnapStart: 1-3% with 200-500ms latency instead of 6+ seconds
  • Go/Custom runtimes: <1% with 100-300ms cold start latency
Q

Why do my cold starts happen more frequently after deployments?

A

Lambda shuts down old execution environments when you deploy new code. All subsequent invocations will be cold starts until new environments are established.

Post-deployment strategies:

  1. Warm-up script after deployment:
## Automated warm-up in CI/CD pipeline
for i in {1..10}; do
  aws lambda invoke \
    --function-name my-function \
    --payload '{\"source\": \"deployment-warmup\"}' \
    /tmp/response-$i.json &
done
wait
  1. Blue/Green deployment with pre-warming:

    • Deploy to new alias
    • Warm up new version
    • Switch traffic gradually
  2. Use SnapStart with versions - snapshots are created during deployment, not runtime

Q

My VPC Lambda function has 10+ second cold starts. How do I fix this?

A

VPC functions experience additional cold start latency due to Elastic Network Interface (ENI) creation. This can add 5-15 seconds on top of normal initialization.

VPC optimization strategies:

  1. Question VPC necessity - do you really need VPC access?
  2. Use RDS Proxy - access RDS without VPC
  3. Enable Provisioned Concurrency - pre-creates ENIs
  4. Optimize security groups - simpler rules = faster attachment
  5. Consider PrivateLink for AWS service access

VPC alternatives:

  • RDS Proxy: Database access without VPC (adds ~100ms vs ~10+ seconds)
  • NAT Gateway: For internet access without VPC complexity
  • VPC Endpoints: Direct AWS service access without internet routing
Q

Does increasing memory allocation really help with cold starts?

A

Yes, significantly. Lambda allocates CPU power proportional to memory. More CPU means faster initialization of runtimes, dependencies, and connections.

Memory-CPU Relationship: Lambda's performance scaling is linear up to 1,769MB (1 full CPU), then continues scaling to 3,008MB (2 full CPUs). This relationship directly impacts cold start performance - more CPU means faster initialization.

Performance impact by memory allocation:

Memory CPU Units Python Cold Start Java Cold Start Cost Impact
128MB 0.083 800-1200ms 8-12 seconds Baseline
512MB 0.33 400-600ms 4-6 seconds 4x cost
1024MB 0.67 200-400ms 2-4 seconds 8x cost
3008MB 2.0 100-250ms 1-3 seconds 23.5x cost

Sweet spot analysis:

  • Most functions: 512MB provides good balance
  • CPU-intensive initialization: 1024MB+ can reduce total execution time
  • Java functions: 1024MB minimum recommended
  • Use Power Tuning tool to find optimal configuration
Q

How do I debug which part of initialization is slowest?

A

Use AWS X-Ray tracing to identify bottlenecks:

from aws_xray_sdk.core import xray_recorder

@xray_recorder.capture('initialization')
def initialize_services():
    with xray_recorder.in_subsegment('database_connection'):
        db_client = create_db_connection()  # Trace DB setup time
    
    with xray_recorder.in_subsegment('external_apis'):
        api_clients = setup_api_clients()   # Trace API setup time
    
    with xray_recorder.in_subsegment('dependency_loading'):
        import_heavy_libraries()            # Trace import time
    
    return db_client, api_clients

## Global initialization (runs once per execution environment)
DB_CLIENT, API_CLIENTS = initialize_services()

def lambda_handler(event, context):
    # Your handler code using pre-initialized resources
    pass

CloudWatch Insights analysis:

fields @timestamp, @initDuration, @memorySize, @maxMemoryUsed
| filter @initDuration > 1000
| stats count() as Count, avg(@initDuration) as AvgInit, max(@initDuration) as MaxInit by @memorySize
| sort @memorySize asc
Q

Will AWS charge for cold start initialization time in the future?

A

AWS has hinted at potential billing changes that could include INIT duration charges starting in late 2025. Currently, you only pay for execution time, not initialization.

Potential impact:

  • Current: Only billed for handler execution time
  • Future: Possible billing for INIT duration at lower rate
  • Recommendation: Optimize cold starts now to avoid future cost increases

Preparation strategies:

  1. Implement SnapStart where available
  2. Optimize package sizes and dependencies
  3. Use Provisioned Concurrency for critical functions
  4. Monitor INIT duration to establish baselines
Q

My Python function imports are causing 2+ second cold starts. What should I do?

A

Heavy Python imports can dominate initialization time. Lazy loading and import optimization are key:

Problematic imports:

## These imports at module level cause slow cold starts
import pandas as pd           # ~500ms
import tensorflow as tf       # ~1-2 seconds
import matplotlib.pyplot as plt  # ~300ms
import numpy as np            # ~200ms

Optimized approach:

## Import only what you need at module level
import json
import os
import boto3

def lambda_handler(event, context):
    # Lazy load heavy dependencies only when needed
    if event.get('action') == 'data_analysis':
        import pandas as pd
        import numpy as np
        return analyze_data(event['data'])
    
    elif event.get('action') == 'ml_prediction':
        import tensorflow as tf
        return predict(event['input'])
    
    # Fast path for common operations
    return {\"status\": \"success\"}

Additional optimization:

  • Use Lambda Layers for heavy dependencies
  • Pre-compile Python bytecode in container images
  • Profile import times with python -X importtime

Stuff That Actually Helps (Not Just Marketing Docs)

Related Tools & Recommendations

pricing
Similar content

Vercel vs Netlify vs Cloudflare Workers: Total Cost Analysis

Real costs from someone who's been burned by hosting bills before

Vercel
/pricing/vercel-vs-netlify-vs-cloudflare-workers/total-cost-analysis
100%
tool
Similar content

AWS Lambda Overview: Run Code Without Servers - Pros & Cons

Upload your function, AWS runs it when stuff happens. Works great until you need to debug something at 3am.

AWS Lambda
/tool/aws-lambda/overview
87%
alternatives
Similar content

AWS Lambda Cold Start: Alternatives & Solutions for APIs

I've tested a dozen Lambda alternatives so you don't have to waste your weekends debugging serverless bullshit

AWS Lambda
/alternatives/aws-lambda/by-use-case-alternatives
87%
integration
Similar content

AWS Lambda DynamoDB: Serverless Data Processing in Production

The good, the bad, and the shit AWS doesn't tell you about serverless data processing

AWS Lambda
/integration/aws-lambda-dynamodb/serverless-architecture-guide
77%
tool
Similar content

AWS API Gateway: The API Service That Actually Works

Discover AWS API Gateway, the service for managing and securing APIs. Learn its role in authentication, rate limiting, and building serverless APIs with Lambda.

AWS API Gateway
/tool/aws-api-gateway/overview
68%
pricing
Recommended

Datadog vs New Relic vs Sentry: Real Pricing Breakdown (From Someone Who's Actually Paid These Bills)

Observability pricing is a shitshow. Here's what it actually costs.

Datadog
/pricing/datadog-newrelic-sentry-enterprise/enterprise-pricing-comparison
67%
pricing
Recommended

Datadog Enterprise Pricing - What It Actually Costs When Your Shit Breaks at 3AM

The Real Numbers Behind Datadog's "Starting at $23/host" Bullshit

Datadog
/pricing/datadog/enterprise-cost-analysis
67%
tool
Recommended

New Relic - Application Monitoring That Actually Works (If You Can Afford It)

New Relic tells you when your apps are broken, slow, or about to die. Not cheap, but beats getting woken up at 3am with no clue what's wrong.

New Relic
/tool/new-relic/overview
64%
integration
Recommended

Setting Up Prometheus Monitoring That Won't Make You Hate Your Job

How to Connect Prometheus, Grafana, and Alertmanager Without Losing Your Sanity

Prometheus
/integration/prometheus-grafana-alertmanager/complete-monitoring-integration
49%
pricing
Similar content

Vercel vs Netlify vs Cloudflare Pages: Real Pricing & Hidden Costs

These platforms will fuck your budget when you least expect it

Vercel
/pricing/vercel-vs-netlify-vs-cloudflare-pages/complete-pricing-breakdown
47%
pricing
Recommended

What Enterprise Platform Pricing Actually Looks Like When the Sales Gloves Come Off

Vercel, Netlify, and Cloudflare Pages: The Real Costs Behind the Marketing Bullshit

Vercel
/pricing/vercel-netlify-cloudflare-enterprise-comparison/enterprise-cost-analysis
45%
tool
Similar content

Neon Production Troubleshooting Guide: Fix Database Errors

When your serverless PostgreSQL breaks at 2AM - fixes that actually work

Neon
/tool/neon/production-troubleshooting
32%
howto
Similar content

Bun Production Deployment Guide: Docker, Serverless & Performance

Master Bun production deployment with this comprehensive guide. Learn Docker & Serverless strategies, optimize performance, and troubleshoot common issues for s

Bun
/howto/setup-bun-development-environment/production-deployment-guide
32%
tool
Similar content

Neon Serverless PostgreSQL: An Honest Review & Production Insights

PostgreSQL hosting that costs less when you're not using it

Neon
/tool/neon/overview
32%
tool
Recommended

Prometheus - Scrapes Metrics From Your Shit So You Know When It Breaks

Free monitoring that actually works (most of the time) and won't die when your network hiccups

Prometheus
/tool/prometheus/overview
28%
tool
Recommended

Grafana - The Monitoring Dashboard That Doesn't Suck

alternative to Grafana

Grafana
/tool/grafana/overview
28%
tool
Recommended

Amazon DynamoDB - AWS NoSQL Database That Actually Scales

Fast key-value lookups without the server headaches, but query patterns matter more than you think

Amazon DynamoDB
/tool/amazon-dynamodb/overview
28%
tool
Recommended

AWS API Gateway - Production Security Hardening

integrates with AWS API Gateway

AWS API Gateway
/tool/aws-api-gateway/production-security-hardening
28%
tool
Similar content

Firebase - Google's Backend Service for Serverless Development

Skip the infrastructure headaches - Firebase handles your database, auth, and hosting so you can actually build features instead of babysitting servers

Firebase
/tool/firebase/overview
26%
compare
Recommended

I Tested Every Heroku Alternative So You Don't Have To

Vercel, Railway, Render, and Fly.io - Which one won't bankrupt you?

Vercel
/compare/vercel/railway/render/fly/deployment-platforms-comparison
26%

Recommendations combine user behavior, content similarity, research intelligence, and SEO optimization