Valgrind hijacks your program and runs it in a simulation - that's why it's so damn slow. It watches every single memory operation but catches bugs that would otherwise make you want to switch careers.
So here's the deal with how this thing actually works
When you run your program under Valgrind, your executable never actually touches the CPU directly. What happens is your code gets completely torn apart and rebuilt - first it disassembles everything into this intermediate representation called VEX IR (basically assembly language for people who hate themselves), then it injects tracking code around every single memory operation (this is the part that makes it so fucking slow), re-compiles the whole mess back to machine code, and then watches literally everything your program does - every memory read, write, malloc, free, you name it.
This dynamic binary instrumentation approach is why Valgrind can catch sneaky bugs like reading uninitialized memory or accessing freed pointers that would take you hours to debug manually. It's also why your test suite that normally runs in 2 minutes now takes an hour.
Look, Valgrind has seven tools but you'll probably only use three
Memcheck is the big one - this is what people mean when they say "run it under Valgrind." It catches memory leaks, buffer overflows, use-after-free, all that shit that makes your program crash at the worst possible moment. I've literally caught double-frees that only happened when the garbage collector ran during a full moon.
Cachegrind is for when your manager asks why the app is "slow" but can't give you any actual metrics. It simulates CPU caches and tells you what's actually bottlenecking - turns out your "optimized" code is cache-missing like crazy.
Callgrind does the same thing but spits out call graphs you can visualize with KCachegrind. Great for making pretty charts that explain to management why their feature request would tank performance.
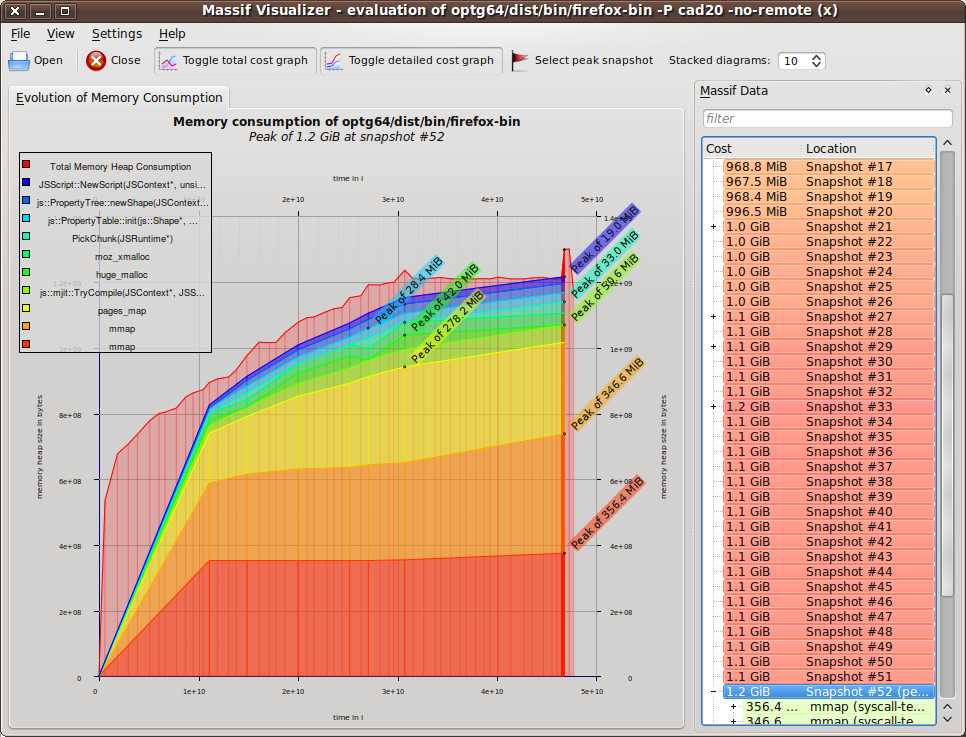
Massif tracks heap usage over time. Use it when your program starts fine but slowly devours all 32GB of RAM over the course of a day and you have no fucking clue why.
The threading tools - Helgrind and DRD - are for race conditions. Your multithreaded code works perfectly on your laptop but becomes a smoldering crater on the production server with 48 cores? Yeah, these'll find the race you missed. Pick either one, the differences only matter to threading nerds.
DHAT is like Massif but with more detail than anyone actually needs. Unless you're the type of person who needs to know exactly which 73 bytes are being allocated in function foo() at line 847, just use Massif.
Platform Support (And Where It Doesn't Work)
Valgrind officially supports way too many platforms including most Linux variants, FreeBSD, Solaris, and Intel macOS.
Linux: Works great everywhere. Needs kernel 3.0+ and glibc 2.5+, but if you're running anything from this decade you're fine.
macOS Intel: Requires macOS 10.9+. Works, but can be finicky with system library interactions.
Apple Silicon Macs: Basically broken. Apple's security circus and ARM64 switch broke everything. Valgrind 3.25.1 technically supports M1/M2 but crashes on anything interesting. Save yourself the weekend debugging session and use Intel hardware or AddressSanitizer.
Windows: Officially unsupported. Valgrind's Windows port was such a clusterfuck they gave up. Use Dr. Memory instead - it was built for Windows because Valgrind couldn't handle Microsoft's special brand of insanity.