What React Developer Tools Actually Is (And Why You Need It)

Stop debugging React with console.log(this.props) like it's 2005. React Developer Tools is Meta's browser extension that actually shows you what's happening in your components without turning your console into a graveyard of forgotten debug statements.

I used to spend hours adding console.log(this.props) everywhere, forgetting to remove half of them, and shipping them to production where AWS was charging us like $180-ish/month just for my debug spam. You probably did the same shit. React DevTools shows you exactly what's broken without cluttering your code with debug statements you'll inevitably forget to clean up.

The official browser extension adds two tabs to DevTools: Components and Profiler. Install it from Chrome, Firefox, or Edge and thank me later.

The Components Tab: See What's Actually Happening

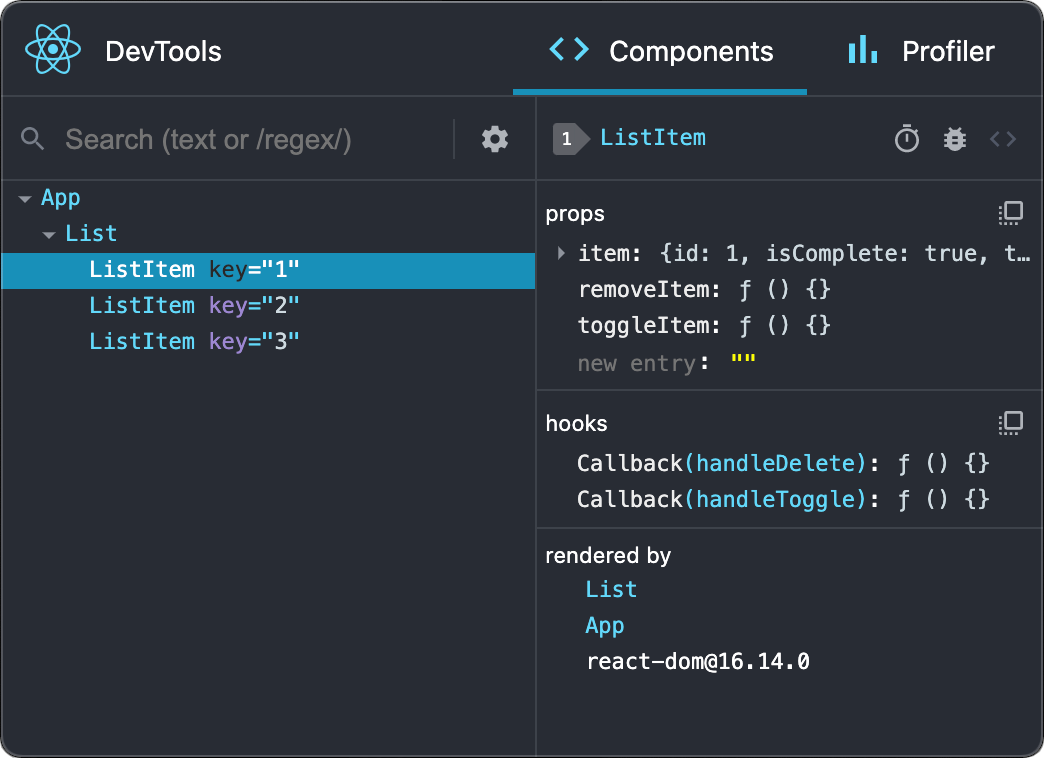
The Components tab shows your React component tree exactly like React sees it. Click any component and boom - you see its props, state, hooks, everything. No more wondering why UserProfile is broken because you can literally see what props got passed to it.

React Developer Tools Components Tab Interface

Here's the magic: you can edit props and state directly. Click on any value and change it. No code changes, no rebuilds, no refresh. Toggle isLoading to true, change that API response, break things on purpose to see what happens. This live editing feature saved my ass when debugging a checkout flow where the "Buy Now" button wasn't working - turns out isEnabled was getting passed as a string "false" instead of boolean false.

Real example: I spent like 4 hours one Friday debugging why our UserCard component wouldn't render - just blank space where the card should be, no errors in console, no clues. Spent most of that time adding console logs everywhere like an idiot before finally opening DevTools. Took me another 20 minutes of clicking around before I noticed user.isActive was undefined instead of the boolean I expected. Turns out the API was returning user: { id: 123, name: "John" } but missing the isActive field entirely because of some backend schema change nobody told us about. Could've saved my entire weekend if I wasn't too stubborn to open DevTools first.

The Profiler: Find What's Slow as Hell

React Profiler Flame Chart

The Profiler tab shows you which components are slow. That's it. Longer bars = slower components. Look for the longest bars and those are your problems.

React DevTools Profiler Interface

Found a component creating new Date() objects on every render? The profiler will show it. Components re-rendering 47 times per click? The profiler catches that too. I've seen apps where the ProductList component was calling new Date() in the render function - every single render created a new date object. The profiler made it obvious with a giant red bar screaming "THIS IS YOUR PROBLEM."

The "why did this render?" info is gold. It tells you exactly what changed to trigger the re-render. If you see a component rendering because of props that didn't actually change, you've found an optimization opportunity. React's rendering behavior makes more sense when you can see it happening live.

Installation: 30 Seconds or 30 Minutes

Available for Chrome, Firefox, and Edge. Safari users get screwed and have to use the standalone version.

Installation takes 30 seconds unless Chrome decides to be weird:

  1. Go to your browser's extension store, search "React Developer Tools"
  2. Click install and pray the store doesn't hang
  3. Open DevTools (F12) on any React app
  4. Look for the "Components ⚛️" and "Profiler ⚛️" tabs

If you don't see the React tabs, either the site isn't using React, you're looking at a production build, or Chrome extensions randomly broke again. Production builds strip out debugging info for performance, which is smart but annoying when you're trying to debug staging.

React Native: Same Pain, Mobile Edition

React Native DevTools works the same way for mobile apps. Same component tree, same profiler, same prop editing. The difference? You have to connect through the Metro bundler and your phone will randomly disconnect right when you're in the middle of debugging a critical production issue.

React Native 0.76+ has built-in DevTools integration that actually works most of the time. Earlier versions require the standalone version (npm install -g react-devtools) and some device menu shaking. Connection issues? Welcome to mobile development hell - restart Metro, shake your device until the dev menu appears, check that your phone and laptop are on the same WiFi network, restart the packager, clear the React Native cache with npx react-native start --reset-cache, sacrifice a goat, whatever works.

Why Console Logging Sucks

Stop adding console.log(props) to components. Just stop. You'll forget to remove them, ship them to production, and your team will judge you. ESLint can catch them, but you shouldn't need a linter to remind you not to debug like it's 2005.

React DevTools shows you props, state, hooks, and data flow without touching your code. No refreshes, no cleanup, no "oh shit I forgot to remove the console logs" moments. This is how React's creators intended you to debug - use their tool.

Production Debugging: You Don't

In production, React strips out debugging info for performance and security. Enabling DevTools in production would expose your app's internals to users and slow everything down.

Set up staging environments that mirror production but keep debugging enabled. For actual production bugs, use error tracking like Sentry or LogRocket. Don't try to debug live production with DevTools - that way lies madness.

Version Compatibility: Usually Fine

React 18, 19, hooks, server components, concurrent features - DevTools keeps up. The Meta team updates it regularly because they dogfood their own tools.

React 18 gotcha: Strict Mode makes components render twice in development, which makes the profiler timing look weird. That's expected behavior, not a bug.

Works With Everything (Probably)

Create React App, Next.js, Vite, custom Webpack configs - if it runs React in development mode, DevTools will work. TypeScript? Obviously supported. The extension reads TypeScript types and shows better prop information than plain JavaScript.

Bottom Line

Just install it. Every React developer has this extension. Debugging React without it is like coding with one hand tied behind your back.

Install it, learn the basics (component tree, prop editing, profiler), and stop making React development harder than it needs to be. Your future self will thank you when you're debugging at 3am and actually know what's breaking.

The Features That Actually Matter

Look, React DevTools has a bunch of features, but 90% of the time you'll use maybe 4 of them. The official docs list everything, but here's what actually saves your ass when you're debugging at 2am and nothing makes sense.

Component Tree Navigation

React Component Tree Navigation

Ever had a "simple" login form that turns out to have 47 nested components because of UI libraries and HOCs? Yeah, me too. The component tree shows you what React actually sees, not what you think you built.

I wasted 6 hours debugging a UserProfile component before realizing it was actually coming from @company/shared-components/dist/UserProfile.js - completely different file than I expected. The "view source" link would've saved my weekend if our source maps weren't fucked.

Pro tip: filter out the gray DOM elements to focus on actual React components. Searching for AuthButton in an app with 200+ components is way better than grep-ing through files like some kind of animal.

Live Editing: The Holy Grail of Debugging

You can edit props and state directly and watch your app change in real-time. No code changes, no rebuilds, no prayers to the hot-reload gods. This live editing feature has saved my ass more times than I can count.

Example: debugging a checkout flow where the "Buy Now" button wasn't working. Instead of adding console logs and guessing, I toggled isEnabled from false to true and boom - button works. Turns out the API was returning the string "false" instead of boolean false. Would've taken hours to track down without DevTools.

The editor handles strings, numbers, booleans, arrays, and complex objects. It validates JSON syntax so you won't accidentally break everything with malformed data. Test edge cases by setting user age to -1 or product price to null - see what breaks without writing test code.

Hooks Debugging: Finally, See What's in useState

React Hooks Debugging Interface

Remember adding console.log(useState value) everywhere just to see what was in state? Yeah, fuck that noise. The hooks section shows you everything - useState values, useEffect dependencies, custom hook internals.

I burned an entire day debugging useEffect firing on every render. Turns out my dependency array had [user] but the user object was getting recreated every render with {...user, timestamp: Date.now()}. DevTools made it obvious - same user data, different object references every time. Changed it to [user.id, user.name] and boom, problem solved.

Oh, and here's a React 18 gotcha that'll drive you insane: Strict Mode runs effects twice in development. So when you're looking at the hooks timing in DevTools and thinking "why is this firing twice?", that's why. It's not a bug, it's a feature. A really annoying feature.

Custom hooks show up too, with their internal state visible. I've debugged custom hooks that were silently failing by editing their internal state and watching what breaks. Way easier than adding debug code to the hook itself.

Performance Profiling: Find What's Slow as Hell

React Profiler Performance Analysis

The Profiler shows you which components are eating up CPU time. Record a session, interact with your app, and get a flame chart showing exactly where the performance bottlenecks are. The React Profiler docs have the technical details, but the TL;DR is: longer bars = slower components.

React DevTools Profiler Recording

Real numbers from hell: I profiled a product listing page that was taking like 800ms+ to render - users were complaining about laggy scrolling and the PM was breathing down my neck. The profiler showed one ProductCard component taking around 40-50ms per render (anything over 16ms causes frame drops), and we had 20 of them. Each card was calling new Date().toLocalString() in the render function because some genius thought it was a good idea to show "Listed 3 minutes ago" that updated in real-time. Moved it to useMemo with a 60-second refresh and render time dropped to something like 120-150ms total. Way better, anyway.

The ranked chart puts the worst offenders at the top. Look for components with render times over 10ms - those are your problems. The "why did this render?" info is gold - it tells you exactly what triggered the re-render. Props change? State update? Parent component forcing a re-render for no reason? You'll know immediately.

Performance war story: Found a component re-rendering 47 times per user scroll event - Chrome DevTools was showing "Long Task" warnings and users were reporting the app felt "laggy". Turned out the parent was creating a new callback function on every render: onClick={() => handleClick(item.id)}. One useCallback hook fixed it and scroll became buttery smooth again.

React 18+ gotcha: If you're seeing weird profiler timings where components show 0ms render time but your app is still slow, check if you're using useDeferredValue or startTransition. The profiler gets confused by deferred updates sometimes and doesn't show realistic timing.

Component Selection: Find the Culprit

Click the crosshair icon and then click any element on your page to instantly find its React component. Perfect for when you're staring at broken UI wondering "which damn component is rendering this?"

Works both ways - select a component in DevTools and it highlights the corresponding page element. Saved me countless hours debugging CSS issues where I couldn't figure out which component was adding that mysterious margin.

Source Code Navigation: When It Works

The "view source" link jumps straight to the component's file definition. Great when it works, useless when your source maps are broken. Most dev servers enable source maps by default, but custom Webpack configs can screw this up.

Error Boundary Integration

When shit hits the fan and components throw errors, DevTools shows you which error boundary caught it and gives you the full stack trace. Beats digging through console logs trying to figure out why your app is showing a blank white screen.

React 18+ Features: The New Hotness

DevTools keeps up with React 18's concurrent features - Suspense boundaries, transitions, all that fancy stuff. The interface doesn't change much, which is good because learning new debugging tools sucks.

React 19 note: As of late 2024, DevTools supports React 19's new features including server components debugging, though the server component debugging is still a bit rough around the edges.

Browser Extension vs Standalone: Pick Your Poison

Use the browser extension unless you're forced to use Safari or need to debug React Native. The standalone version exists for those unfortunate souls.

Standalone version is also useful for debugging mobile apps and cross-domain scenarios, but 95% of developers just use the browser extension because it's easier.

What Actually Matters

Master these three things: component tree navigation, props/state editing, and the profiler. That's 80% of React debugging right there.

Everything else is nice to have, but these three features will solve most of your React debugging problems. Learn them first, worry about the advanced stuff later when you actually need it.

React Developer Tools vs Everything Else

Tool

What It's Good For

What It Sucks At

My Take

React Developer Tools

React component debugging, props/state editing, performance profiling

Production debugging, non-React apps

Essential for React development. No excuses.

Browser DevTools

Network debugging, generic JS profiling, DOM inspection, CSS debugging

React-specific debugging, component state inspection

Great complement to React DevTools, but useless for React component debugging.

Redux DevTools

Redux state management, time-travel debugging, action tracking

Component-level debugging, non-Redux apps

Perfect if you use Redux. Use both this and React DevTools together.

Vue DevTools

Vue component debugging, Vuex debugging

React applications (obviously)

Same concept as React DevTools but for Vue. Can't help you here.

Console Debugging

Quick logging, always available, no setup

Everything else

  • clutters code, no performance insights

What you used before you knew better. Stop doing this.

React Testing Library

Automated testing, CI/CD integration

Interactive debugging, real-time state inspection

Different use case entirely. For testing, not debugging.

Common Issues and Solutions

Q

React DevTools tabs aren't showing up - why?

A

This happens constantly. Here's the usual suspects:

The site isn't using React: Obvious but worth checking. DevTools only show up on React apps.

You're looking at a production build: Production builds strip out debugging info. You'll see a message saying "React is running in production mode" or just nothing at all.

Extension randomly broke: Chrome extensions sometimes just shit the bed for no reason. Try disabling and re-enabling the React DevTools extension. If that doesn't work, remove it completely and reinstall from the Chrome store. This happens more often on Chrome 120+ for some reason.

Chrome updated and broke extensions: Chrome updates love to break extensions. If you're getting the error "DevTools failed to load SourceMap" or seeing blank React tabs after a Chrome update, reinstall the extension. Chrome 119 specifically broke DevTools for like a week until Google fixed it.

Q

How do I debug issues in production?

A

You don't. At least not with React DevTools.

Production builds strip out all the debugging info for performance reasons. You could technically enable it, but that would expose your app's internal structure to users and slow everything down.

Instead, use error tracking like Sentry or LogRocket to capture errors and user sessions. Alternatively, set up staging environments that mirror production while maintaining debugging capabilities.

For production issues, reproduce problems locally with production data (properly anonymized). Enabling DevTools on live production applications can impact performance and expose internal application structure.

Q

Does this work with React Native?

A

Sort of. React Native DevTools has the same component tree and profiler, but you have to connect it through the Metro bundler.

React Native 0.76+ includes built-in DevTools integration that works most of the time. Earlier versions require the standalone version (npm install -g react-devtools) connected through the dev menu.

Connection stability is a fucking nightmare, especially on physical devices. You'll get errors like "Failed to connect to React DevTools. Make sure the server is running and on the same network" even when everything should be working. I've tried restarting Metro, making sure phone and laptop are on the same WiFi, using adb reverse tcp:8097 tcp:8097 on Android, clearing React Native cache, restarting the packager twice, and it still doesn't work. Then 3 hours later it randomly connects for no reason. Mobile development is hell.

Q

How do I read the profiler results?

A

The flame chart looks confusing at first, but it's simple:

Longer bars = slower components. That's it. Look for the longest bars and those are your performance problems.

The ranked chart sorts everything by render time, so the worst offenders are at the top.

"Why did this render?" is the most useful info. It tells you what changed to trigger the re-render. If you see a component rendering because of props that didn't actually change, you've found an optimization opportunity.

Q

My components show up as "Anonymous" - how do I fix that?

A

This is problematic because you can't tell which component is which.

Usually caused by:

  • Arrow functions: const MyComponent = () => <div/>
  • Higher-order components that don't set displayName
  • Components created inside render methods (don't do this)

Quick fixes:

  • Use function declarations: function MyComponent() { return <div/>; }
  • Set displayName manually: MyComponent.displayName = 'MyComponent';
  • Most bundlers auto-add display names now, but sometimes they miss edge cases
Q

Can I edit props and state directly?

A

Yes, and it works really well.

Click any component, find the props or state section, click on a value, edit it, hit Enter. Changes apply immediately.

You can edit strings, numbers, booleans, arrays, objects - basically everything. The editor validates JSON so you won't break anything with bad syntax.

Limitation: You can only edit existing props/state, not add new ones. But for testing different values without changing code, it's perfect.

Q

Why is React DevTools showing stale/wrong information?

A

This happens sometimes, usually after hot reloading breaks something.

Quick fixes:

  1. Refresh the page to reset everything
  2. Disable and re-enable the browser extension
  3. Close and reopen DevTools
  4. Check if React Strict Mode is causing double renders that confuse the extension

If it keeps happening, you might have a React version compatibility issue with the extension. Update both and see if that fixes it.

Q

The DevTools are slowing down my app, what gives?

A

The extension does add overhead, especially with the profiler running. In development this usually doesn't matter, but if you have a massive component tree (500+ components), it can get sluggish.

I had DevTools crash Chrome twice while profiling a massive dashboard with like 800+ components. Had to restart everything and debug the old-fashioned way with console logs because DevTools couldn't handle the component tree size.

Turn off the extension when you're not actively debugging, or close the DevTools panel. The overhead only happens when the panel is open and actively updating.

Q

Components tab vs Profiler tab - what's the difference?

A

Components tab: See your component tree, props, state, hooks. Use this for "why isn't this working?" debugging.

Profiler tab: Performance analysis. Use this for "why is this slow?" optimization.

Most of your debugging will be in the Components tab. Only use the Profiler when you have performance problems.

Q

Why doesn't this work with Create React App?

A

It should work out of the box. If it doesn't:

  1. Make sure you're running npm start (development mode)
  2. Clear your browser cache and refresh
  3. Disable other browser extensions that might interfere
  4. Restart the development server

If none of that works, reinstall the extension. I've had CRA randomly stop working with DevTools after a Node.js update and it took me an hour to figure out the extension needed to be reinstalled.

Q

Any gotchas I should know about?

A

Yeah, a bunch of weird shit that'll trip you up:

  • React 18 Strict Mode causes components to render twice in development, so your profiler timing looks fucked even when it's working correctly
  • Hot reloading sometimes breaks the connection and you'll get "React DevTools not connected" errors - just refresh the page
  • Large component trees (500+ components) make the extension slower than Windows Update
  • Chrome 120+ occasionally breaks extensions with the error "Manifest version 2 is deprecated" - reinstall and pray
  • Source maps disabled means "view source" links show minified garbage instead of your actual code
  • Production builds make component names look like t.createElement(n,null,a.a) - good luck debugging that
  • AdBlock or similar extensions can block DevTools scripts and you'll wonder why nothing works
  • Component keys changing on every render makes the profiler jump around like a caffeinated squirrel
  • Higher-order components without displayName show as "Anonymous" everywhere - set MyHOC.displayName = 'MyHOC' to fix it
  • React 19.0.0-beta has some weird interactions with the profiler where timings don't match reality - stick to stable versions for now

Related Tools & Recommendations

tool
Similar content

Create React App is Dead

React team finally deprecated it in 2025 after years of minimal maintenance. Here's how to escape if you're still trapped.

Create React App
/tool/create-react-app/overview
100%
tool
Similar content

Chrome DevTools - Browser Debugging Suite

The debugging tools you'll live in when shit breaks

Chrome DevTools
/tool/chrome-devtools/overview
84%
tool
Similar content

Storybook - Build Components Without Your App's Bullshit

The tool most frontend teams end up using for building components in isolation

Storybook
/tool/storybook/overview
67%
integration
Similar content

Claude API React Integration - Stop Breaking Your Shit

Stop breaking your Claude integrations. Here's how to build them without your API keys leaking or your users rage-quitting when responses take 8 seconds.

Claude API
/integration/claude-api-react/overview
56%
tool
Recommended

VS Code Settings Are Probably Fucked - Here's How to Fix Them

Your team's VS Code setup is chaos. Same codebase, 12 different formatting styles. Time to unfuck it.

Visual Studio Code
/tool/visual-studio-code/configuration-management-enterprise
44%
tool
Recommended

VS Code Extension Development - The Developer's Reality Check

Building extensions that don't suck: what they don't tell you in the tutorials

Visual Studio Code
/tool/visual-studio-code/extension-development-reality-check
44%
compare
Recommended

I've Deployed These Damn Editors to 300+ Developers. Here's What Actually Happens.

Zed vs VS Code vs Cursor: Why Your Next Editor Rollout Will Be a Disaster

Zed
/compare/zed/visual-studio-code/cursor/enterprise-deployment-showdown
44%
tool
Recommended

Create React App 死亡宣告

2025年2月14日で終了。React開発どうする?

Create React App
/ja:tool/create-react-app/overview
44%
tool
Recommended

Escape Create React App Hell - Migration Guide That Actually Works

Stop suffering with 30-second dev server startup. Here's how to migrate to tools that don't make you want to quit programming.

Create React App
/tool/create-react-app/migration-guide
44%
tool
Popular choice

jQuery - The Library That Won't Die

Explore jQuery's enduring legacy, its impact on web development, and the key changes in jQuery 4.0. Understand its relevance for new projects in 2025.

jQuery
/tool/jquery/overview
43%
tool
Similar content

React Codemod - Automated Code Transformation for React Applications

Official collection of codemods for seamless React upgrades and migrations

React Codemod
/tool/react-codemod/overview
42%
tool
Popular choice

Hoppscotch - Open Source API Development Ecosystem

Fast API testing that won't crash every 20 minutes or eat half your RAM sending a GET request.

Hoppscotch
/tool/hoppscotch/overview
42%
tool
Popular choice

Stop Jira from Sucking: Performance Troubleshooting That Works

Frustrated with slow Jira Software? Learn step-by-step performance troubleshooting techniques to identify and fix common issues, optimize your instance, and boo

Jira Software
/tool/jira-software/performance-troubleshooting
40%
tool
Popular choice

Northflank - Deploy Stuff Without Kubernetes Nightmares

Discover Northflank, the deployment platform designed to simplify app hosting and development. Learn how it streamlines deployments, avoids Kubernetes complexit

Northflank
/tool/northflank/overview
38%
tool
Similar content

Headless UI - Components That Don't Look Like Ass

CSS frameworks make every app look the same. Your designer hates Material-UI's blue buttons. Headless UI handles the keyboard navigation nightmares so you don't

Headless UI
/tool/headless-ui/overview
37%
tool
Popular choice

LM Studio MCP Integration - Connect Your Local AI to Real Tools

Turn your offline model into an actual assistant that can do shit

LM Studio
/tool/lm-studio/mcp-integration
36%
tool
Similar content

Mint Programming Language - A Refreshing Approach to Frontend Development

A unified language designed specifically for building single-page applications with everything you need built-in

Mint Programming Language
/tool/mint/overview
36%
tool
Similar content

Recoil - Facebook's State Management Experiment That Got Shelved

Facebook built something clever, then abandoned it like they do with half their developer tools

Recoil
/tool/recoil/overview
35%
tool
Similar content

Next.js App Router - File-System Based Routing for React

App Router breaks everything you know about Next.js routing

Next.js App Router
/tool/nextjs-app-router/overview
35%
tool
Popular choice

CUDA Development Toolkit 13.0 - Still Breaking Builds Since 2007

NVIDIA's parallel programming platform that makes GPU computing possible but not painless

CUDA Development Toolkit
/tool/cuda/overview
34%

Recommendations combine user behavior, content similarity, research intelligence, and SEO optimization