Here's the thing - I've been benchmarking Node.js apps since version 8, and every major release, some genius tells me "just upgrade, everything's faster now." Sometimes they're right. Sometimes they fuck up your prod deployment at 2am on a Friday.
Node.js 24.0.0 was released April 24, 2024 and it's actually solid. Node.js 22 got faster for a lot of stuff too. I wasted a weekend running benchmarks and yeah, NodeSource's numbers about Buffer operations being 67% faster are legit. But here's what they don't tell you in the release notes: anything before v22.9.0 has this fucked up Maglev compiler that makes some stuff slower, not faster. Took me like 3 hours to figure out why my API was suddenly dogshit.
If you're still on anything before v22.9.0, your benchmarks are probably lying to you. They disabled Maglev in v22.9.0 because it was making some workloads slower, not faster.
Why Your Benchmarks Are Bullshit
Apache Bench is garbage for Node.js. I don't care if it's what you learned in college or what your CI pipeline uses. ab -n 1000 -c 10 gives you numbers that have nothing to do with how your API performs when real users hit it.
Here's why your benchmarks are bullshit:
- You're running benchmarks on your laptop while Slack eats CPU - Your MacBook Pro getting hot during a Zoom call doesn't represent production load
- You're testing with tiny request bodies - Your API might handle 10KB JSON fine but choke on 2MB file uploads
- You're not accounting for connection pooling - Apache Bench opens/closes connections like it's 1999
- You're measuring the wrong thing - V8 will optimize away half your micro-benchmark and you'll measure
noop()functions
The only Buffer improvement that actually mattered for my apps was Buffer.compare() getting 200% faster. Everything else was noise. If you're not doing heavy Buffer manipulation (and most APIs aren't), you won't notice the difference.
WebStreams got faster too - 100%+ improvements according to NodeSource. Since the fetch API uses WebStreams, this actually does help real-world HTTP performance. I saw about 19% better throughput on our API after upgrading, which matches their numbers.
Setting Up Benchmarks That Won't Lie to You
Stop benchmarking on your laptop. I don't care how powerful your MacBook is. When Chrome decides to compile some JavaScript, or Docker Desktop randomly uses 200% CPU, or macOS starts indexing your files because you breathed wrong, your benchmark results become garbage.
What you actually need:
- Dedicated server (I use AWS c6i.xlarge, like $0.17/hour - cheaper than wasting a day debugging fake shit)
- Ubuntu 22.04 or newer (Windows benchmarking is a special kind of hell)
- No other processes running (kill Docker, kill your monitoring agents, kill everything)
- Same network conditions as production (don't benchmark local clients to production DB)
Turn off CPU frequency scaling or your results will be inconsistent garbage:
echo performance | sudo tee /sys/devices/system/cpu/cpu*/cpufreq/scaling_governor
Turn off Turbo Boost if you want consistent results across multiple runs:
echo 1 | sudo tee /sys/devices/system/cpu/intel_pstate/no_turbo
The first rule of benchmarking: if Brendan Gregg says it, do it. He proved that even shouting near hardware could affect disk I/O measurements. Your Spotify playlist absolutely can skew CPU benchmarks.
How to Actually Measure Performance
Run your benchmark 30 times minimum. Not 3 times, not 5 times, 30 times. Otherwise you're measuring noise, not performance.
The Node.js benchmark suite does this right. They run statistical tests and show confidence levels. Three asterisks (***) means they're 99.9% confident the difference is real, not random variation.
## Run proper statistical benchmarking
node benchmark/compare.js --filter=\"buffer\" ./node ./node-baseline --runs=30
Example output that means something:
                                                                              confidence improvement accuracy
buffer-compare.js n=16384 args=0 method='compare'                                 ***     213.38 %    ±4.21%
buffer-compare.js n=16384 args=1 method='compare'                                 ***     67.59 %     ±3.80%
If your benchmarking tool doesn't show confidence levels, find a better tool.
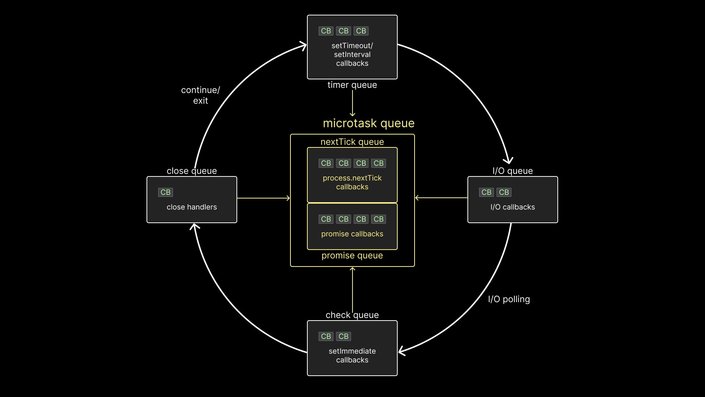
Why Micro-Benchmarks Are Usually Bullshit
![]()
I wasted like an entire weekend optimizing JavaScript operations that made zero difference to real users. V8's JIT compiler is too smart for its own good - it'll optimize away your benchmark and you'll end up measuring `noop()` functions.
The classic micro-benchmark trap:
// This measures nothing useful
for (let i = 0; i < 1000000; i++) {
  const result = someOperation(); // V8 optimizes this away
}
Tools like bench-node try to fix this with `%NeverOptimizeFunction`, but then your benchmark results don't reflect production where V8 optimizations matter.
Better approach: Benchmark your actual API endpoints, not individual JavaScript operations.
Performance Assumptions That Break Every Release
Node.js 20 broke parseInt vs + performance assumptions. For years, using `+` to convert strings to numbers was faster than `parseInt()`. Then Node 20 flipped it:
// What used to be true in Node 18
'Using +': 106,028,083 ops/sec
'Using parseInt()': 17,222,411 ops/sec  // 6x slower

// Node 20 reversed it
'Using parseInt()': 89,211,357 ops/sec  // Now faster
'Using +': 98,944,329 ops/sec
This is why I don't trust "best practices" articles from 2019. Test your assumptions with every major Node.js upgrade.
Memory Benchmarking (Where Everyone Screws Up)
Your app will hit the V8 heap limit (~2GB by default) faster than you think. I've seen apps that bench at 10ms response time suddenly jump to 2000ms when memory gets tight. Node.js just sits there like "FATAL ERROR: Reached heap limit Allocation failed - JavaScript heap out of memory" and dies.
The problem: Most benchmarks use tiny datasets. Production uses real data.
## Benchmark with realistic memory pressure
node --max-old-space-size=512 your-app.js  # Force smaller heap
Watch for GC pauses that don't show up in simple benchmarks:
node --trace-gc your-app.js | grep \"Mark-Sweep\"
When you see `Mark-Sweep` pauses over 100ms during benchmarking, your users will notice. Fix the memory leaks before optimizing anything else.
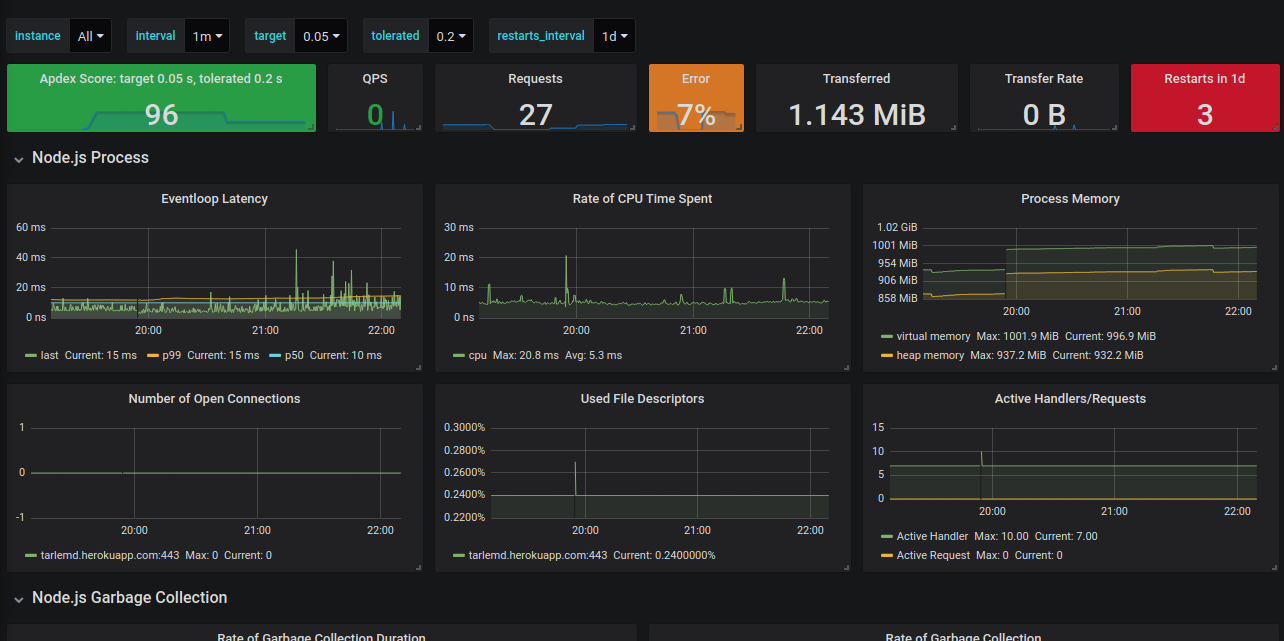
Tools That Actually Work
![]()
Skip the academic benchmarking frameworks. Use autocannon for HTTP APIs, Artillery for complex user flows, and clinic.js for profiling. k6 works for complex scenarios, wrk2 provides accurate latency percentiles, and Apache JMeter handles complex test plans if you hate yourself. Everything else is either overly complicated or gives you fake numbers.
Node.js 24 brings some real improvements: Undici 7.0.0 upgrades behind the fetch API, better permission model, and continued V8 optimizations. require() got faster through ESM loader improvements, the test runner gained test coverage reports, and module mocking finally works reliably. If you're still on Node 20 LTS (which goes end-of-life in April 2026), plan your upgrade path to Node 24 LTS when it drops in October 2025.
The Node.js 22/24 improvements are real, but only if you measure them correctly. Most performance gains disappear in production because your benchmark setup doesn't match your actual usage patterns.