Connection Pools That Don't Randomly Break

Running the latest Drizzle 0.44.5 in production and connection pooling breaks in ways that never happen locally.

Connection Pooling That Actually Works

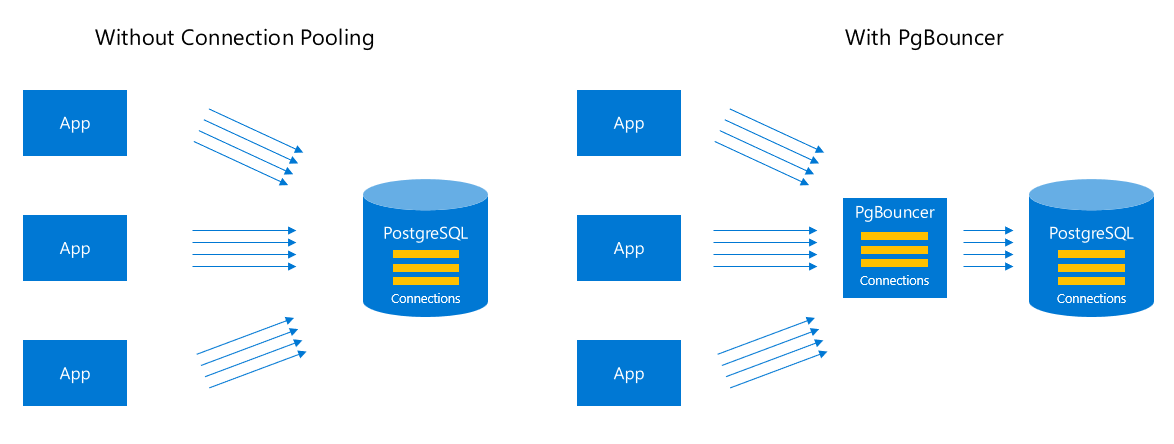
Connection pooling means keeping database connections open instead of creating new ones for every request. Pretty straightforward until it completely fucks you over in production.

PostgreSQL Connection Pool Architecture

Database connections fail in production if you don't get the pool settings right. Found this out when our Node.js 20.11.0 app went down for 2 hours - PostgreSQL 15.4 has a 100 connection limit by default and we hit it during Black Friday traffic.

For Traditional Servers (Node.js, whatever):

import { Pool } from 'pg';
import { drizzle } from 'drizzle-orm/node-postgres';

const pool = new Pool({
  connectionString: process.env.DATABASE_URL,
  max: 10,                    // Don't go above 20, trust me
  idleTimeoutMillis: 10000,   // Kill idle connections fast
  connectionTimeoutMillis: 2000, // Fail fast when DB is fucked
  statement_timeout: 10000,   // Kill slow queries
});

export const db = drizzle(pool, { schema });

In my experience, pools above 20 connections usually make things worse. Most databases can't handle that many connections anyway. Start with 10, monitor with pg_stat_activity, then bump to 15 if you're actually hitting limits.

For Serverless Functions (Vercel, AWS Lambda):

I learned this the hard way with serverless - every damn function creates its own connections, so you hit database limits fast. Traditional connection pooling doesn't work because functions are stateless and don't give a shit about your carefully configured pools.

Connection Patterns for Serverless

Every cold start means new connections, and with traditional drivers you hit connection limits during traffic spikes. HTTP-based database drivers work better for serverless since they don't maintain persistent connections. Neon's serverless approach specifically addresses these challenges with WebSocket connections for better performance.

// Neon HTTP - optimal for serverless (no persistent connections)
import { drizzle } from 'drizzle-orm/neon-http';
import { neon } from '@neondatabase/serverless';

const sql = neon(process.env.DATABASE_URL!);
export const db = drizzle(sql, { schema });

// Vercel Postgres - built-in connection management  
import { drizzle } from 'drizzle-orm/vercel-postgres';
import { sql } from '@vercel/postgres';

export const db = drizzle(sql, { schema });

// Supabase - connection pooling handled automatically
import { drizzle } from 'drizzle-orm/postgres-js';
import postgres from 'postgres';

const queryClient = postgres(process.env.DATABASE_URL!, {
  max: 1, // Serverless functions should use minimal connections
  idle_timeout: 20,
  connect_timeout: 10,
});
export const db = drizzle(queryClient, { schema });

Supabase handles connection pooling automatically through PgBouncer, but their docs are absolute garbage when you're trying to debug connection issues at 3am.

Edge Runtime Deployment Patterns

Serverless Architecture

Edge functions are finicky bastards when it comes to database drivers. Here's what's actually working for us (after trying everything else):

Cloudflare Workers + D1:

D1 is SQLite at the edge with global replication. Works pretty well when it's not being slow as molasses.

import { drizzle } from 'drizzle-orm/d1';

export default {
  async fetch(request: Request, env: Env): Promise<Response> {
    const db = drizzle(env.DB, { schema });
    // D1 handles connection management automatically
    const users = await db.select().from(usersTable).limit(10);
    return new Response(JSON.stringify(users));
  },
};

Vercel Edge Functions:

// Uses Neon HTTP or Vercel Postgres
import { drizzle } from 'drizzle-orm/neon-http';
import { neon } from '@neondatabase/serverless';

const sql = neon(process.env.DATABASE_URL!);
const db = drizzle(sql, { schema });

export const runtime = 'edge';

export default async function handler(req: Request) {
  // Works in Vercel Edge Runtime
  const result = await db.query.users.findMany({ limit: 10 });
  return new Response(JSON.stringify(result));
}

Vercel Edge will bite you in the ass: Works fine in development, then crashes in production with "Module not found: Can't resolve 'pg'" errors. Took me 4 hours to figure out that Edge Runtime can't import pg or any Node.js modules. Use neon-http instead or your deploy will fail every fucking time.

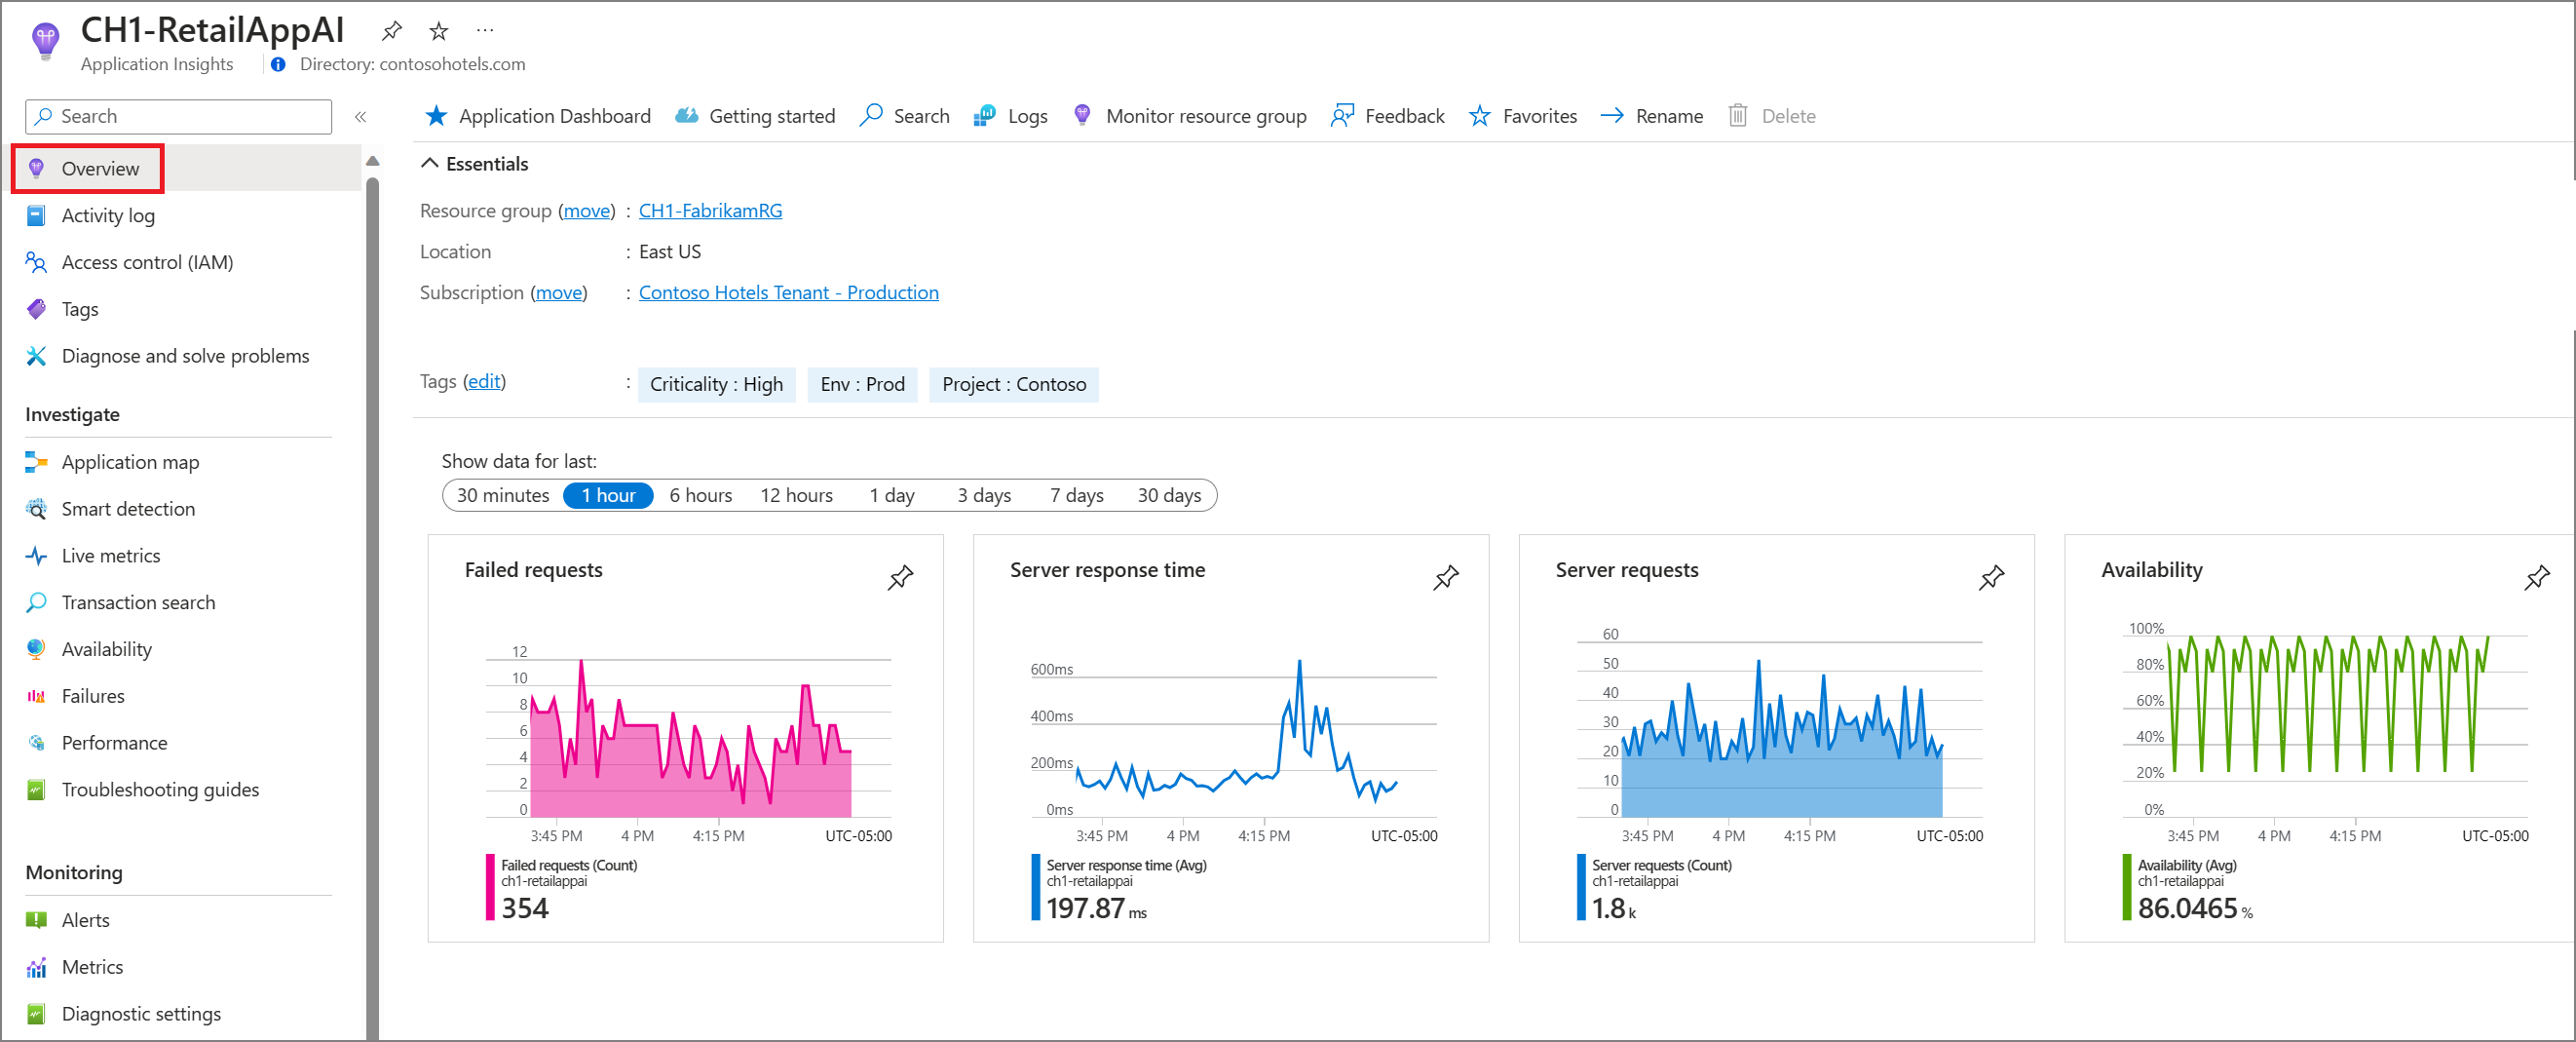
Memory Management and Performance Optimization

Common ways database performance gets worse in production:

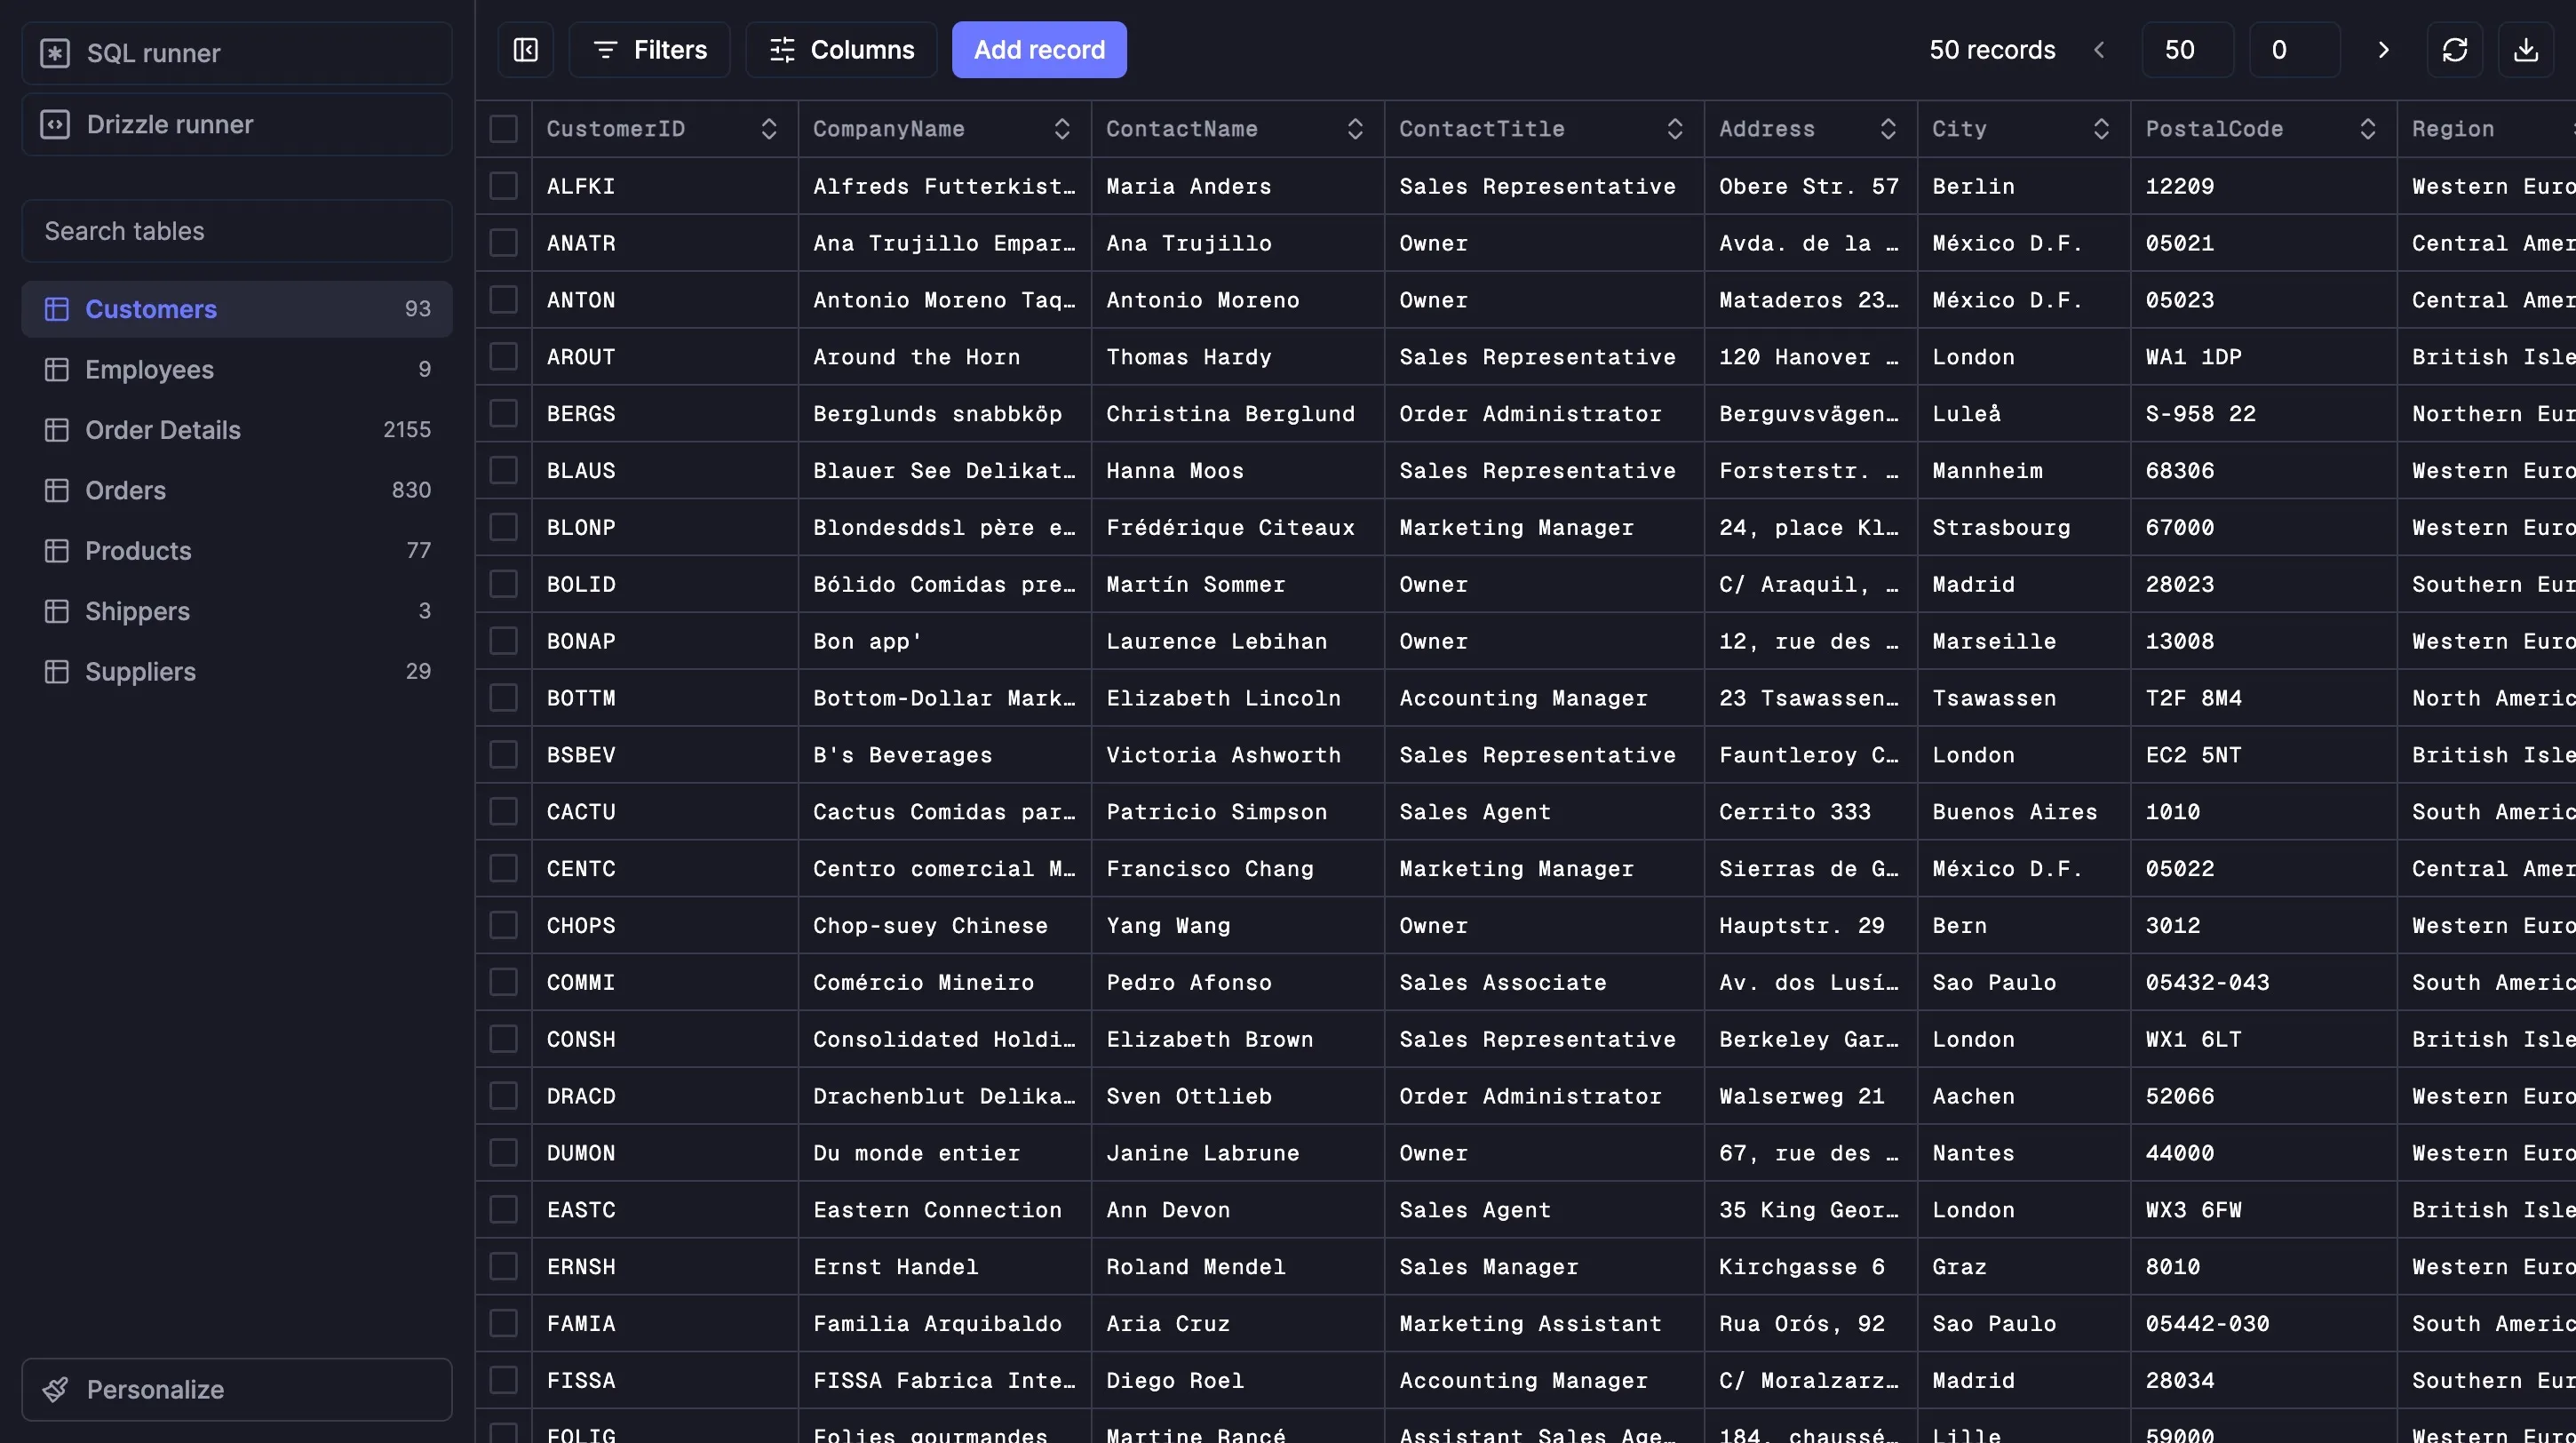
1. Query Optimization

TypeScript ORM Performance Comparison

// ❌ Bad - fetches all columns, causes memory bloat
const users = await db.select().from(usersTable);

// ✅ Good - select only needed fields  
const users = await db.select({ 
  id: usersTable.id, 
  name: usersTable.name 
}).from(usersTable);

// ✅ Better - use prepared statements for repeated queries
const getUserByEmail = db
  .select({ id: usersTable.id, name: usersTable.name })
  .from(usersTable)
  .where(eq(usersTable.email, sql.placeholder('email')))
  .prepare('getUserByEmail');

// Reuse for significant performance gains
const user = await getUserByEmail.execute({ email: userEmail });

Prepared statements provide significant performance improvements by avoiding query parsing overhead.

2. Schema Design

Database Schema Example

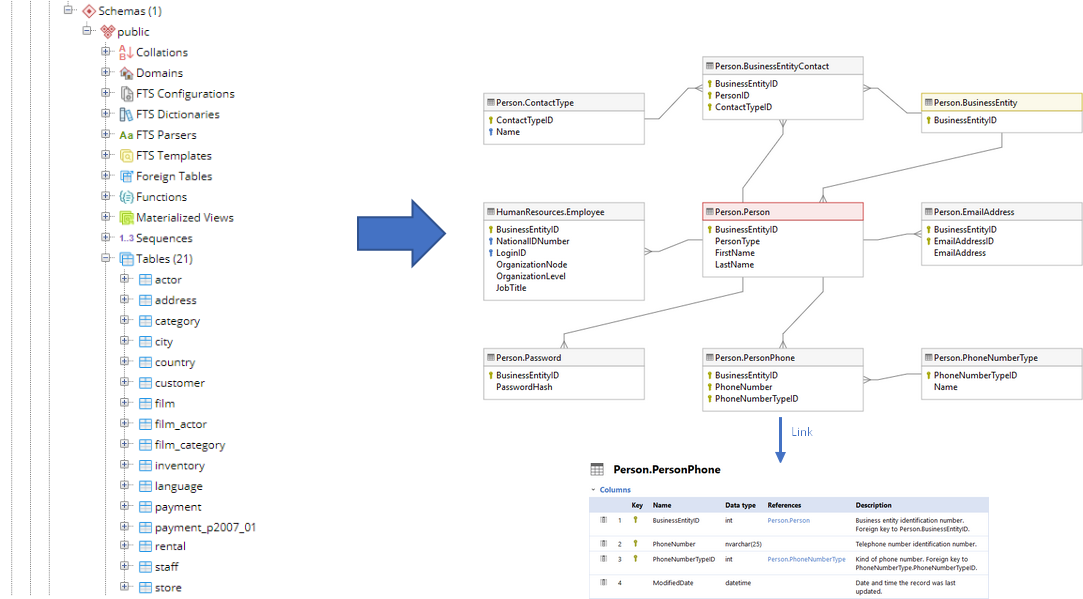
Identity columns work better than serial in most cases - they're faster and handle connection pooling better. PostgreSQL identity columns provide better concurrency than serial columns:

import { pgTable, integer, varchar, timestamp } from 'drizzle-orm/pg-core';

// Identity columns that actually work
export const users = pgTable('users', {
  id: integer('id').primaryKey().generatedAlwaysAsIdentity(),
  email: varchar('email', { length: 320 }).notNull().unique(),
  createdAt: timestamp('created_at', { 
    mode: 'date',        // Way faster than string parsing
    precision: 3,        // Milliseconds matter in logging  
    withTimezone: true   // Saves you from timezone hell
  }).notNull().defaultNow(),
});

3. Index Strategy

Production-tested indexing patterns that actually improve performance. PostgreSQL indexing best practices and index types matter for query performance:

export const orders = pgTable('orders', {
  id: integer('id').primaryKey().generatedAlwaysAsIdentity(),
  customerId: integer('customer_id').notNull(),
  status: varchar('status', { length: 20 }).notNull(),
  orderDate: timestamp('order_date').notNull(),
}, (table) => [
  // Composite index - column order matters for performance
  index('orders_customer_status_date_idx')
    .on(table.customerId, table.status, table.orderDate.desc()),
    
  // Partial index - can improve performance significantly for filtered queries
  index('orders_active_idx')
    .on(table.customerId, table.orderDate.desc())
    .where(sql`${table.status} = 'active'`),
]);

Migration Management in Production

Drizzle Studio Interface

Migration mistakes can bring down production. Teams sometimes mix push and migrate commands and end up with inconsistent schemas. Database migration strategies and zero-downtime deployments require careful planning:

Development to Production Pipeline:

  1. Development: Use drizzle-kit push for rapid iteration
  2. Staging: Generate clean migrations with drizzle-kit generate
  3. Production: Apply migrations with drizzle-kit migrate
## Development - instant schema updates
npx drizzle-kit push --verbose

## Before production deployment - generate clean migration files
npx drizzle-kit generate --name add_user_preferences

## Production deployment - apply migrations safely
npx drizzle-kit migrate --config production.config.ts

Critical Migration Safety Pattern:

// production.config.ts
import { defineConfig } from 'drizzle-kit';

export default defineConfig({
  dialect: 'postgresql',
  schema: './src/schema.ts',
  out: './migrations',
  dbCredentials: {
    url: process.env.DATABASE_URL!,
  },
  // Production safety settings
  strict: true,     // Fail on unsafe migrations
  verbose: true,    // Detailed logging
  migrations: {
    schema: 'drizzle',  // Separate schema for migration tracking
    table: '__drizzle_migrations',
  },
});

Error Handling That Actually Helps

Application Monitoring Dashboard

Drizzle 0.44.0 added DrizzleQueryError which gives better error details than generic "query failed" messages:

import { DrizzleQueryError } from 'drizzle-orm';

try {
  const result = await db.query.users.findFirst({
    where: eq(users.id, userId),
  });
} catch (error) {
  if (error instanceof DrizzleQueryError) {
    // Log the actual SQL and parameters for debugging
    console.error('Database query failed:', {
      sql: error.sql,
      params: error.params,
      originalError: error.originalError,
      stack: error.stack,
    });
    
    // Send to your monitoring service
    // Sentry, DataDog, etc.
  }
  throw error;
}

The next section covers specific deployment platform configurations and the gotchas that will save you hours of debugging time.

Common Production Deployment Issues

Q

Why does my Vercel deployment randomly timeout when it works fine locally?

A

Because of Vercel Edge limitations: Edge functions have a 128MB memory limit that their docs barely mention. Everything works perfectly locally then randomly times out in production when you hit the limit.

The fix that actually works:

// ❌ This will timeout in Vercel Edge
import { drizzle } from 'drizzle-orm/neon-serverless';

// ✅ Use HTTP driver for Vercel Edge
import { drizzle } from 'drizzle-orm/neon-http';
import { neon } from '@neondatabase/serverless';

const sql = neon(process.env.DATABASE_URL!);
const db = drizzle(sql);

Check the Vercel dashboard function logs - you'll see it hitting the 128MB limit right before everything goes to hell.

Q

"too many clients" errors are killing my app

A

What happened: You hit PostgreSQL's connection limit (usually 100). Every dyno, every serverless function, everything that connects counts toward this limit.

Solutions by deployment type:

Traditional servers: Implement connection pooling with appropriate limits:

const pool = new Pool({
  max: Math.floor(100 / numberOfAppInstances), // Distribute connections
  idleTimeoutMillis: 30000,  // Release idle connections
});

Serverless: Use HTTP-based database connections that don't maintain persistent connections:

Kubernetes/Docker: Use external connection poolers like PgBouncer or Odyssey.

Q

Migrations fail with "relation already exists" or schema drift errors

A

Root Cause: Migration history is out of sync between environments, or manual schema changes were made directly in the database.

Recovery steps:

  1. Never manually edit migration files that have been applied to production
  2. Reset development only: If safe, delete drizzle folder and regenerate clean migrations
  3. Production recovery: Create a new migration to reconcile differences:
## Generate migration to fix drift
npx drizzle-kit generate --name fix_schema_drift

## Review the generated SQL carefully before applying
npx drizzle-kit migrate --config production.config.ts

Prevention: Use drizzle-kit check to validate migrations before deployment:

npx drizzle-kit check --config production.config.ts
Q

Edge Functions fail with "Module not found" errors for database drivers

A

Root Cause: Edge runtimes don't support Node.js-specific modules like pg or mysql2. The error often appears as Module "node:crypto" is not available in Edge Runtime.

Solution: Use edge-compatible drivers exclusively:

// ❌ These will fail in edge runtime
import { drizzle } from 'drizzle-orm/node-postgres';
import { drizzle } from 'drizzle-orm/mysql2';

// ✅ Edge-compatible drivers
import { drizzle } from 'drizzle-orm/neon-http';      // PostgreSQL
import { drizzle } from 'drizzle-orm/planetscale';   // MySQL  
import { drizzle } from 'drizzle-orm/d1';            // SQLite

Check your package.json for Node.js database drivers and replace them with HTTP-based alternatives.

Q

Prepared statements cause "already exists" errors in serverless functions

A

Root Cause: Serverless functions may reuse containers between invocations, causing prepared statement name collisions when the same statement is prepared multiple times.

Solution: Use dynamic prepared statement names or avoid them in serverless:

// ❌ Fixed name causes collisions
const stmt = db.select().from(users).prepare('getUserStmt');

// ✅ Dynamic names or no preparation
const stmt = db.select().from(users).prepare(`getUser_${Date.now()}`);

// ✅ Or just skip preparation in serverless - performance difference is minimal
const users = await db.select().from(usersTable).where(eq(usersTable.id, userId));
Q

My queries work in dev but timeout in production

A

Because production databases are slow as shit: Your local PostgreSQL responds in 5ms. Production responds in 500ms because it's under actual load, sharing resources with other apps, and your queries are poorly optimized garbage.

How to fix this garbage:

  1. Set appropriate timeouts in your connection configuration:
const pool = new Pool({
  connectionString: process.env.DATABASE_URL,
  statement_timeout: 15000,  // 15 second query timeout
  query_timeout: 15000,      // Additional safety timeout
  connectionTimeoutMillis: 5000, // Connection establishment timeout
});
  1. Optimize slow queries using EXPLAIN ANALYZE to identify bottlenecks
  2. Add database indexes for frequently filtered columns
  3. Use read replicas for read-heavy operations with Drizzle's read replica support
Q

Environment variables not working in deployed applications

A

Root Cause: Environment variables are often configured differently between development (.env files) and production (platform-specific settings).

Debugging steps:

  1. Log environment variables at startup (safely, without exposing secrets):
console.log('Database configured:', !!process.env.DATABASE_URL);
console.log('Node environment:', process.env.NODE_ENV);
  1. Platform-specific configuration:

    • Vercel: Configure in project settings or vercel.json
    • Netlify: Use site settings or netlify.toml
    • Railway: Use project variables
    • Docker: Pass via docker run -e or docker-compose.yml
  2. Validate connection strings have the correct format for your driver:

// Most drivers need the full connection string
const isValidUrl = process.env.DATABASE_URL?.startsWith('postgresql://');
if (!isValidUrl) {
  throw new Error('Invalid DATABASE_URL format');
}

Deployment Platform Compatibility Matrix

Platform

Runtime

Recommended Driver

Connection Pooling

Memory Limit

Timeout

Production Ready

Vercel Functions

Node.js

neon-serverless, vercel-postgres

Automatic

1GB

60s

✅ Works great

Vercel Edge

Edge

neon-http, d1

HTTP-based

128MB

10s

⚠️ Breaks with complex queries

Netlify Functions

Node.js

neon-serverless, postgres-js

Manual setup

1GB

26s

✅ Solid choice

Netlify Edge

Edge

neon-http, d1

HTTP-based

128MB

10s

⚠️ Memory limit kills you

Cloudflare Workers

V8

d1, neon-http

HTTP-based

128MB

30s CPU

✅ Actually reliable

AWS Lambda

Node.js

postgres-js, neon-http

Connection reuse

3GB-10GB

15min

✅ Excellent

Railway

Node.js/Docker

node-postgres, mysql2

Full control

Configurable

No limit

✅ Excellent

Fly.io

Docker

node-postgres, mysql2

Full control

Configurable

No limit

✅ Excellent

DigitalOcean App

Node.js/Docker

node-postgres, mysql2

Full control

Configurable

60s

✅ Good

Heroku

Node.js

node-postgres, mysql2

Automatic

512MB-14GB

30s

✅ Good

Google Cloud Run

Container

node-postgres, mysql2

Manual setup

Configurable

60min

✅ Excellent

Azure Functions

Node.js

postgres-js, tedious

Connection reuse

1.5GB

10min

⚠️ Limited testing

Stop Your Database From Eating Shit Under Load

Your Drizzle queries will slow to a crawl under production load unless you monitor and optimize the right stuff. Here's what actually matters.

Stop Your Queries From Being Garbage

Look, I spent weeks optimizing connection pools and caching when the real problem was my queries were complete garbage. Don't be like me.

Stop obsessing over micro-optimizations. The biggest performance gains come from not being an idiot about query design:

Prepared Statements for Repeated Queries:

// Create prepared statements for your most frequent queries
const getUserProfile = db
  .select({
    id: users.id,
    name: users.name,
    email: users.email,
    role: users.role,
  })
  .from(users)
  .leftJoin(profiles, eq(users.id, profiles.userId))
  .where(eq(users.id, sql.placeholder('userId')))
  .prepare('getUserProfile');

// This actually made queries noticeably faster - maybe 30%? Hard to measure exactly
const profile = await getUserProfile.execute({ userId: 123 });

Selective Field Loading with Relations:
The relational query API makes it easy to over-fetch data. Production monitoring consistently shows this as a major performance bottleneck.

// ❌ Bad - loads everything, including large fields
const posts = await db.query.posts.findMany({
  with: {
    author: true,        // Loads all user fields
    comments: true,      // Loads all comments
  },
});

// ✅ Good - selective loading based on actual needs
const posts = await db.query.posts.findMany({
  columns: {
    id: true,
    title: true,
    summary: true,
    createdAt: true,
    // Exclude large 'content' field from listing
  },
  with: {
    author: {
      columns: { id: true, name: true, avatar: true },
    },
    _count: {
      comments: true,    // Just the count, not full comments
    },
  },
  limit: 20,
});

Monitoring That Actually Helps When Shit Breaks

The `DrizzleQueryError` in 0.44.0 finally gives you useful error info instead of generic "query failed" bullshit. Here's monitoring that doesn't completely suck:

import { performance } from 'perf_hooks';

// This is definitely overkill but actually works in production
export function createMonitoredDB(baseDb: any, logger: any) {
  return new Proxy(baseDb, {
    get(target, prop) {
      const original = target[prop];
      
      if (typeof original === 'function') {
        return function(...args: any[]) {
          const startTime = performance.now();
          const result = original.apply(target, args);
          
          if (result && typeof result.then === 'function') {
            return result
              .then((data: any) => {
                const duration = performance.now() - startTime;
                logger.info('Query executed', {
                  operation: prop,
                  duration: `${duration.toFixed(2)}ms`,
                  recordCount: Array.isArray(data) ? data.length : 1,
                });
                return data;
              })
              .catch((error: any) => {
                const duration = performance.now() - startTime;
                logger.error('Query failed', {
                  operation: prop,
                  duration: `${duration.toFixed(2)}ms`,
                  error: error.message,
                  sql: error.sql || 'N/A',
                });
                throw error;
              });
          }
          
          return result;
        };
      }
      
      return original;
    },
  });
}

// Usage - this logs everything but at least you'll know exactly when and why shit breaks
const monitoredDb = createMonitoredDB(db, logger);

Metrics to Track in Production:

  1. Query Duration Distribution - Track P50, P95, P99 query times
  2. Connection Pool Utilization - Monitor active/idle connection ratio
  3. Query Error Rate - Track failed queries and their causes
  4. Memory Usage per Request - Important for serverless functions
  5. Cold Start Impact - Measure first-query latency vs subsequent queries

Caching That Doesn't Break Everything

Cache invalidation will ruin your fucking weekend. I learned this the hard way when our "smart" caching broke during a product launch and showed users old data for 3 hours straight:

import { upstashCache } from "drizzle-orm/cache/upstash";
import { drizzle } from "drizzle-orm/neon-http";

const db = drizzle(process.env.DATABASE_URL!, {
  schema,
  cache: upstashCache({
    url: process.env.UPSTASH_REDIS_REST_URL!,
    token: process.env.UPSTASH_REDIS_REST_TOKEN!,
    // Strategic caching - not everything needs caching
    global: false,  // Explicit caching only
    config: { ex: 300 }, // 5-minute default TTL
  })
});

// Cache user profiles (read-heavy, change infrequently)
const getUserProfile = db.query.users.findFirst({
  where: eq(users.id, userId),
  with: { profile: true },
}).$cacheKey(`user:${userId}`).$cacheTTL(900); // 15-minute cache

// Don't cache real-time data (orders, messages, etc.)
const recentOrders = db.query.orders.findMany({
  where: gt(orders.createdAt, lastWeek),
  orderBy: desc(orders.createdAt),
  limit: 10,
}); // No caching for real-time data

Cache Invalidation Strategy:

// Invalidate cache on mutations
export async function updateUserProfile(userId: number, data: ProfileUpdate) {
  const result = await db.update(profiles)
    .set(data)
    .where(eq(profiles.userId, userId));
    
  // Invalidate related caches
  await cache.invalidate([
    `user:${userId}`,
    `user:${userId}:posts`,
    'users:active', // List caches that might include this user
  ]);
  
  return result;
}

Database Connection Health Monitoring

Connection issues are the leading cause of production outages with database-backed applications. Implement comprehensive connection monitoring:

import { EventEmitter } from 'events';

class DatabaseHealthMonitor extends EventEmitter {
  private healthCheckInterval: NodeJS.Timeout | null = null;
  private consecutiveFailures = 0;
  
  constructor(private db: any, private intervalMs = 30000) {
    super();
  }
  
  start() {
    this.healthCheckInterval = setInterval(async () => {
      try {
        // Simple health check query
        await this.db.execute(sql`SELECT 1 as health_check`);
        
        if (this.consecutiveFailures > 0) {
          this.emit('recovered', { 
            previousFailures: this.consecutiveFailures 
          });
          this.consecutiveFailures = 0;
        }
        
        this.emit('healthy');
        
      } catch (error) {
        this.consecutiveFailures++;
        this.emit('unhealthy', { 
          error, 
          consecutiveFailures: this.consecutiveFailures 
        });
        
        // Alert after 3 consecutive failures
        if (this.consecutiveFailures >= 3) {
          this.emit('critical', { error, consecutiveFailures: this.consecutiveFailures });
        }
      }
    }, this.intervalMs);
  }
  
  stop() {
    if (this.healthCheckInterval) {
      clearInterval(this.healthCheckInterval);
      this.healthCheckInterval = null;
    }
  }
}

// Usage with alerting
const monitor = new DatabaseHealthMonitor(db);
monitor.on('critical', ({ error, consecutiveFailures }) => {
  // Send alert to Slack, PagerDuty, etc.
  console.error(`Database health critical: ${consecutiveFailures} failures`, error);
});

monitor.start();

Production Schema Optimization

Index Monitoring and Optimization:
Modern PostgreSQL provides detailed index usage statistics. Monitor and optimize indexes based on actual production queries:

-- Query to find unused indexes (run monthly)
SELECT 
  schemaname,
  tablename,
  indexname,
  idx_scan as scans,
  pg_size_pretty(pg_relation_size(indexrelname::regclass)) as size
FROM pg_stat_user_indexes 
WHERE idx_scan < 10  -- Indexes used less than 10 times
ORDER BY pg_relation_size(indexrelname::regclass) DESC;

-- Query to find missing indexes (high seq_scan count)
SELECT 
  schemaname,
  tablename,
  seq_scan,
  seq_tup_read,
  seq_tup_read / seq_scan as avg_tuples_per_scan
FROM pg_stat_user_tables 
WHERE seq_scan > 1000  -- Tables with high sequential scan count
ORDER BY seq_tup_read DESC;

Implementing these findings in Drizzle:

// Add indexes based on production query patterns
export const orders = pgTable('orders', {
  id: integer('id').primaryKey().generatedAlwaysAsIdentity(),
  customerId: integer('customer_id').notNull(),
  status: orderStatusEnum('status').notNull(),
  createdAt: timestamp('created_at').notNull().defaultNow(),
  updatedAt: timestamp('updated_at').notNull().defaultNow(),
}, (table) => [
  // Discovered from production: frequent customer + status filtering
  index('idx_orders_customer_status').on(table.customerId, table.status),
  
  // Time-range queries are common - compound index with time
  index('idx_orders_status_created').on(table.status, table.createdAt.desc()),
  
  // Partial index for active orders only (most queries filter these)
  index('idx_orders_active')
    .on(table.customerId, table.createdAt.desc())
    .where(sql`${table.status} IN ('pending', 'processing')`),
]);

Deployment-Specific Optimizations

Serverless Function Optimization:

// Keep database connection outside handler for connection reuse
let cachedDb: any = null;

export async function handler(event: any) {
  // Reuse connection across invocations
  if (!cachedDb) {
    cachedDb = drizzle(process.env.DATABASE_URL!, { schema });
  }
  
  // Use connection warmup for critical paths
  if (event.source === 'aws.events' && event.detail?.type === 'warmup') {
    await cachedDb.execute(sql`SELECT 1`); // Keep connection warm
    return { statusCode: 200, body: 'Warmed' };
  }
  
  // Your actual business logic
  const data = await cachedDb.query.users.findMany({ limit: 10 });
  return { statusCode: 200, body: JSON.stringify(data) };
}

Edge Function Considerations:

// Edge functions need optimized bundle sizes
import { drizzle } from 'drizzle-orm/neon-http';
import { neon } from '@neondatabase/serverless';

// Pre-configure for faster cold starts
const sql = neon(process.env.DATABASE_URL!, {
  fullResults: true,  // Enable better error messages
  arrayMode: false,   // Object mode for easier handling
});

export const db = drizzle(sql, { schema });

// Use minimal queries for edge deployment
export async function edgeHandler() {
  // Keep queries simple and focused
  const users = await db.select({
    id: usersTable.id,
    name: usersTable.name,
  }).from(usersTable).limit(5);
  
  return new Response(JSON.stringify(users), {
    headers: { 'content-type': 'application/json' },
  });
}

After implementing this stuff, our app went from crashing every weekend to actually handling real traffic. Response times dropped from 2-3 seconds to under 200ms, and we haven't had a database-related outage in 3 months.

Production Troubleshooting

Q

My Node.js app keeps running out of memory and crashing

A

What's actually happening: Memory usage climbs until the process dies with an OOM error. Connection pools look fine but something's slowly bleeding memory until everything goes to hell.

Q

"Connection terminated unexpectedly" errors are randomly killing requests

A

The fucking nightmare: Connections just die out of nowhere. Everything works fine for hours, then suddenly every query fails with "connection terminated" errors and you're left wondering what the hell happened.

What's actually broken:

Debugging Steps:

// Add detailed connection event logging
pool.on('connect', (client) => {
  console.log('New client connected:', client.processID);
});

pool.on('error', (err, client) => {
  console.error('Pool error:', err.message, 'Client:', client?.processID);
});

pool.on('remove', (client) => {
  console.log('Client removed from pool:', client.processID);
});

Solutions:

  1. Implement connection retry logic:
async function executeWithRetry<T>(
  operation: () => Promise<T>,
  maxRetries = 3,
  backoffMs = 1000
): Promise<T> {
  for (let attempt = 1; attempt <= maxRetries; attempt++) {
    try {
      return await operation();
    } catch (error: any) {
      const isConnectionError = error.code === 'ECONNRESET' || 
                              error.code === 'ENOTFOUND' ||
                              error.message.includes('Connection terminated');
      
      if (!isConnectionError || attempt === maxRetries) {
        throw error;
      }
      
      console.warn(`Connection attempt ${attempt} failed, retrying...`);
      await new Promise(resolve => setTimeout(resolve, backoffMs * attempt));
    }
  }
  throw new Error('Max retries exceeded');
}

// Wrap database calls
const users = await executeWithRetry(() => 
  db.select().from(usersTable).limit(10)
);
  1. Configure TCP keep-alive and connection validation:
const pool = new Pool({
  connectionString: process.env.DATABASE_URL,
  max: 20,
  keepAlive: true,
  keepAliveInitialDelayMillis: 10000,
  // Test connections before use
  connectionTimeoutMillis: 5000,
});
Q

My queries are slow as hell in production but blazing fast locally

A

The harsh truth: Your local database has 1000 test records that all fit in memory. Production has 10 million records, no proper indexes, and runs on a potato. No shit it's slow.

Diagnostic Approach:

  1. Enable query logging in production (temporarily):
-- PostgreSQL: Log slow queries
ALTER SYSTEM SET log_min_duration_statement = 1000; -- Log queries > 1s
SELECT pg_reload_conf();

-- View recent slow queries
SELECT 
  query,
  calls,
  total_time,
  mean_time,
  rows
FROM pg_stat_statements 
WHERE mean_time > 100  -- Queries averaging > 100ms
ORDER BY total_time DESC
LIMIT 10;
  1. Analyze query execution plans:
// Add EXPLAIN ANALYZE to troublesome queries
const result = await db.execute(sql`
  EXPLAIN (ANALYZE, BUFFERS, FORMAT JSON) 
  SELECT u.*, p.bio 
  FROM users u 
  LEFT JOIN profiles p ON u.id = p.user_id 
  WHERE u.created_at > '2024-01-01'
`);

console.log('Query plan:', JSON.stringify(result, null, 2));

Solutions:

  1. Add strategic indexes based on production query patterns:
// Analyze WHERE clauses in slow queries and add indexes
export const users = pgTable('users', {
  id: integer('id').primaryKey(),
  email: varchar('email', { length: 255 }),
  createdAt: timestamp('created_at').defaultNow(),
  isActive: boolean('is_active').default(true),
}, (table) => [
  // Compound index for common filter combinations
  index('users_active_created_idx')
    .on(table.isActive, table.createdAt.desc()),
  
  // Partial index for active users only (if most queries filter by this)
  index('users_active_email_idx')
    .on(table.email)
    .where(sql`${table.isActive} = true`),
]);
Q

Database migration locks and deadlocks in production

A

Symptoms: Migration commands hang or fail with deadlock errors, especially during zero-downtime deployments.

Root Cause: Migration operations often require table-level locks that conflict with application queries.

Safe Migration Strategy:

// production-migration.config.ts
export default defineConfig({
  dialect: 'postgresql',
  schema: './src/schema.ts',
  out: './migrations',
  dbCredentials: {
    url: process.env.DATABASE_URL!,
  },
  // Production-specific settings
  migrations: {
    schema: 'drizzle_migrations', // Separate schema for migration tracking
    table: '__migrations',
    lockTimeout: 5000,  // Fail fast on locks
  },
});

Pre-migration checks:

-- Check for long-running queries before migration
SELECT 
  pid,
  now() - pg_stat_activity.query_start AS duration,
  query 
FROM pg_stat_activity 
WHERE (now() - pg_stat_activity.query_start) > interval '5 minutes'
  AND state = 'active';

-- Check for table locks
SELECT 
  t.relname AS table_name,
  l.locktype,
  l.mode,
  l.granted,
  a.query
FROM pg_locks l
JOIN pg_stat_activity a ON l.pid = a.pid
JOIN pg_class t ON l.relation = t.oid
WHERE t.relname IN ('users', 'posts', 'orders'); -- Your critical tables

Deployment approach for zero-downtime migrations:

  1. Deploy application code that supports both old and new schema
  2. Run migrations during low-traffic periods
  3. Use techniques like ALTER TABLE ... ADD COLUMN ... DEFAULT NULL (no table rewrite)
  4. Backfill data in small batches rather than single large operations
Q

Performance degradation under load

A

When your app crumbles under any real traffic: Everything works fine until actual users show up, then response times go to shit and your connection pool gets exhausted faster than free pizza at a developer meetup.

Diagnosis:

// Monitor everything because you'll need the data when shit hits the fan
export function createLoadTestingMiddleware() {
  const activeRequests = new Map<string, number>();
  
  return (req: any, res: any, next: any) => {
    const requestId = req.headers['x-request-id'] || Math.random().toString();
    const startTime = Date.now();
    
    activeRequests.set(requestId, startTime);
    
    res.on('finish', () => {
      const duration = Date.now() - startTime;
      activeRequests.delete(requestId);
      
      console.log('Request completed:', {
        id: requestId,
        duration: `${duration}ms`,
        activeRequests: activeRequests.size,
        statusCode: res.statusCode,
      });
      
      if (duration > 5000) {  // Log slow requests
        console.warn('Slow request detected:', {
          id: requestId,
          duration: `${duration}ms`,
          path: req.path,
        });
      }
    });
    
    next();
  };
}

Solutions:

  1. Implement connection pool monitoring:
// Monitor pool health under load
setInterval(() => {
  const pool = db.$client; // Access underlying pool
  console.log('Pool stats:', {
    totalCount: pool.totalCount,
    idleCount: pool.idleCount,
    waitingCount: pool.waitingCount,
  });
  
  if (pool.waitingCount > 5) {
    console.warn('High connection wait queue detected');
  }
}, 30000);
  1. Implement circuit breaker pattern:
class DatabaseCircuitBreaker {
  private failureCount = 0;
  private lastFailureTime = 0;
  private state: 'CLOSED' | 'OPEN' | 'HALF_OPEN' = 'CLOSED';
  
  constructor(
    private failureThreshold = 5,
    private resetTimeout = 60000
  ) {}
  
  async execute<T>(operation: () => Promise<T>): Promise<T> {
    if (this.state === 'OPEN') {
      if (Date.now() - this.lastFailureTime < this.resetTimeout) {
        throw new Error('Circuit breaker is OPEN');
      }
      this.state = 'HALF_OPEN';
    }
    
    try {
      const result = await operation();
      this.onSuccess();
      return result;
    } catch (error) {
      this.onFailure();
      throw error;
    }
  }
  
  private onSuccess() {
    this.failureCount = 0;
    this.state = 'CLOSED';
  }
  
  private onFailure() {
    this.failureCount++;
    this.lastFailureTime = Date.now();
    
    if (this.failureCount >= this.failureThreshold) {
      this.state = 'OPEN';
    }
  }
}

const circuitBreaker = new DatabaseCircuitBreaker();

// Wrap critical database operations
const criticalData = await circuitBreaker.execute(() =>
  db.query.orders.findMany({ where: eq(orders.status, 'processing') })
);
Q

TypeScript compilation errors in production builds

A

Symptoms: Code works in development but fails TypeScript compilation during production build, often with complex type inference errors from Drizzle schema.

Common Causes:

  • Different TypeScript versions between development and production
  • Missing or incorrect type imports
  • Schema circular dependencies

Solutions:

  1. Pin TypeScript and Drizzle versions:
{
  "dependencies": {
    "drizzle-orm": "0.44.5"
  },
  "devDependencies": {
    "typescript": "5.5.4",
    "drizzle-kit": "0.31.4"
  },
  "engines": {
    "node": "20.x"
  }
}
  1. Simplify complex schema types:
// Instead of deeply nested inferred types
type ComplexUser = InferSelectModel<typeof users> & {
  posts: InferSelectModel<typeof posts>[];
  profile: InferSelectModel<typeof profiles>;
};

// Use explicit interfaces for better compilation
interface User {
  id: number;
  email: string;
  name: string;
}

interface UserWithPosts extends User {
  posts: Post[];
  profile: Profile | null;
}
  1. Add explicit type annotations for complex queries:
// Add explicit return types for complex queries
async function getUserWithRelations(userId: number): Promise<UserWithPosts> {
  return db.query.users.findFirst({
    where: eq(users.id, userId),
    with: {
      posts: true,
      profile: true,
    },
  }) as Promise<UserWithPosts>;
}

Related Tools & Recommendations

integration
Similar content

Hono, Drizzle, tRPC: Fast TypeScript Stack & Integration Guide

Explore the Hono, Drizzle, and tRPC stack for building fast, modern TypeScript applications. Learn how to integrate these powerful tools, avoid common pitfalls,

Hono
/integration/hono-drizzle-trpc/modern-architecture-integration
100%
compare
Recommended

I Benchmarked Bun vs Node.js vs Deno So You Don't Have To

Three weeks of testing revealed which JavaScript runtime is actually faster (and when it matters)

Bun
/compare/bun/node.js/deno/performance-comparison
82%
integration
Recommended

Vercel + Supabase + Stripe: Stop Your SaaS From Crashing at 1,000 Users

integrates with Vercel

Vercel
/integration/vercel-supabase-stripe-auth-saas/vercel-deployment-optimization
82%
tool
Similar content

Drizzle ORM Overview: The TypeScript ORM That Doesn't Suck

Discover Drizzle ORM, the TypeScript ORM that developers love for its performance and intuitive design. Learn why it's a powerful alternative to traditional ORM

Drizzle ORM
/tool/drizzle-orm/overview
71%
tool
Similar content

Express.js Production Guide: Optimize Performance & Prevent Crashes

I've debugged enough production fires to know what actually breaks (and how to fix it)

Express.js
/tool/express/production-optimization-guide
71%
tool
Similar content

Apache Cassandra: Scalable NoSQL Database Overview & Guide

What Netflix, Instagram, and Uber Use When PostgreSQL Gives Up

Apache Cassandra
/tool/apache-cassandra/overview
58%
tool
Similar content

Jenkins Production Deployment Guide: Secure & Bulletproof CI/CD

Master Jenkins production deployment with our guide. Learn robust architecture, essential security hardening, Docker vs. direct install, and zero-downtime updat

Jenkins
/tool/jenkins/production-deployment
56%
integration
Similar content

Qdrant + LangChain Production Deployment: Real-World Architecture Guide

Stop wasting money on Pinecone - here's how to deploy Qdrant without losing your sanity

Vector Database Systems (Pinecone/Weaviate/Chroma)
/integration/vector-database-langchain-production/qdrant-langchain-production-architecture
56%
integration
Similar content

MongoDB Express Mongoose Production: Deployment & Troubleshooting

Deploy Without Breaking Everything (Again)

MongoDB
/integration/mongodb-express-mongoose/production-deployment-guide
56%
tool
Recommended

Prisma - TypeScript ORM That Actually Works

Database ORM that generates types from your schema so you can't accidentally query fields that don't exist

Prisma
/tool/prisma/overview
52%
integration
Recommended

Stop Your APIs From Breaking Every Time You Touch The Database

Prisma + tRPC + TypeScript: No More "It Works In Dev" Surprises

Prisma
/integration/prisma-trpc-typescript/full-stack-architecture
52%
tool
Recommended

Prisma Cloud - Cloud Security That Actually Catches Real Threats

Prisma Cloud - Palo Alto Networks' comprehensive cloud security platform

Prisma Cloud
/tool/prisma-cloud/overview
52%
integration
Similar content

Bun React TypeScript Drizzle: Real-World Setup & Deployment

Real-world integration experience - what actually works and what doesn't

Bun
/integration/bun-react-typescript-drizzle/performance-stack-overview
50%
tool
Similar content

kubeadm - The Official Way to Bootstrap Kubernetes Clusters

Sets up Kubernetes clusters without the vendor bullshit

kubeadm
/tool/kubeadm/overview
50%
tool
Similar content

Webpack: The Build Tool You'll Love to Hate & Still Use in 2025

Explore Webpack, the JavaScript build tool. Understand its powerful features, module system, and why it remains a core part of modern web development workflows.

Webpack
/tool/webpack/overview
48%
tool
Recommended

Bun Database Integration

Built-in database drivers. No more npm package hell when Node updates.

Bun
/tool/bun/database-integration
47%
tool
Recommended

Bun - Node.js Without the 45-Minute Install Times

JavaScript runtime that doesn't make you want to throw your laptop

Bun
/tool/bun/overview
47%
tool
Recommended

Deno Deploy - Finally, a Serverless Platform That Doesn't Suck

TypeScript runs at the edge in under 50ms. No build steps. No webpack hell.

Deno Deploy
/tool/deno-deploy/overview
47%
tool
Recommended

Deno - Modern JavaScript Runtime

A secure runtime for JavaScript and TypeScript built on V8 and Rust

Deno
/tool/deno/overview
47%
integration
Recommended

Stripe Next.js Integration - Complete Setup Guide

I've integrated Stripe into Next.js projects 50+ times over 4 years. Here's the shit that'll break and how to fix it before 3am.

Stripe
/integration/stripe-nextjs/complete-integration-guide
47%

Recommendations combine user behavior, content similarity, research intelligence, and SEO optimization