Docker Setup Disasters & Quick Fixes

Q

Why won't my Docker container start?

A

Getting "docker: Error response from daemon: failed to set up container networking"

Port 8080 is taken by something else. Check what's using it:

lsof -i :8080
netstat -tulpn | grep :8080

Kill the process or change the port in your docker-compose.yml:

ports:
  - "8081:8080"  # Use 8081 instead
Q

Claude takes screenshots but won't click anything

A

This is usually a coordinate calculation problem. Check your screen resolution:

xrandr  # Linux
system_profiler SPDisplaysDataType  # macOS

Claude works best at 1280x800 resolution. Higher resolutions cause pixel calculation errors. Set your container display to this resolution:

export DISPLAY_WIDTH=1280
export DISPLAY_HEIGHT=800
Q

WSL2 Docker integration completely broken

A

Getting "Docker Desktop is not running" (even though the fucking thing is clearly running)

This WSL2 integration failure happens constantly with Docker Desktop 4.24+ on Windows 11. Fix it:

Stop Docker completely, then run this PowerShell bullshit as admin:

wsl --shutdown
wsl --unregister docker-desktop
wsl --unregister docker-desktop-data

Restart Docker Desktop and enable WSL2 integration again in Docker Desktop settings.

Q

API authentication keeps failing

A

Getting "authentication_error" even though I copy-pasted the damn key three times

Check these common causes:

  • API key has spaces/newlines (copy-paste error)
  • Using wrong environment variable name
  • Key doesn't have Computer Use beta access

Test your key directly:

curl -H "x-api-key: YOUR_KEY" \
     -H "anthropic-version: 2023-06-01" \
     -H "anthropic-beta: computer-use-2025-01-24" \
     https://api.anthropic.com/v1/messages
Q

Container displays black screen

A

VNC showing black screen or dying immediately

X11 forwarding is broken. Common fixes:

Linux users can try this:

xhost +local:docker  # Allow Docker X11 access
export DISPLAY=:0

macOS with XQuartz needs this completely different bullshit:

xhost +localhost
export DISPLAY=host.docker.internal:0

Windows users are fucked. Use Linux or macOS instead. Windows X11 forwarding is more broken than a 2003 Honda Civic.

Q

Claude gets stuck in infinite loops

A

Claude taking 100+ screenshots without doing anything useful (yeah, that's your weekend budget gone)

This happens when Claude can't find the element it's looking for. Check:

  1. Modal dialogs - Claude can't see through popups
  2. Dynamic loading - Page still loading when Claude tries to click
  3. Shadow DOM elements - Invisible to Computer Use
  4. Changed UI - Buttons moved since last working session

Add timeouts to prevent runaway costs (learned this the hard way after a $800 bill):

max_actions = 50  # Limit actions per task
action_timeout = 30  # Seconds per action
max_daily_screenshots = 1000  # Emergency brake at ~$20/day
current_screenshot_count = 0
Q

Screenshot quality is terrible

A

Screenshots look like garbage - blurry, wrong colors, cut off

Check your Docker container's display settings:

environment:
  - DISPLAY_WIDTH=1280
  - DISPLAY_HEIGHT=800
  - COLOR_DEPTH=24
  - VNC_RESIZE=scale

For better quality:

environment:
  - VNC_QUALITY=9  # Max quality
  - VNC_COMPRESSION=0  # No compression

The Complete Error Diagnostic Playbook

Computer Use Workflow

Computer Use breaks in the same five ways every damn time. Usually when you're demoing it to your boss at 2am, because of course it does.

Alright, enough bitching. Here's how to figure out what the hell broke this time when Claude stops working:

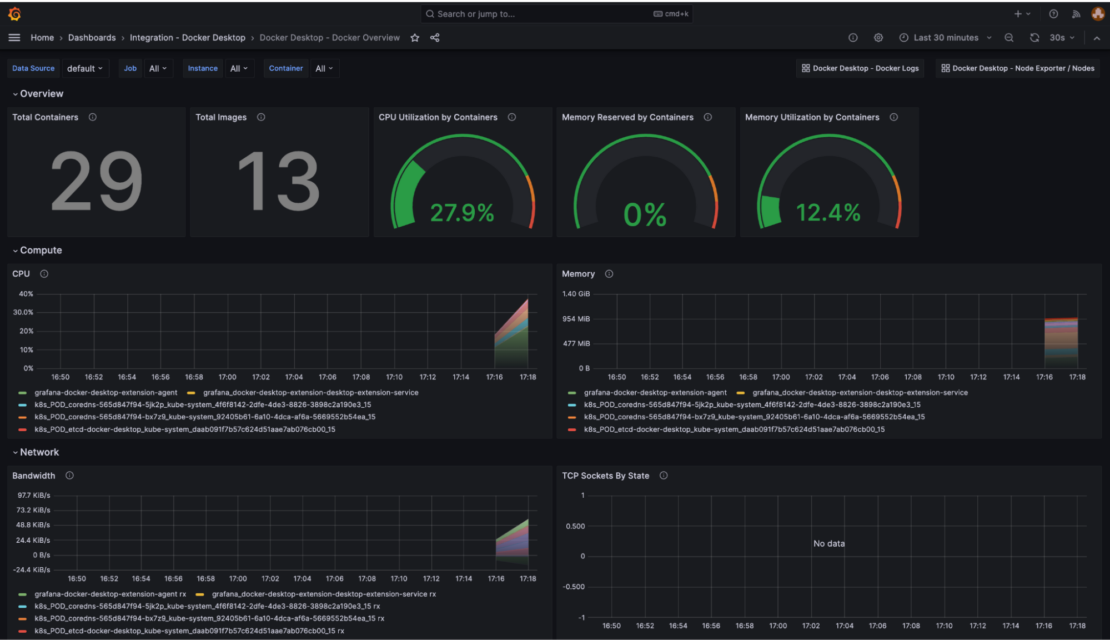
Container Health (Check This First)

Before blaming Claude, check if your Docker setup is fundamentally broken. Most "AI failures" are actually infrastructure problems.

Quick Container Diagnostic:

## Check if container is actually running
docker ps -a | grep computer-use

## Check resource usage (out of memory kills Claude)
docker stats computer-use

## Check container logs for crashes
docker logs computer-use --tail 50

## Test VNC connection directly
curl -I localhost:8080

Common Red Flags:

  • Container shows "Exited (137)" = Out of memory (the classic)
  • Container shows "Exited (125)" = Docker run error (usually port conflicts)
  • VNC returns 404 = Web server not running in container
  • High CPU usage = Stuck in screenshot loop (check your bill immediately)
  • "Error: address already in use" = Port 8080 is taken (happens with Jupyter/Django)

Network Bullshit

Computer Use needs to reach multiple endpoints. Network problems cause mysterious failures.

Test All Required Connections:

## From inside the container, test API connectivity
docker exec -it computer-use curl -I https://docs.anthropic.com/

## Test DNS resolution (corporate firewalls break this)
docker exec -it computer-use nslookup api.anthropic.com

## Check if proxy/firewall blocks Anthropic
curl -v https://docs.anthropic.com/en/api/getting-started

Corporate networks will screw you over in these predictable ways:

  • Proxy blocks api.anthropic.com (obviously)
  • SSL inspection breaks everything (classic IT)
  • DNS redirects Anthropic to security scanners (paranoid bastards)
  • Firewall blocks HTTPS on weird ports (because why make life easy?)

How to unfuck corporate networks:

## docker-compose.yml
services:
  computer-use:
    environment:
      - HTTP_PROXY=http://your-proxy:8080
      - HTTPS_PROXY=http://your-proxy:8080
      - NO_PROXY=localhost,127.0.0.1

Screenshot Analysis Problems

Claude Computer Use Screenshot Analysis

Claude's screenshot analysis fails in specific, debuggable ways. Here's how to identify vision problems.

Manual Screenshot Testing:

## Take a screenshot like Claude does
docker exec computer-use scrot /tmp/debug.png

## Copy it out for analysis
docker cp computer-use:/tmp/debug.png ./debug_screenshot.png

Visual Debugging Checklist:

  1. Resolution problems: Image should be exactly 1280x800
  2. Color issues: Check if image is grayscale (color mapping broken)
  3. Partial captures: Incomplete screenshots indicate display driver issues
  4. Font rendering: Blurry text means DPI scaling problems
  5. UI element visibility: Check if buttons/forms are actually visible

Resolution Fix:

## Force container to exact resolution
docker exec computer-use xrandr --output VNC-0 --mode 1280x800

For more X11 forwarding troubleshooting, check the display settings and VNC configuration.

API Response Analysis

When Claude sends weird responses, the API interaction is breaking down.

API Debugging Script:

import anthropic
import json
import base64

client = anthropic.Anthropic(api_key="your-key")

## Test with same screenshot Claude uses - this broke in Sept 2025 update
with open("debug_screenshot.png", "rb") as f:
    image_data = base64.b64encode(f.read()).decode()
    
## Check file size - Computer Use has 100MB limit
file_size_mb = len(image_data) * 3/4 / 1024 / 1024
if file_size_mb > 100:
    print(f"WARNING: Screenshot {file_size_mb:.1f}MB exceeds 100MB limit")

response = client.messages.create(
    model="claude-3-5-sonnet-20250109",  # Latest Computer Use model
    max_tokens=1000,
    tools=[{
        "type": "computer_20250124",  # Updated tool version
        "name": "computer",
        "display_width_px": 1280,
        "display_height_px": 800
    }],
    messages=[{
        "role": "user",
        "content": [
            {"type": "text", "text": "Take a screenshot"},
            {"type": "image", "source": {
                "type": "base64",
                "media_type": "image/png",
                "data": image_data
            }}
        ]
    }]
)

print(json.dumps(response.model_dump(), indent=2))

API Error Patterns:

  • rate_limit_error: You're hitting API limits (add delays)
  • request_too_large: Screenshot file too big (compress images)
  • invalid_request_error: Missing beta header or malformed request
  • overloaded_error: Anthropic's servers are struggling (retry with backoff)

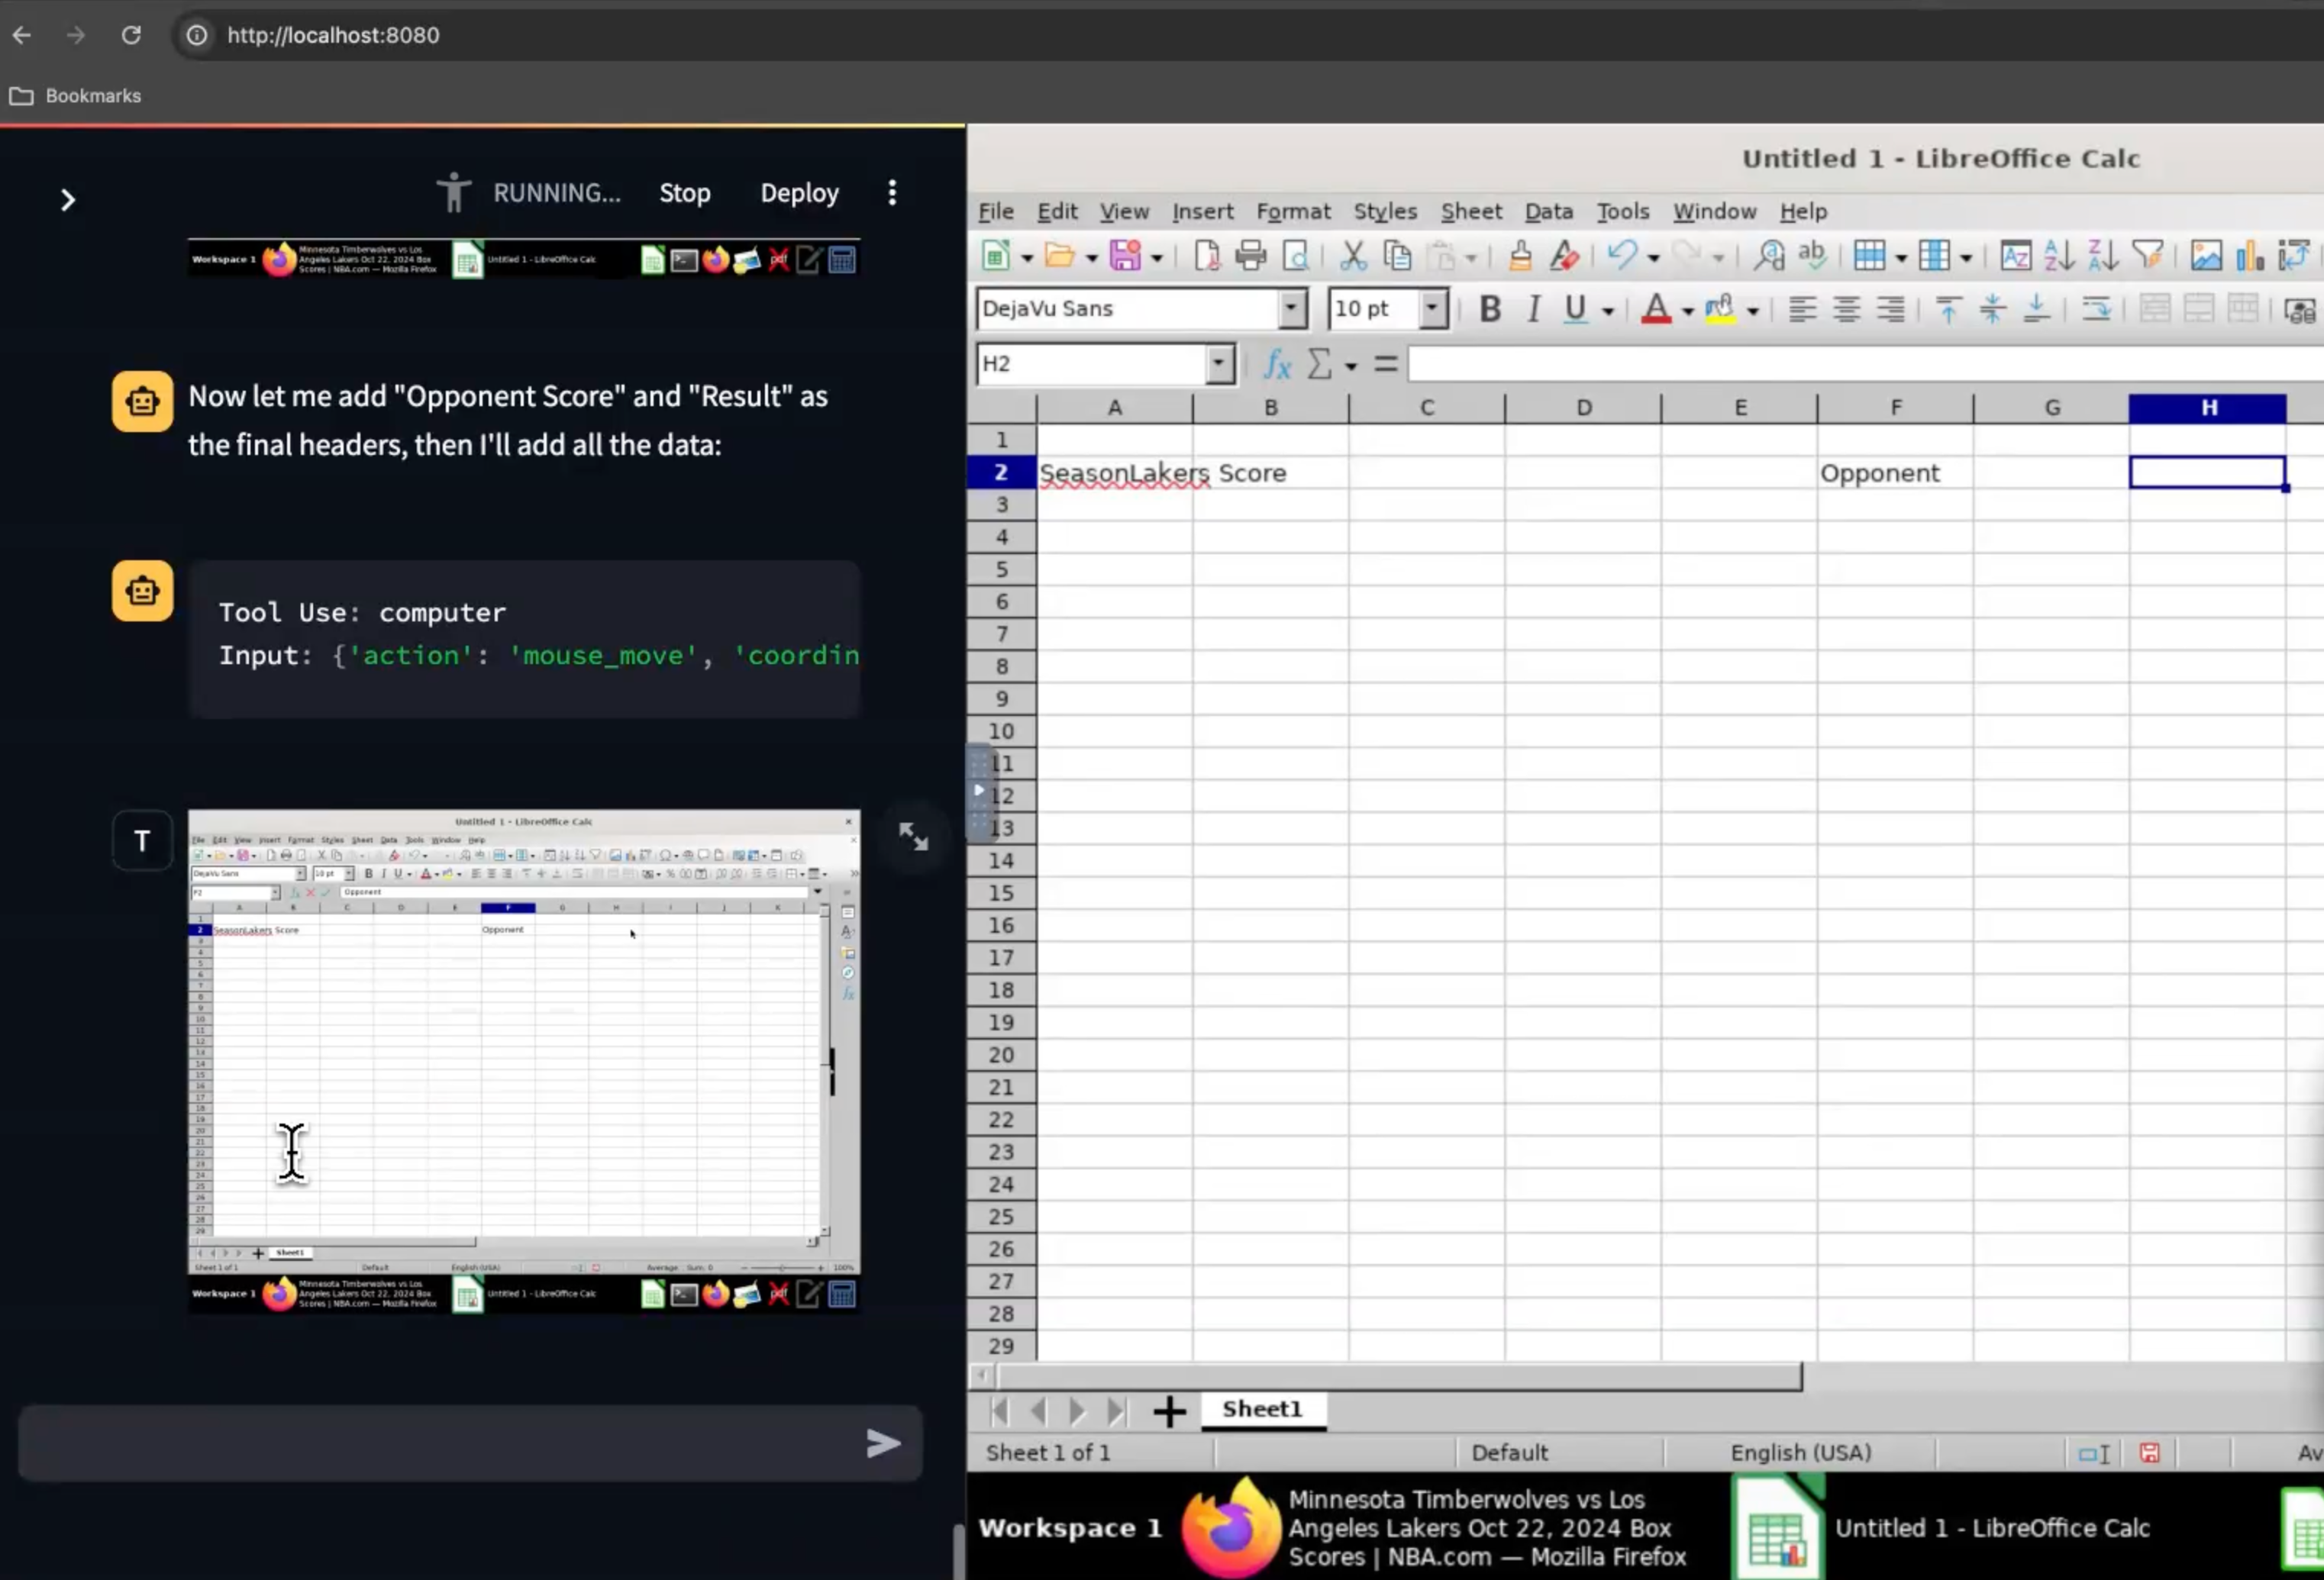
Action Execution Failures

Claude sees the screen correctly but clicks fail or do nothing.

Mouse Click Debugging:

## Test X11 mouse simulation directly
docker exec computer-use xdotool mousemove 640 400 click 1

## Check if click registered in logs
docker logs computer-use | grep -i click

## Test keyboard input
docker exec computer-use xdotool type "test input"

Click Failure Causes:

  1. Wrong window focus: Click goes to background application
  2. Coordinate offset: DPI scaling or window decoration issues
  3. Security restrictions: X11 permissions block input simulation
  4. Timing issues: UI changed between screenshot and click

Focus Debugging:

## Check which window has focus
docker exec computer-use xdotool getwindowfocus getwindowname

## Force focus to main application
docker exec computer-use xdotool search --name "Firefox" windowactivate

Cost & Performance Monitoring

Track what's actually happening vs. what you think is happening. Monitor container performance to catch issues early.

Real-time Monitoring Script:

## Monitoring script I hacked together at 3am after waking up to a $500 API bill because Claude spent 8 hours taking screenshots of a goddamn modal dialog
import time
import subprocess
from datetime import datetime

def monitor_computer_use():
    start_time = datetime.now()
    screenshot_count = 0
    
    while True:
        # Check if container is still alive
        result = subprocess.run(["docker", "ps", "-q", "-f", "name=computer-use"], 
                              capture_output=True, text=True)
        if not result.stdout.strip():
            print("CONTAINER IS DEAD")
            break
            
        # Rough cost estimate (screenshots are ~2 cents each)
        estimated_cost = screenshot_count * 0.02
        
        print(f"Runtime: {datetime.now() - start_time}")
        print(f"Screenshots: {screenshot_count}")
        print(f"Rough cost: ${estimated_cost:.2f}")
        
        if estimated_cost > 20:
            print("COSTS GETTING HIGH - CHECK WHAT'S HAPPENING")
        
        time.sleep(30)

Performance Red Flags:

  • More than 1 screenshot per 3 seconds = Loop or lag
  • Cost increasing faster than task completion = Inefficiency
  • Container CPU > 80% sustained = Resource starvation
  • Memory usage growing = Memory leak in automation code

Advanced Debugging Techniques

When basic diagnostics don't reveal the problem.

Full Request/Response Logging:

## Enable debug mode in Anthropic client
import logging
logging.basicConfig(level=logging.DEBUG)

## Log all HTTP traffic
import http.client as http_client
http_client.HTTPConnection.debuglevel = 1

X11 Event Monitoring:

## Watch all X11 events in real-time
docker exec computer-use xinput test-xi2 --root

## Monitor window events
docker exec computer-use xev | grep -E '(Button|Key|Enter|Leave)'

Screenshot Comparison Tool:

from PIL import Image, ImageChops
import numpy as np

def compare_screenshots(img1_path, img2_path):
    """Find what changed between screenshots"""
    img1 = Image.open(img1_path)
    img2 = Image.open(img2_path)
    
    diff = ImageChops.difference(img1, img2)
    
    # Convert to numpy for analysis
    diff_array = np.array(diff)
    changed_pixels = np.sum(diff_array > 10)  # Threshold for "changed"
    
    print(f"Changed pixels: {changed_pixels}")
    print(f"Change percentage: {(changed_pixels / diff_array.size) * 100:.2f}%")
    
    # Save difference image for visual inspection
    diff.save("screenshot_diff.png")

This diagnostic approach catches 90% of Computer Use problems. When you find yourself debugging for hours, step back and work through this checklist systematically. Most issues are infrastructure problems disguised as AI failures.

Advanced Problems & Real-World Solutions

Q

Claude says it clicked something but nothing happened

A

This is the classic "phantom click" problem. Claude reports successful action but the UI doesn't respond.

Root Causes:

  1. Window focus lost - Click went to wrong application
  2. Modal dialog blocking - Hidden popup intercepted the click
  3. Coordinate drift - UI element moved between screenshot and action
  4. Security policy - Application blocked simulated input

Debugging Steps:

## Check current mouse position after \"click\"
docker exec computer-use xdotool getmouselocation

## Verify which window received the click
docker exec computer-use xprop _NET_ACTIVE_WINDOW

## Test manual click at same coordinates
docker exec computer-use xdotool mousemove X Y click 1

Solution Pattern:

## Add verification after each click
def verified_click(x, y, timeout=3):
    screenshot_before = take_screenshot()
    perform_click(x, y)
    time.sleep(0.5)
    screenshot_after = take_screenshot()
    
    if screenshots_identical(screenshot_before, screenshot_after):
        raise ClickFailedException(\"UI didn't change after click\")
Q

Computer Use bills are exploding beyond budget

A

Symptom: $2000+ monthly bills when you expected $50 (welcome to AI hell)

This happens when Claude gets stuck taking expensive screenshots in loops.

Screenshots cost about 2 cents each. When Claude gets stuck in a loop taking one every second, you'll burn $500+ per day. Found this out the expensive way after leaving a broken automation running over the weekend - came back Monday to a $1,400 bill because Claude spent 48 hours taking screenshots of a modal dialog it couldn't close.

Emergency Cost Controls:

## Circuit breaker I hacked together after the third $800+ bill in two weeks
max_screenshots_per_hour = 200  # About $4/hour max
daily_limit = 50  # Kill it before it hits triple digits

def emergency_brake():
    if screenshot_count > max_screenshots_per_hour:
        print(\"STOP BURNING MONEY\")
        exit(1)

Monitoring Setup:

## Set up billing alerts in your cloud console
## AWS CloudWatch, Google Billing, or Azure Cost Management
Q

UI elements keep moving and breaking automation

A

Modern web apps are designed to break automation. Thanks, JavaScript.

Problems:

  • CSS animations move buttons during click
  • Dynamic loading changes element positions
  • Responsive design shifts layouts
  • JavaScript frameworks rerender components

Stability Strategies:

  1. Wait for animations to complete:


time.sleep(2) # Let CSS animations finish - ugly but works


2.  **Target static elements:**
    - Use text labels instead of icon buttons
    - Click form field labels, not the fields themselves
    - Target stable navigation elements

3.  **Multiple targeting attempts:**
    ```python
def robust_click(text_to_find, max_attempts=3):
    for attempt in range(max_attempts):
        try:
            screenshot = take_screenshot()
            coordinates = find_text(screenshot, text_to_find)
            click(coordinates)
            return True
        except ElementNotFoundException:
            time.sleep(1)  # Wait for dynamic content
    raise Exception(f\"Could not find {text_to_find} after {max_attempts} attempts\")
Q

Docker container runs out of memory and crashes

A

Error: Container exits with code 137 (OOMKilled)

Computer Use + VNC + browser can easily exceed default memory limits.

Memory Investigation:

## Check current memory usage
docker stats computer-use --no-stream

## Check Docker memory limits
docker inspect computer-use | grep -i memory

## Check system memory pressure
free -h

Memory Optimization:

## docker-compose.yml
services:
  computer-use:
    mem_limit: 4g
    memswap_limit: 4g
    environment:
      - VNC_MEMORY_LIMIT=2048  # Limit VNC buffer
      - BROWSER_MEMORY_LIMIT=1024  # Limit browser
Q

Authentication problems with corporate SSO

A

Claude can't log into enterprise applications

Computer Use struggles with (and so will you):

  • Multi-factor authentication (Claude can't receive SMS)
  • CAPTCHA challenges (ironically, an AI can't pass anti-AI tests)
  • OAuth redirects (breaks the automation flow)
  • Session timeouts (corporate SSO expires every 30 minutes)
  • Hardware tokens/YubiKeys (obviously)
  • Conditional access policies ("This looks suspicious")

Workaround Strategies:

  1. Pre-authenticated sessions:


Start with user already logged in

docker run -v /home/user/.config:/config computer-use


2.  **Session management:**
    ```python
def maintain_session():
    \"\"\"Keep session alive\"\"\"
    while True:
        try:
            take_screenshot()
            # Look for \"session expired\" indicators
            if find_text(screenshot, \"Sign In\"):
                trigger_human_intervention()
        except:
            time.sleep(300)  # Check every 5 minutes
  1. Human handoff points:


def handle_auth_challenge():
"""Stop automation for human intervention"""
screenshot = take_screenshot()
if any(indicator in screenshot for indicator in ["2FA", "CAPTCHA", "MFA"]):
send_notification("Human intervention required for authentication")
pause_automation()
```

Q

Claude can't handle complex multi-step workflows

A

Breaking down into reliable smaller tasks

Computer Use fails on workflows with 10+ steps. Success rate drops exponentially with task complexity.

Workflow Decomposition:

## Instead of one complex workflow
def complex_workflow():
    step1()  # 90% success
    step2()  # 90% success  
    step3()  # 90% success
    # Overall: 90%^3 = 73% success rate

## Break into independent, verifiable steps
def reliable_workflow():
    result1 = step1_with_verification()
    if not result1.success:
        retry_step1()
    
    result2 = step2_with_verification()
    if not result2.success:
        retry_step2()
        
    # Each step has 95%+ success with verification

Checkpoint Strategy:

class WorkflowCheckpoint:
    def __init__(self):
        self.completed_steps = []
        
    def save_progress(self, step_name, data):
        self.completed_steps.append({
            'step': step_name,
            'timestamp': datetime.now(),
            'data': data
        })
        
    def resume_from_failure(self):
        \"\"\"Skip already completed steps\"\"\"
        return self.completed_steps[-1] if self.completed_steps else None
Q

Performance is unacceptably slow

A

Each action takes 5-10 seconds, automation slower than humans

Performance Bottlenecks:

  1. API latency: 1-3 seconds per request
  2. Screenshot processing: Large images take time to analyze
  3. Network overhead: Upload/download screenshot data
  4. UI response time: Waiting for page loads

Optimization Techniques:

## Reduce screenshot resolution for speed
FAST_RESOLUTION = (800, 600)  # Instead of (1280, 800)

## Batch actions when possible
def batch_text_input(text_chunks):
    \"\"\"Type all text at once instead of character by character\"\"\"
    full_text = \"\".join(text_chunks)
    type_text(full_text)

## Cache common UI states
screenshot_cache = {}
def cached_screenshot_analysis(screenshot_hash):
    if screenshot_hash in screenshot_cache:
        return screenshot_cache[screenshot_hash]
    # ... analysis logic

Speed vs. Accuracy Tradeoffs:

  • Lower resolution = faster but less accurate clicking
  • Fewer verification screenshots = faster but more failures
  • Reduced delays = faster but more race conditions

Most users find 70% accuracy at 2x speed better than 90% accuracy at 1x speed for repetitive tasks.

Error Types & Solutions Matrix

Error Category

Symptom

Root Cause

Quick Fix

Long-term Solution

Container Won't Start

docker: Error response from daemon

Port conflicts, networking

Change ports, restart Docker

Use docker-compose with proper networking

Authentication Fails

401 authentication_error

Invalid API key, missing beta header

Check key format, add beta header

Proper secrets management

Black VNC Screen

Empty desktop, no GUI

X11 forwarding broken

Restart container with correct DISPLAY

Configure X11 properly for your OS

Click Coordinates Wrong

Claude clicks wrong locations

Resolution mismatch, DPI scaling

Set container to 1280x800

Use consistent display settings

API Rate Limits

429 rate_limit_error

Too many requests

Add delays between calls

Implement proper rate limiting

Screenshot Loops

Hundreds of identical screenshots

UI element not found, infinite retry

Kill container, check UI state

Add loop detection and timeouts

Out of Memory

Container exits code 137

Memory limit exceeded

Increase Docker memory limit

Optimize memory usage, monitor resources

Slow Performance

10+ seconds per action

Large screenshots, API latency

Reduce resolution, batch operations

Implement caching and optimization

WSL2 Integration

Docker not accessible

Windows-specific networking issue

Restart WSL2, reconfigure Docker

Use Linux or macOS instead

SSL/TLS Errors

Certificate validation fails

Corporate firewall, proxy

Configure proxy settings

Work with IT for proper certificates

Production Monitoring & Maintenance Guide

Docker Monitoring Dashboard

Computer Use in production needs constant monitoring because it breaks more than my hopes and dreams. Here's what actually breaks in production and how to catch problems before they destroy your automation.

Essential Monitoring Stack

Most teams underestimate what needs monitoring. You're not just running an AI - you're running a complex system with multiple failure points that all love to break independently. Docker monitoring best practices and container observability are essential for production deployments.

Infrastructure Monitoring:

## docker-compose.monitoring.yml
version: '3.8'
services:
  computer-use:
    # Your main service
    
  prometheus:
    image: prom/prometheus
    ports:
      - "9090:9090"
    volumes:
      - ./prometheus.yml:/etc/prometheus/prometheus.yml
      
  grafana:
    image: grafana/grafana
    ports:
      - "3000:3000"
    environment:
      - GF_SECURITY_ADMIN_PASSWORD=your_password

Critical Metrics to Track:

  1. Container Health: CPU, memory, restart count (cAdvisor integration)
  2. API Costs: Tokens used per hour, cost per task completion (Anthropic API usage)
  3. Success Rates: Task completion percentage, error patterns (Prometheus monitoring)
  4. Performance: Screenshot processing time, action latency (Grafana dashboards)
  5. Resource Usage: Disk space (logs grow fast), network bandwidth (Docker stats monitoring)

Set up alerts for the shit that actually matters (learned this after three 3am pages):

## prometheus-alerts.yml
groups:
  - name: computer_use_alerts
    rules:
      - alert: HighAPISpend
        expr: api_cost_per_hour > 20  # $20/hour = $480/day. Trust me, set this lower
        for: 5m
        annotations:
          summary: "API costs spiking - possible loop"
          
      - alert: LowSuccessRate  
        expr: task_success_rate < 0.7  # Below 70% means something changed
        for: 15m
        annotations:
          summary: "Success rate dropping - investigate UI changes"
          
      - alert: ContainerRestarting
        expr: increase(container_restarts[1h]) > 3
        annotations:
          summary: "Container unstable - check logs"

Log Analysis for Computer Use

Computer Use generates tons of logs, most of them useless. Here's what actually indicates problems. Docker logging best practices and log aggregation strategies help manage the volume.

Log Patterns That Signal Issues:

## Screenshot failures
grep "Failed to capture screenshot" /var/log/computer-use.log

## API errors  
grep -E "(rate_limit|authentication_error|overloaded)" /var/log/computer-use.log

## Click failures
grep "Click had no effect" /var/log/computer-use.log

## Memory pressure
grep -i "out of memory\|oom" /var/log/computer-use.log

Useful Log Analysis Script:

import re
from datetime import datetime, timedelta
from collections import defaultdict

def analyze_computer_use_logs(log_file):
    """Extract actionable insights from Computer Use logs"""
    
    error_counts = defaultdict(int)
    performance_metrics = []
    cost_tracking = []
    
    with open(log_file, 'r') as f:
        for line in f:
            # Extract timestamp
            timestamp_match = re.search(r'(\d{4}-\d{2}-\d{2} \d{2}:\d{2}:\d{2})', line)
            if not timestamp_match:
                continue
                
            timestamp = datetime.strptime(timestamp_match.group(1), '%Y-%m-%d %H:%M:%S')
            
            # Track API errors
            if 'rate_limit_error' in line:
                error_counts['rate_limit'] += 1
            elif 'authentication_error' in line:
                error_counts['auth_failure'] += 1
            elif 'screenshot_failed' in line:
                error_counts['screenshot_fail'] += 1
                
            # Track performance
            perf_match = re.search(r'Screenshot processing: (\d+)ms', line)
            if perf_match:
                performance_metrics.append(int(perf_match.group(1)))
                
            # Track costs (approximate)
            if 'Screenshot taken' in line:
                cost_tracking.append(timestamp)
    
    # Generate report
    print(f"Error Summary (last 24h):")
    for error_type, count in error_counts.items():
        print(f"  {error_type}: {count}")
        
    if performance_metrics:
        avg_perf = sum(performance_metrics) / len(performance_metrics)
        print(f"Average screenshot processing: {avg_perf:.0f}ms")
        
    # Estimate daily costs (rough numbers based on getting burned multiple times)
    screenshots_today = len([t for t in cost_tracking if t > datetime.now() - timedelta(days=1)])
    estimated_cost = screenshots_today * 0.0045  # ~$0.0045 per screenshot, varies by model
    print(f"Estimated daily cost: ${estimated_cost:.2f}")
    if estimated_cost > 50:
        print("🚨 DAILY COSTS HIGH - CHECK FOR LOOPS")

Failure Pattern Recognition

Computer Use fails the same way every damn time. Catch these patterns early or spend your weekend rebuilding everything.

Pattern 1: The Screenshot Death Spiral

10:15 - Screenshot taken (normal)
10:15 - Click attempted at (645, 400)
10:16 - Screenshot taken (UI unchanged)
10:16 - Click attempted at (645, 400)
10:16 - Screenshot taken (UI unchanged)
... repeats 500 times

Early Detection:

def detect_screenshot_spiral(recent_actions):
    """Detect if Claude is stuck in a loop"""
    if len(recent_actions) < 10:
        return False
        
    # Check for repeated identical coordinates
    recent_clicks = [a for a in recent_actions if a.type == 'click']
    if len(recent_clicks) >= 5:
        coords = [(a.x, a.y) for a in recent_clicks[-5:]]
        if len(set(coords)) == 1:  # All same coordinate
            return True
            
    # Check for no UI changes
    recent_screenshots = [a for a in recent_actions if a.type == 'screenshot']
    if len(recent_screenshots) >= 3:
        if all_screenshots_identical(recent_screenshots[-3:]):
            return True
            
    return False

Pattern 2: Resource Exhaustion Cascade

Memory usage: 85% -> 92% -> 98% -> Container killed
Container restart -> Memory usage: 85%...

Prevention:

## Set up memory monitoring with automatic restart
#!/bin/bash
while true; do
    MEMORY_USAGE=$(docker stats computer-use --no-stream --format "{{.MemPerc}}" | sed 's/%//')
    if (( $(echo "$MEMORY_USAGE > 90" | bc -l) )); then
        echo "Memory usage at ${MEMORY_USAGE}% - restarting before it gets killed"
        docker restart computer-use
        sleep 60  # Let it stabilize
    fi
    sleep 30
done

Pattern 3: API Cost Explosion

Normal usage: $15/day
Day 1: $150 (10x spike - loop detected)
Day 2: $600 (still running unchecked)
Day 3: $1500 (credit card melting)

Cost Circuit Breaker:

class CostCircuitBreaker:
    def __init__(self, daily_limit=50):
        self.daily_limit = daily_limit
        self.daily_spend = 0
        self.last_reset = datetime.now().date()
        
    def check_spend(self, action_cost):
        today = datetime.now().date()
        if today != self.last_reset:
            self.daily_spend = 0
            self.last_reset = today
            
        if self.daily_spend + action_cost > self.daily_limit:
            raise Exception(f"Daily cost limit ${self.daily_limit} exceeded")
            
        self.daily_spend += action_cost
        return True

Maintenance Procedures

Computer Use deployments need regular maintenance. Infrastructure drift kills automation reliability. Follow Docker security best practices and container lifecycle management to prevent issues.

Weekly Maintenance Checklist:

#!/bin/bash
## weekly_maintenance.sh

echo "=== Computer Use Weekly Maintenance ==="

## 1. Check Docker container health
echo "Checking container health..."
docker inspect computer-use --format='{{.State.Health.Status}}'

## 2. Clean up screenshots and logs
echo "Cleaning up old files..."
docker exec computer-use find /tmp -name "*.png" -mtime +7 -delete
docker logs computer-use > /dev/null  # Reset logs

## 3. Check API key validity
echo "Testing API connection..."
curl -H "x-api-key: $ANTHROPIC_API_KEY" \
     -H "anthropic-version: 2023-06-01" \
     -H "anthropic-beta: computer-use-2025-01-24" \
     https://api.anthropic.com/v1/messages

## 4. Update container if needed
echo "Checking for updates..."
docker pull anthropic/computer-use:latest

## 5. Validate resolution settings
echo "Checking display resolution..."
docker exec computer-use xrandr | grep "1280x800"

## 6. Test basic functionality
echo "Running smoke test..."
python3 smoke_test.py

echo "Maintenance complete"

Monthly Deep Maintenance:

  1. Performance Review: Analyze success rates and identify degradation
  2. Cost Analysis: Review API spending patterns and optimize
  3. Security Updates: Update Docker images, check for vulnerabilities
  4. Configuration Drift: Verify settings haven't changed
  5. Backup Validation: Test restore procedures for configuration

Disaster Recovery Procedures

When Computer Use breaks catastrophically, you need tested recovery procedures.

Recovery Runbook:

### Computer Use Emergency Recovery

#### Step 1: Stop the bleeding (< 5 minutes)
- [ ] Stop all Computer Use containers: `docker stop computer-use`
- [ ] Check API spend in last hour: `curl anthropic-usage-api`
- [ ] If costs spiking: Disable API key temporarily

#### Step 2: Assess damage (< 15 minutes)  
- [ ] Check container logs: `docker logs computer-use --tail 100`
- [ ] Check system resources: `docker stats`, `df -h`, `free -h`
- [ ] Identify error pattern from logs
- [ ] Document what was happening when it failed

#### Step 3: Restore service (< 30 minutes)
- [ ] Fresh container from known-good image
- [ ] Restore last known-good configuration  
- [ ] Test with simple task before resuming automation
- [ ] Monitor closely for repeat failures

#### Step 4: Post-incident (< 2 hours)
- [ ] Root cause analysis from logs
- [ ] Update monitoring to catch this failure type
- [ ] Document lessons learned
- [ ] Review if automation should be redesigned

Backup Strategy:

## Daily configuration backup
#!/bin/bash
DATE=$(date +%Y%m%d)
BACKUP_DIR="/backups/computer-use-$DATE"

mkdir -p $BACKUP_DIR

## Backup configurations
cp docker-compose.yml $BACKUP_DIR/
cp .env $BACKUP_DIR/
docker exec computer-use tar czf - /config > $BACKUP_DIR/container-config.tar.gz

## Backup working automation scripts
cp -r automation-scripts/ $BACKUP_DIR/

## Test backup validity
tar -tzf $BACKUP_DIR/container-config.tar.gz > /dev/null
echo "Backup completed: $BACKUP_DIR"

Key Recovery Insight: Most Computer Use "disasters" are actually infrastructure problems. The AI part usually works fine - it's Docker, networking, or configuration that breaks. Focus recovery efforts on the infrastructure first, then worry about the AI behavior. Review disaster recovery patterns and backup strategies regularly.

Production Computer Use is 20% AI debugging and 80% infrastructure management. Plan accordingly. Consider container orchestration for larger deployments.

Essential Debugging Resources & Tools

Related Tools & Recommendations

tool
Similar content

MCP Production Troubleshooting Guide: Fix Server Crashes & Errors

When your MCP server crashes at 3am and you need answers, not theory. Real solutions for the production disasters that actually happen.

Model Context Protocol (MCP)
/tool/model-context-protocol/production-troubleshooting-guide
100%
pricing
Similar content

AI API Pricing Reality Check: Claude, OpenAI, Gemini Costs

No bullshit breakdown of Claude, OpenAI, and Gemini API costs from someone who's been burned by surprise bills

Claude
/pricing/claude-vs-openai-vs-gemini-api/api-pricing-comparison
96%
tool
Similar content

Claude Enterprise - Is It Worth $50K? A Reality Check

Is Claude Enterprise worth $50K? This reality check uncovers true value, hidden costs, and the painful realities of enterprise AI deployment. Prepare for rollou

Claude Enterprise
/tool/claude-enterprise/enterprise-deployment
88%
tool
Similar content

Clair Production Monitoring: Debug & Optimize Vulnerability Scans

Debug PostgreSQL bottlenecks, memory spikes, and webhook failures before they kill your vulnerability scans and your weekend. For teams already running Clair wh

Clair
/tool/clair/production-monitoring
83%
tool
Similar content

Aqua Security Troubleshooting: Resolve Production Issues Fast

Real fixes for the shit that goes wrong when Aqua Security decides to ruin your weekend

Aqua Security Platform
/tool/aqua-security/production-troubleshooting
73%
tool
Similar content

Pinecone Production Architecture: Fix Common Issues & Best Practices

Shit that actually breaks in production (and how to fix it)

Pinecone
/tool/pinecone/production-architecture-patterns
63%
tool
Similar content

AWS AI/ML Troubleshooting: Debugging SageMaker & Bedrock in Production

Real debugging strategies for SageMaker, Bedrock, and the rest of AWS's AI mess

Amazon Web Services AI/ML Services
/tool/aws-ai-ml-services/production-troubleshooting-guide
61%
tool
Similar content

OrbStack Performance Troubleshooting: Fix Issues & Optimize

Troubleshoot common OrbStack performance issues, from file descriptor limits and container startup failures to M1/M2/M3 Mac performance and VirtioFS optimizatio

OrbStack
/tool/orbstack/performance-troubleshooting
53%
tool
Recommended

Python Selenium - Stop the Random Failures

3 years of debugging Selenium bullshit - this setup finally works

Selenium WebDriver
/tool/selenium/python-implementation-guide
53%
tool
Recommended

Selenium - Browser Automation That Actually Works Everywhere

The testing tool your company already uses (because nobody has time to rewrite 500 tests)

Selenium WebDriver
/tool/selenium/overview
53%
tool
Recommended

Playwright - Fast and Reliable End-to-End Testing

Cross-browser testing with one API that actually works

Playwright
/tool/playwright/overview
53%
compare
Recommended

Playwright vs Cypress - Which One Won't Drive You Insane?

I've used both on production apps. Here's what actually matters when your tests are failing at 3am.

Playwright
/compare/playwright/cypress/testing-framework-comparison
53%
tool
Similar content

OpenAI Realtime API Overview: Simplify Voice App Development

Finally, an API that handles the WebSocket hell for you - speech-to-speech without the usual pipeline nightmare

OpenAI Realtime API
/tool/openai-gpt-realtime-api/overview
51%
tool
Similar content

Llama.cpp Overview: Run Local AI Models & Tackle Compilation

C++ inference engine that actually works (when it compiles)

llama.cpp
/tool/llama-cpp/overview
51%
tool
Recommended

Power Automate: Microsoft's IFTTT for Office 365 (That Breaks Monthly)

competes with Microsoft Power Automate

Microsoft Power Automate
/tool/microsoft-power-automate/overview
50%
review
Recommended

Power Automate Review: 18 Months of Production Hell

What happens when Microsoft's "low-code" platform meets real business requirements

Microsoft Power Automate
/review/microsoft-power-automate/real-world-evaluation
50%
troubleshoot
Similar content

Kubernetes Network Troubleshooting Guide: Fix Common Issues

When nothing can talk to anything else and you're getting paged at 2am on a Sunday because someone deployed a \

Kubernetes
/troubleshoot/kubernetes-networking/network-troubleshooting-guide
48%
tool
Similar content

Hemi Network Bitcoin Integration: Debugging Smart Contract Issues

What actually breaks when you try to build Bitcoin-aware smart contracts

Hemi Network
/tool/hemi/debugging-bitcoin-integration
48%
tool
Popular choice

jQuery - The Library That Won't Die

Explore jQuery's enduring legacy, its impact on web development, and the key changes in jQuery 4.0. Understand its relevance for new projects in 2025.

jQuery
/tool/jquery/overview
48%
tool
Similar content

Atlassian Confluence Performance Troubleshooting: Fix Slow Issues & Optimize

Fix Your Damn Confluence Performance - The Guide That Actually Works

Atlassian Confluence
/tool/atlassian-confluence/performance-troubleshooting-guide
46%

Recommendations combine user behavior, content similarity, research intelligence, and SEO optimization