Currently viewing the human version
Switch to AI version

The Fucking Profiler - Your First Line of Defense Against Shitty Queries

Last month our MongoDB cluster shit itself at 2 AM because someone decided to run an aggregation pipeline on millions of documents without a single index. The query took forever - maybe 50 seconds? - and brought down our entire API. This is why you need the profiler enabled before disasters happen, not after.

MongoDB Architecture Overview

Turn On The Profiler Before Everything Breaks

The profiler is off by default because MongoDB thinks you don't need it. You do. Turn it on right now:

db.setProfilingLevel(1, { slowms: 100 })

Three levels of pain:

  • Level 0: Off (stupid default setting)
  • Level 1: Only log slow shit (what you want)
  • Level 2: Log everything (will destroy your disk space in minutes)

Level 2 is basically a DoS attack on your own database. I learned this the hard way when it filled up like 200GB super fast and crashed the cluster.

Check if it's actually running:

db.getProfilingStatus()

Reading the Tea Leaves (Profile Data)

The profiler dumps everything into db.system.profile. Here's how to find the queries that are ruining your life using MongoDB's profiling system:

db.system.profile.find()
  .limit(5)
  .sort({ millis: -1 })
  .pretty()

What to look for:

  • millis: How long your query took to suck
  • planSummary: Did it use an index or scan the whole fucking collection
  • docsExamined: How many docs it looked at
  • docsReturned: How many it actually needed
  • ts: When this clusterfuck happened

If docsExamined is way higher than docsReturned, you're doing collection scans. That's bad. Really bad.

explain() - The Query Autopsy Tool

Before you run a scary query, use `explain()` to see what MongoDB plans to do:

db.orders.find({ status: \"shipped\", customer_id: ObjectId(\"...\") })
  .explain(\"executionStats\")

MongoDB Connection Pool Diagram

Critical shit to check:

  • totalDocsExamined: If this is huge, you're fucked
  • totalDocsReturned: What you actually needed
  • executionTimeMillis: How long it took to fail
  • COLLSCAN vs IXSCAN: Collection scan = bad, index scan = good

I once found a query that scanned millions of documents to return 3 results. The efficiency was fucking terrible - like examining hundreds of thousands of docs for each result. That's not efficiency, that's incompetence.

MongoDB Query Performance Analysis

MongoDB Version Hell - The 7.0 Disaster

MongoDB 7.0 has a nasty performance bug that reduces concurrent transactions from 128 to about 8. This destroyed performance for everyone who upgraded without reading the fine print. The MongoDB release notes barely mention this regression.

The emergency fix for 7.0:

db.adminCommand({
  setParameter: 1,
  storageEngineConcurrentWriteTransactions: 128,
  storageEngineConcurrentReadTransactions: 128
})

MongoDB 8.0 fixes this shit, but upgrading has its own problems. Test in staging first or you'll be the one getting calls at 3 AM. Check the MongoDB 8.0 compatibility guide before upgrading.

Atlas Performance Advisor (Actually Useful)

Atlas has a Performance Advisor that automatically finds your shitty queries and suggests fixes. It's actually pretty good, unlike most MongoDB tooling.
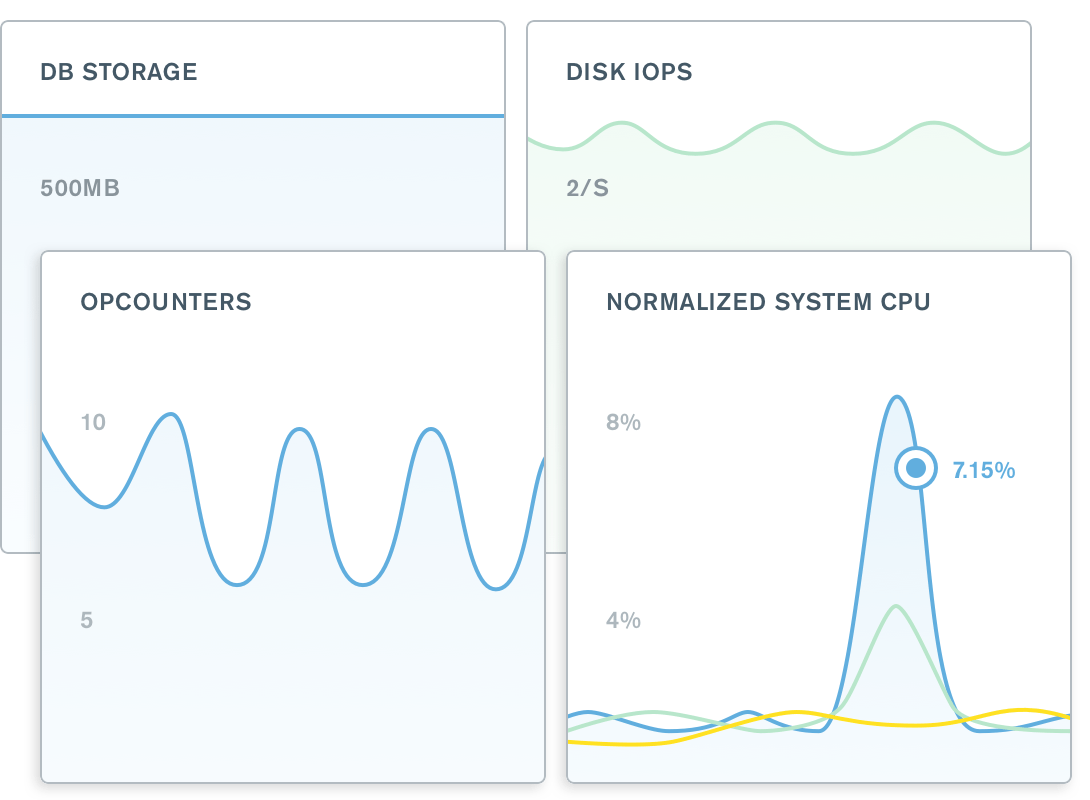
MongoDB Atlas Performance Metrics

It tells you:

  • Which queries are slow as hell
  • What indexes would fix them
  • How much performance you'd gain
  • Which indexes you created but never use

The best part? It runs automatically. No need to remember to check it while you're fighting fires.

Production War Stories

The Atlas Bill From Hell: A developer created a text index on a huge collection in production. Took like 18 hours to build and the compute bill was brutal - I think around 15 grand. The index was for a search feature that never shipped.

The Collection Scan From Hell: db.users.find({}) on millions and millions of documents. No limit, no index, just raw stupidity. It ran for hours before I killed it. The developer said "it worked fine in dev" (which had like 10 users).

The Aggregation Pipeline of Doom: Someone wrote this insane multi-stage aggregation that did a $lookup on every document. MongoDB tried to load way too much into memory and crashed the primary. Took forever to failover and recover.

The Connection Pool Massacre: Application was creating new connections for every request instead of using a pool. Hit the connection limit and new users couldn't log in. The fix was changing one line of code.

Tools That Actually Work

MongoDB Compass: Free, official, doesn't crash every 5 minutes. Visual explain plans make it easy to see why your queries suck. The Compass documentation covers performance features.

Studio 3T: Costs money but worth every penny. Better profiling, query optimization, and doesn't have Compass's random crashes. Their performance troubleshooting guide is excellent.

Skip NoSQLBooster: Used to be good, now it's buggy and slow. Compass does everything you need for free.

The profiler will save your ass, but only if you actually use it. Turn it on now, before you need it. Trust me on this one.

Once you've identified your slow queries, the next step is fixing them with proper indexes. Most performance disasters come from missing indexes, wrong index field order, or having too many unused indexes that slow down writes. The profiler shows you which queries are broken - indexes are how you fix them.

MongoDB Index Types: The Good, The Bad, and The "This Will Destroy Your Write Performance"

Index Type

When It's Awesome

When It Sucks

Storage Cost

Write Performance Hit

War Stories

Single Field

Simple lookups (user_id, email)

Never query this field alone

~10% of collection

Almost none

Created way too many of these once. Still regret it.

Compound

Multi-field queries, ESR rule

Wrong field order = useless

15-25% of collection

Moderate pain

Spent way too long debugging why my 3-field index wasn't working. Field order was backwards.

Text

Full-text search when you can't use Elasticsearch

Everything else. Seriously.

30-50% of collection

RIP your writes

Text index on huge collection took like 18 hours and cost way too much. Feature never shipped.

Geospatial (2dsphere)

Location queries, "find nearby"

Non-location data (obviously)

15-25% of collection

Not terrible

Works great until you try to index altitude. Don't do 3D geo.

TTL

Auto-expiring sessions, logs

Permanent data (duh)

Almost nothing

Background cleanup overhead

Set TTL to 60 seconds instead of 3600. Deleted live user sessions. Oops.

Sparse

Optional fields with lots of nulls

Dense fields (defeats the purpose)

Much lower

Actually helps writes

Only index that makes writes faster. Use it.

Partial

Filtered datasets (status="active")

Complex filter expressions

Way lower

Better writes

Filter was too complex, optimizer ignored it. Scanned anyway.

Hashed

Sharding shard keys

Range queries, sorting

Same as single field

Standard

Perfect for sharding. Useless for everything else.

Production Infrastructure - Where MongoDB Performance Goes to Die

The WiredTiger cache is where your performance lives or dies. Get it wrong and your queries will crawl. I've crashed production clusters by misconfiguring memory settings, run up cloud bills that made accounting call emergency meetings, and spent entire nights debugging connection pool exhaustion. Here's what actually matters based on WiredTiger storage engine documentation.

MongoDB Connection Pool Management

WiredTiger Cache - The Most Important Setting You'll Fuck Up

WiredTiger defaults to 50% of RAM minus 1GB for its cache. This is conservative bullshit for dedicated MongoDB servers. Bump it to 70-80% or watch your disk I/O spike to hell. The WiredTiger cache configuration guide explains the options:

// Set cache to most of your RAM on a dedicated server (don't be conservative)
db.adminCommand({
  setParameter: 1,
  "wiredTigerEngineConfigString": "cache_size=20GB"
})

Don't fuck around with checkpoint intervals unless you know what you're doing. I changed it from 60 to 30 seconds once and corrupted data during a power outage. The default works fine.

MongoDB 7.0 - The Version That Broke Everything

MongoDB 7.0 has a performance regression that nobody talks about. Concurrent transactions dropped from 128 to 8, destroying throughput for anyone who upgraded without reading JIRA tickets.

The emergency hotfix for 7.0:

db.adminCommand({
  setParameter: 1,
  storageEngineConcurrentWriteTransactions: 128,
  storageEngineConcurrentReadTransactions: 128
})

MongoDB 8.0 is better but upgrading is still Russian roulette. I've seen 36% performance improvements and 50% performance regressions on the same hardware. Test in staging or prepare for weekend debugging sessions. The MongoDB 8.0 upgrade guide covers the process.

Connection Pool Hell

Every MongoDB performance disaster I've debugged involved connection problems. Your application creates connections, MongoDB runs out of memory managing them, everything crashes.

MongoDB Atlas Performance Monitoring

Application-side limits (or your app will die):

Server-side reality check:

// Check current connections (do this now)
db.serverStatus().connections

// Max connections before everything breaks
net:
  maxIncomingConnections: 2000

Connection monitoring saved my ass: Atlas shows connection graphs. Watch for spikes that correlate with application deployments. One time we had thousands of connections from a single microservice with broken pooling.

Aggregation Pipeline Disasters

Aggregation pipelines are where junior developers go to commit performance crimes. I've seen 40-stage pipelines that tried to load 100GB into memory and crashed replica sets.

The $match rule (violate and suffer):

// Good - filter early, process less
db.orders.aggregate([
  { $match: { status: "completed", date: { $gte: lastMonth } } },  // Filter first
  { $lookup: { from: "customers", ... } },                        // Join smaller dataset
  { $group: { _id: "$customer_id", total: { $sum: "$amount" } } }, // Group fewer docs
  { $sort: { total: -1 } }                                       // Sort final results
])

// Bad - join everything then filter (performance suicide)
db.orders.aggregate([
  { $lookup: { from: "customers", ... } },          // Join 50M documents
  { $group: { ... } },                              // Group everything
  { $match: { status: "completed" } },              // Filter after the damage is done
  { $sort: { total: -1 } }
])

Memory limits are real: MongoDB kills aggregations that use over 100MB of RAM. Use allowDiskUse: true for large operations, but expect them to be slow as shit. The aggregation memory limits documentation explains the restrictions:

db.orders.aggregate([
  // Complex pipeline that needs tons of memory
], { allowDiskUse: true, maxTimeMS: 300000 })

Hardware Reality Check

Storage (SSDs or GTFO):

  • Spinning disks: Good for backups, terrible for MongoDB
  • SATA SSDs: Minimum acceptable performance
  • NVMe SSDs: What you actually want for production
  • Cloud storage: EBS gp3 works, EFS will destroy your soul

CPU (More cores = better concurrency):

  • 4 cores: Fine for small applications
  • 8 cores: Sweet spot for most workloads
  • 16+ cores: Needed for write-heavy or analytical queries
  • Clock speed matters: Single queries can't use multiple cores

Memory (RAM is everything):

  • Working set must fit in cache: If it doesn't, performance dies
  • Indexes must fit in memory: Non-negotiable rule
  • Atlas M10/M20: Shared instances, performance is unpredictable
  • Atlas M30+: Dedicated instances, much better performance

Production Monitoring (Or You'll Be Debugging Blind)

Metrics that actually matter:

  • Query time p95: Should be under 100ms (anything higher and users complain)
  • Index hit ratio: Above 95% or you're doing collection scans
  • Connection count: Track connection leaks before they kill you
  • Replication lag: Keep under 2 seconds or secondaries become useless
  • WiredTiger cache hit ratio: Should be above 95%

MongoDB System Architecture

Tools that don't suck:

Atlas Auto-Scaling Horror Stories

The Brutal Auto-Scale Bill: Auto-scaling kicked in during a traffic spike and scaled up to massive instances. Bill was like 30 grand for one week. Set upper limits or your CFO will murder you.

The Scale-Up Death Spiral: Application had a memory leak. Atlas kept scaling up instead of fixing the leak. Reached huge instances before someone noticed the application was broken.

Read Preferences Gotcha: Used readPreference: "secondary" for reporting. Worked great until the secondary lagged 30 minutes behind and reports showed old data. Users thought the system was broken.

// Use secondary for reports (but check lag first)
db.orders.find().readPref("secondaryPreferred", [{ maxStalenessSeconds: 120 }])

Atlas Tier Reality

  • M10-M30: Shared instances, performance varies by noisy neighbors
  • M40-M60: Dedicated instances, predictable performance
  • M80+: Serious performance, serious money
  • M700: For when you have more money than sense

Atlas pricing reality (as of 2025):

  • M10: ~$60/month, 2GB RAM, shared CPU - fine for development
  • M30: ~$285/month, 8GB RAM, shared CPU - minimum for small production
  • M50: ~$580/month, 16GB RAM, dedicated - where most businesses end up
  • M80: Over $1000/month, 32GB RAM - serious applications
  • M200: Several thousand per month, 64GB RAM - you're probably over-paying

Check the current Atlas pricing page for exact costs and cluster tier comparison.

Production disaster checklist:

  1. WiredTiger cache hit ratio: Should be >95%, check db.serverStatus().wiredTiger.cache
  2. Connection spike detection: Monitor db.serverStatus().connections.current
  3. Collection scan detection: db.system.profile.find({"planSummary": /COLLSCAN/}).count()
  4. Replication lag monitoring: rs.status().members[].optimeDate differences
  5. Atlas auto-scaling limits: Set max cluster size or prepare for surprise bills
  6. Index utilization: db.collection.aggregate([{$indexStats: {}}]) - drop unused indexes

Advanced WiredTiger Tuning for Production

Beyond the basic cache settings, these parameters matter for high-load systems:

// Checkpoint frequency (don't touch unless you know what you're doing)
db.adminCommand({
  setParameter: 1,
  "wiredTigerEngineConfigString": "checkpoint=(wait=30)"
})

// Journal commit interval for write-heavy workloads
db.adminCommand({
  setParameter: 1,
  "wiredTigerEngineConfigString": "transaction_sync=(enabled,method=none)"
})

// Eviction configuration for memory-constrained systems  
db.adminCommand({
  setParameter: 1,
  "wiredTigerEngineConfigString": "eviction=(threads_min=1,threads_max=8)"
})

Warning: Changing these settings can corrupt your data or destroy performance. Test in staging with identical hardware and workload patterns.

Connection Pool Hell - Production War Stories

The Connection Explosion: A microservice was creating a new MongoClient for every HTTP request. Each connection used around 1MB of memory. Thousands of connections ate tons of RAM, plus MongoDB couldn't handle the connection churn.

The Fix:

// WRONG - creates new client every time
app.get('/api/users', (req, res) => {
  const client = new MongoClient(uri);  // This kills your database
  // ... do stuff
  client.close();
});

// RIGHT - reuse the same client
const client = new MongoClient(uri, {
  maxPoolSize: 15,           // Reasonable limit
  maxIdleTimeMS: 300000,     // 5 minutes  
  serverSelectionTimeoutMS: 10000,
  socketTimeoutMS: 45000
});

app.get('/api/users', async (req, res) => {
  const db = client.db('myapp');  // Reuses connections from pool
  // ... do stuff
});

The DNS Resolution Hell: Replica set discovery failed because the application server couldn't resolve MongoDB hostnames during peak traffic. DNS resolution timeouts caused connection failures that looked like database problems.

The Fix: Use IP addresses in connection strings for production, or configure proper DNS caching.

Infrastructure configuration matters more than perfect queries. Get the basics right or your perfect indexes won't save you.

Even with proper profiling, perfect indexes, and solid infrastructure, you'll still run into edge cases and weird production scenarios. The questions that follow are the real-world problems I've spent weekends debugging - the shit that happens when your carefully tuned MongoDB cluster meets actual production traffic.

MongoDB Performance FAQ - The Shit They Don't Tell You

Q

My queries were fast yesterday, now they're dog shit slow. What happened?

A

Someone fucked up your indexes or your data grew past the tipping point. Run db.collection.explain("executionStats") and look for COLLSCAN - if you see that, you're scanning the entire collection like an idiot.

Turn on the profiler: db.setProfilingLevel(1, { slowms: 100 }) and find what broke. Usually it's:

  • New query patterns without indexes
  • A developer who dropped an index "by mistake"
  • Collections that grew from 1K to 10M documents
  • Someone upgraded MongoDB without testing

Check if anyone deployed code recently. I've seen junior devs push queries that scan millions and millions of documents because "it worked fine in development."

Q

How do I know if MongoDB is actually using my fucking indexes?

A

Look for IXSCAN in explain plans. If you see COLLSCAN, your indexes are useless.

db.users.find({ status: "active" }).explain("executionStats")

Red flags in explain output:

  • totalDocsExamined >> totalDocsReturned = collection scan
  • executionTimeMillis > 100ms = probably broken
  • stage: "COLLSCAN" = delete this query and start over

Atlas Performance Advisor will tell you which indexes are never used. I found tons of unused indexes once - dropping them roughly doubled write performance.

Q

Should I upgrade to MongoDB 8.0 or is it another clusterfuck?

A

MongoDB 8.0 claims to be much faster for reads but upgrading is still gambling with your sanity.

Version reality check:

  • MongoDB 7.0: Has a concurrency bug that kills performance. Apply the hotfix or suffer.
  • MongoDB 8.0: Fixes the 7.0 problems but introduces new ones. Test in staging for 2 weeks minimum.
  • MongoDB 6.0: Still works fine. Don't fix what isn't broken.

Skip 7.0 entirely if you can. Going from 6.0 → 8.0 has fewer landmines than 6.0 → 7.0 → 8.0.

Q

My aggregation pipelines timeout and crash. Why?

A

MongoDB kills aggregations that use over 100MB of RAM. Your pipeline is probably doing stupid shit like:

  • $lookup joins on unindexed fields
  • $sort without supporting indexes
  • Processing millions of documents before filtering

Fix it:

// Move $match to the fucking beginning
db.orders.aggregate([
  { $match: { date: { $gte: lastMonth } } },  // Filter first
  { $lookup: { ... } },                       // Then join
  { $group: { ... } }                         // Then aggregate
])

Use allowDiskUse: true for large operations, but expect them to be slow as hell.

Q

How many indexes is too many indexes?

A

Each index slows down writes by 10-15%. I've seen collections with way too many indexes where writes took forever.

Rough limits:

  • 0-5 indexes: Usually fine
  • 6-15 indexes: Monitor write performance
  • 15+ indexes: You're probably doing something wrong
  • Text indexes: Avoid unless you hate write performance

Create indexes based on actual query patterns, not hypothetical bullshit. One compound index is better than five single-field indexes.

Q

MongoDB is eating all my RAM and I'm getting OOM killed

A

WiredTiger uses 50% of RAM by default. This is normal and good - unused RAM is wasted RAM.

When to worry:

  • Server is swapping (bad)
  • Getting OOM kills (very bad)
  • Cache pressure warnings in logs (also bad)

Check cache stats: db.serverStatus().wiredTiger.cache

If your working set doesn't fit in cache, you need more RAM or less data. There's no magic optimization that fixes insufficient memory.

Q

Why are writes getting slower as my collection grows?

A

Index maintenance cost scales with collection size. Every insert/update has to maintain all your indexes.

Collection size reality:

  • Under a million docs: Writes are fast
  • 1M - 10M documents: Noticeable slowdown
  • 10M - 100M documents: Indexes start hurting
  • 100M+ documents: Consider sharding or archiving

Use TTL indexes to delete old data automatically. I've seen massive collections with years of logs that should have been deleted.

Q

How do I optimize for both reads AND writes without everything breaking?

A

You don't. It's always a tradeoff.

Reads want: Tons of indexes for every query pattern
Writes want: Zero indexes for maximum speed

Real compromise:

  • Create compound indexes that serve multiple queries
  • Use partial indexes for filtered datasets
  • Archive old data that's rarely queried
  • Consider read replicas for analytics

Don't try to optimize every possible query. Focus on the top 80% that matter.

Q

My replica set secondary is lagging behind and I'm panicking

A

Replication lag means your secondary can't keep up with primary writes. Usually caused by:

  • Underpowered secondary hardware
  • Network issues between nodes
  • Massive write spikes
  • Different hardware specs between primary/secondary

Quick fixes:

  • Check if primary and secondary have identical hardware (they should)
  • Monitor oplog size: db.getReplicationInfo()
  • Look for network latency between data centers
  • Consider adding more secondaries to distribute read load

If lag consistently stays above 10 seconds, your secondary is fucked and needs more resources.

Q

Connection timeouts are destroying my application

A

This is usually connection pool misconfiguration. Your application creates too many connections, hits MongoDB's limit, and everything dies.

Application fixes:

  • Node.js: Around 15 connections per instance
  • Python: ~10 connections per process
  • Java: 50-100 per application server

Server fixes:

// Check current connections
db.serverStatus().connections

// Increase if needed (but fix the app first)
maxIncomingConnections: 2000

Monitor connection count during deployments. I've seen microservices create thousands of connections because someone disabled pooling.

Q

Can I just automate MongoDB optimization and forget about it?

A

Atlas Performance Advisor finds some problems automatically. But it won't fix:

  • Shit schema design
  • Queries written by drunk developers
  • Applications that create new connections for every request
  • Text indexes on 100GB collections

Tools help, but you still need to understand what you're doing. There's no magic "make MongoDB fast" button.

Q

My MongoDB cluster keeps hitting CPU spikes during peak hours. What's the culprit?

A

CPU spikes usually mean inefficient queries or missing indexes. Check these in order:

  1. Run profiler during peak: db.setProfilingLevel(1, { slowms: 50 }) - catch anything over 50ms
  2. Look for collection scans: db.system.profile.find({"planSummary": /COLLSCAN/})
  3. Check for regex queries: db.system.profile.find({"command.filter": {$exists: true}})
  4. Monitor concurrent connections: db.serverStatus().connections

Most CPU spikes come from queries that scan millions of docs. One bad aggregation pipeline during lunch hour can take down your entire cluster.

Q

MongoDB is throwing "MongoNetworkTimeoutError" constantly. How do I fix this shit?

A

Network timeouts are usually connection pool problems, not actual network issues. Check these settings:

Connection pool configuration:

  • maxPoolSize: Should be 10-50 per application instance
  • maxIdleTimeMS: Don't set too low, 300000ms (5 min) is reasonable
  • serverSelectionTimeoutMS: Increase to 10000ms if you see intermittent failures

Common causes:

  • App creates new MongoClient for every request (connection pool exhaustion)
  • Load balancer timeout < MongoDB socket timeout
  • DNS resolution issues with replica set discovery
  • Firewall dropping idle connections

Fix 90% of timeout issues by reusing a single MongoClient instance across your entire application.

Q

My writes are getting slower as my collection grows past 10M documents. Normal?

A

Yes, but you can minimize it. Write performance degrades because:

Index maintenance overhead scales with collection size:

  • 1M docs: Pretty fast writes
  • 10M docs: Getting slower
  • 100M docs: Noticeably slow writes
  • 1B docs: You're probably fucked without sharding

Optimization strategies:

  • Drop unused indexes: Each index adds 10-30% write overhead
  • Use bulk operations: insertMany() instead of multiple insertOne() calls
  • Consider write concern: {w: 1} instead of {w: "majority"} for non-critical data
  • Shard before 100M documents: Shard key selection matters more than you think

Emergency fix for huge collections:

// Check index usage first
db.collection.aggregate([{$indexStats: {}}])

// Drop indexes with 0 usage
db.collection.dropIndex("unused_field_1")

The 100M document mark is where most people realize they should have planned for sharding.

MongoDB Performance Resources That Don't Suck

Related Tools & Recommendations

compare
Recommended

MongoDB vs PostgreSQL vs MySQL: Which One Won't Ruin Your Weekend

competes with postgresql

postgresql
/compare/mongodb/postgresql/mysql/performance-benchmarks-2025
100%
integration
Recommended

MongoDB + Express + Mongoose Production Deployment

Deploy Without Breaking Everything (Again)

MongoDB
/integration/mongodb-express-mongoose/production-deployment-guide
89%
pricing
Recommended

How These Database Platforms Will Fuck Your Budget

powers MongoDB Atlas

MongoDB Atlas
/pricing/mongodb-atlas-vs-planetscale-vs-supabase/total-cost-comparison
81%
howto
Recommended

How to Migrate PostgreSQL 15 to 16 Without Destroying Your Weekend

competes with PostgreSQL

PostgreSQL
/howto/migrate-postgresql-15-to-16-production/migrate-postgresql-15-to-16-production
70%
alternatives
Recommended

Why I Finally Dumped Cassandra After 5 Years of 3AM Hell

competes with MongoDB

MongoDB
/alternatives/mongodb-postgresql-cassandra/cassandra-operational-nightmare
70%
compare
Recommended

MongoDB vs DynamoDB vs Cosmos DB - Which NoSQL Database Will Actually Work for You?

The brutal truth from someone who's debugged all three at 3am

MongoDB
/compare/mongodb/dynamodb/cosmos-db/enterprise-scale-comparison
68%
integration
Recommended

Lambda + DynamoDB Integration - What Actually Works in Production

The good, the bad, and the shit AWS doesn't tell you about serverless data processing

AWS Lambda
/integration/aws-lambda-dynamodb/serverless-architecture-guide
68%
tool
Recommended

Amazon DynamoDB - AWS NoSQL Database That Actually Scales

Fast key-value lookups without the server headaches, but query patterns matter more than you think

Amazon DynamoDB
/tool/amazon-dynamodb/overview
68%
compare
Recommended

Redis vs Memcached vs Hazelcast: Production Caching Decision Guide

Three caching solutions that tackle fundamentally different problems. Redis 8.2.1 delivers multi-structure data operations with memory complexity. Memcached 1.6

Redis
/compare/redis/memcached/hazelcast/comprehensive-comparison
64%
alternatives
Recommended

Redis Alternatives for High-Performance Applications

The landscape of in-memory databases has evolved dramatically beyond Redis

Redis
/alternatives/redis/performance-focused-alternatives
64%
tool
Recommended

Redis - In-Memory Data Platform for Real-Time Applications

The world's fastest in-memory database, providing cloud and on-premises solutions for caching, vector search, and NoSQL databases that seamlessly fit into any t

Redis
/tool/redis/overview
64%
compare
Recommended

Which Node.js framework is actually faster (and does it matter)?

Hono is stupidly fast, but that doesn't mean you should use it

Hono
/compare/hono/express/fastify/koa/overview
64%
tool
Recommended

Apache Cassandra - The Database That Scales Forever (and Breaks Spectacularly)

What Netflix, Instagram, and Uber Use When PostgreSQL Gives Up

Apache Cassandra
/tool/apache-cassandra/overview
63%
tool
Recommended

How to Fix Your Slow-as-Hell Cassandra Cluster

Stop Pretending Your 50 Ops/Sec Cluster is "Scalable"

Apache Cassandra
/tool/apache-cassandra/performance-optimization-guide
63%
tool
Recommended

Hardening Cassandra Security - Because Default Configs Get You Fired

competes with Apache Cassandra

Apache Cassandra
/tool/apache-cassandra/enterprise-security-hardening
63%
integration
Recommended

Supabase + Next.js + Stripe: How to Actually Make This Work

The least broken way to handle auth and payments (until it isn't)

Supabase
/integration/supabase-nextjs-stripe-authentication/customer-auth-payment-flow
62%
integration
Recommended

Claude API Code Execution Integration - Advanced Tools Guide

Build production-ready applications with Claude's code execution and file processing tools

Claude API
/integration/claude-api-nodejs-express/advanced-tools-integration
60%
tool
Recommended

Datadog Cost Management - Stop Your Monitoring Bill From Destroying Your Budget

integrates with Datadog

Datadog
/tool/datadog/cost-management-guide
59%
pricing
Recommended

Datadog vs New Relic vs Sentry: Real Pricing Breakdown (From Someone Who's Actually Paid These Bills)

Observability pricing is a shitshow. Here's what it actually costs.

Datadog
/pricing/datadog-newrelic-sentry-enterprise/enterprise-pricing-comparison
59%
pricing
Recommended

Datadog Enterprise Pricing - What It Actually Costs When Your Shit Breaks at 3AM

The Real Numbers Behind Datadog's "Starting at $23/host" Bullshit

Datadog
/pricing/datadog/enterprise-cost-analysis
59%

Recommendations combine user behavior, content similarity, research intelligence, and SEO optimization