Currently viewing the human version
Switch to AI version

What memory_profiler Actually Does

memory_profiler solves the problem of "where the fuck is my Python script eating all the RAM?" While cProfile tells you what's slow, memory_profiler tells you what's fat. Simple as that.

mprof Plot Example

It's Dead But Still Works

Version 0.61.0 from November 2022 is the final release. The maintainers officially threw in the towel - they're not fixing bugs or answering issues. But here's the thing: it still works perfectly. 4.5k GitHub stars don't lie. The code is stable, battle-tested, and handles Python 3.5+ without breaking.

How It Actually Works

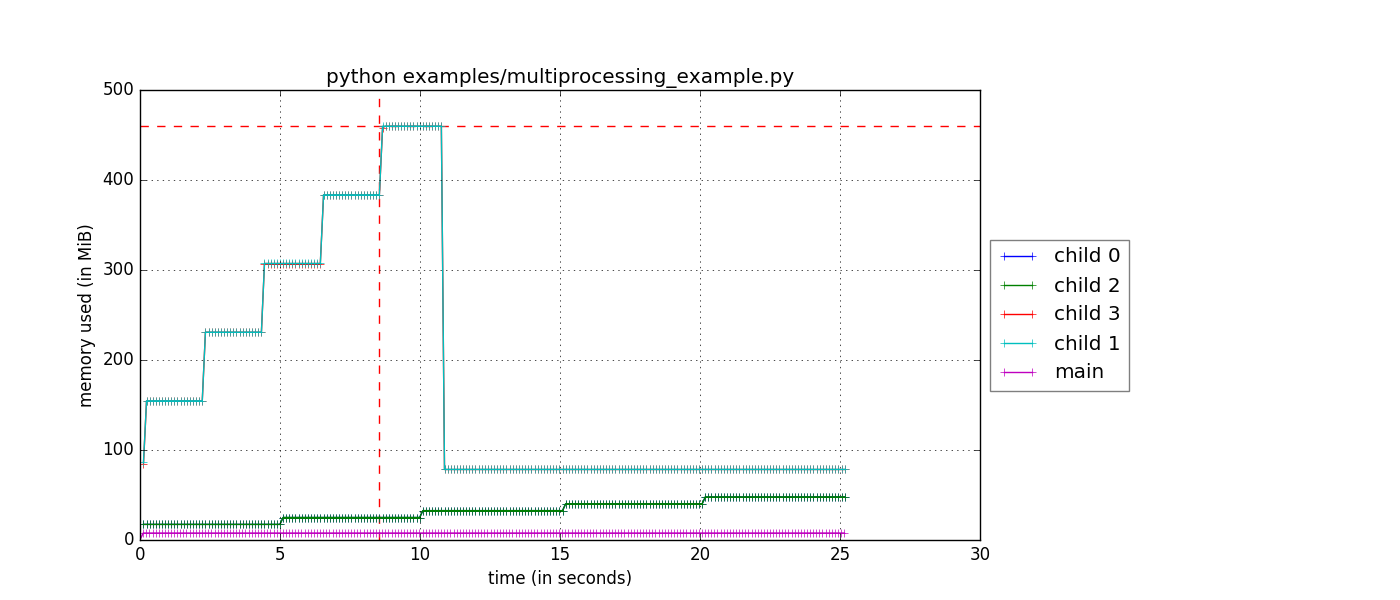
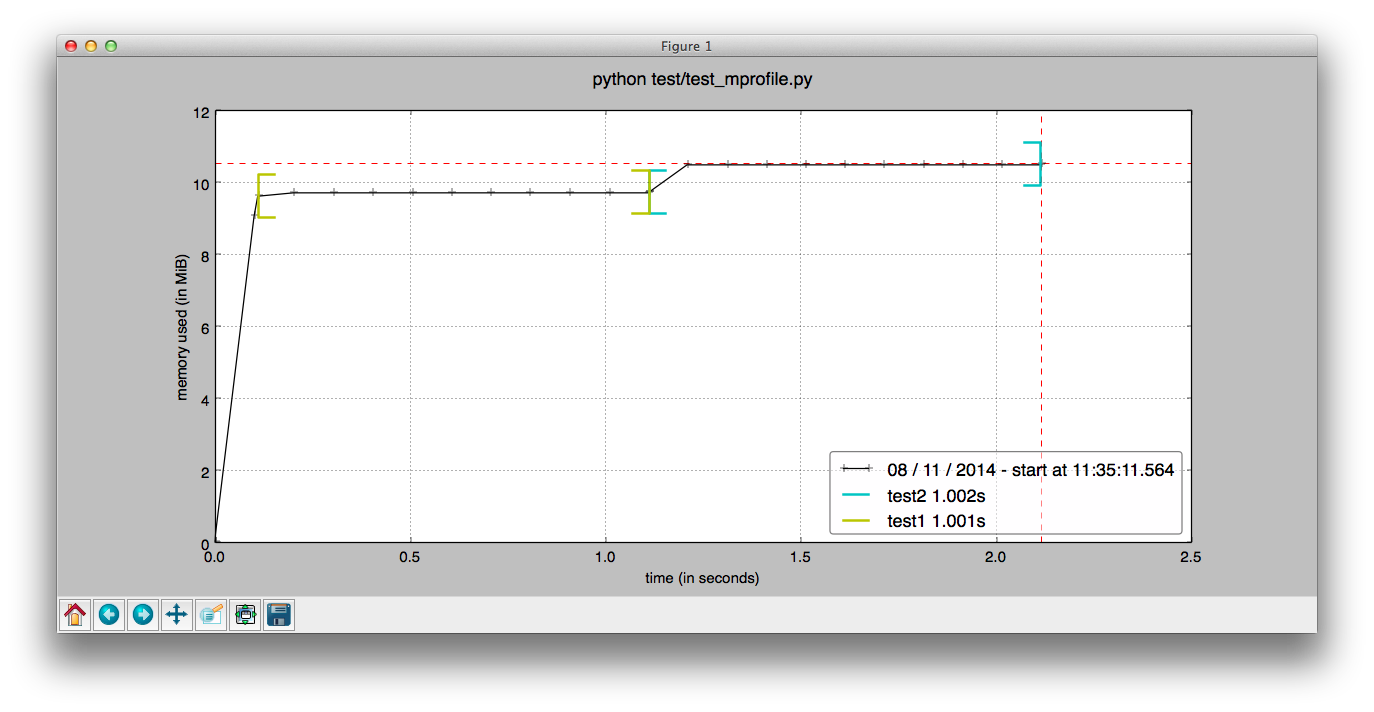
Two ways to use it: slap @profile decorators on functions for line-by-line analysis, or use mprof to spy on running processes externally. The decorator approach shows you exactly which line ate 500MB. The external monitoring catches memory leaks in production without touching your code.

It uses psutil under the hood for cross-platform memory readings. Unlike tracemalloc (which only tracks Python objects), memory_profiler shows real system memory including C extensions and whatever numpy is doing behind the scenes.

PSUtil Memory Monitoring

When You Actually Need This

memory_profiler is handy when your Python script eats more RAM than Chrome. Specifically:

  • Your data processing pipeline randomly OOMs on production data
  • Your web app slowly leaks memory until it dies at 3am (I once had a Flask app that leaked 50MB every hour - took three weeks to find the culprit: a pandas DataFrame that wasn't getting garbage collected because of a circular reference. memory_profiler pinpointed it in 20 minutes.)
  • Your ML training crashes after 6 hours with "cannot allocate memory"
  • You're debugging scientific code that should use 2GB but somehow needs 16GB

Works great with Jupyter notebooks via %mprun and %memit magic commands. Load it with %load_ext memory_profiler and you're off to the races.

Jupyter notebook memory profiler

Production Reality

Line-by-line profiling slows things down noticeably - expect 2-10x overhead depending on your code. I once had memory_profiler running on production and forgot about the overhead. Our API response time went from 200ms to 2 seconds. Customer called screaming about the slowdown while I frantically figured out why everything was broken. For production monitoring, use mprof to watch from outside. The measurements vary between runs because Python's garbage collector does whatever it wants, but the trends are reliable enough to catch real problems.

memory_profiler vs Alternative Python Memory Profiling Tools

Tool

Focus

Overhead

Production Ready

Key Strengths

Limitations

memory_profiler

Memory usage, line-by-line analysis

Moderate

Yes (with mprof)

Detailed line analysis, external process monitoring

No longer actively maintained

tracemalloc

Python object allocation

Low

Yes

Built into Python 3.4+, snapshot comparison

Python objects only, not system memory

Scalene

CPU + Memory + GPU

Low

Yes

Multi-threaded analysis, combined metrics

More complex setup

py-spy

CPU profiling

Minimal

Yes

Low overhead, real-time monitoring

CPU-focused, limited memory insights

Pympler

Object tracking, leak detection

Moderate

Yes

Detailed object analysis, memory leak detection

Learning curve, complex API

objgraph

Object references, leak detection

Low

Yes

Visualizes object relationships, reference cycles

Specialized use case

Fil

Peak memory usage

Low

Limited

Data science focused, Jupyter integration

Newer tool, limited adoption

Memray

Native extension memory

Low

Yes

Tracks C extensions, flame graphs

Newer, Linux/macOS only

Heapy

Heap analysis

Low

Yes

Detailed heap profiling

Part of Guppy package

How to Actually Use memory_profiler

Getting Started

`pip install memory_profiler` and you're done. Pulls in psutil as a dependency, which handles the cross-platform memory measurements. If you're using conda, there's a conda-forge package too.

Line-by-Line Analysis (The Main Event)

Slap @profile on any function, then run python -m memory_profiler script.py. You'll get output showing line numbers, memory usage after each line, and the delta. Sometimes the output is confusing because Python's garbage collector runs between lines, but you'll spot the real memory hogs.

Another Jupyter Example

@profile
def load_huge_data():
    data = pandas.read_csv('dataset.csv')  # +500MB (ouch)
    filtered = data[data.value > 100]      # +200MB (copy strikes again)
    result = filtered.groupby('id').sum()  # +50MB (reasonable)
    return result

External Process Monitoring (Production Friendly)

Use mprof run python script.py to watch from outside without touching your code. Follow with mprof plot to get a matplotlib graph. This is your go-to for production debugging since it doesn't slow things down as much.

The graphs sometimes lie when multiprocessing is involved - RSS measurements double-count shared memory. Use --backend psutil_pss to fix this, assuming your system supports PSS (Linux does, others might not).

Memory Backends and Platform Gotchas

You've got five backends to choose from: 'psutil' (default), 'psutil_pss', 'psutil_uss', 'posix', and 'tracemalloc'. Stick with 'psutil' unless you're debugging in Docker (use 'psutil_pss') or you actually understand the difference between RSS and USS (most of us don't). RSS is wrong in Docker containers because shared memory gets counted multiple times. PSS fixes this by dividing shared pages among processes. USS only counts private memory.

Windows works but memory measurements are less reliable than Linux. macOS works fine but sometimes reports negative memory usage deltas, which makes zero sense but happens anyway.

Multiprocessing Hell

Use --include-children to aggregate child process memory or --multiprocess to track each separately. Neither works perfectly with Python's multiprocessing module because of how it forks processes. You'll get weird spikes that don't reflect reality.

Jupyter Integration

Works with Jupyter notebooks, which is nice when you're prototyping. Load with %load_ext memory_profiler, then use %mprun to profile functions or %memit to time memory usage like `%timeit` but for RAM.

%load_ext memory_profiler
%mprun -f my_function my_function(data)
%memit [x**2 for x in range(10000)]

Memory Breakpoints (Actually Useful)

Use --pdb-mmem=1000 to drop into the debugger when memory hits 1GB. Great for catching runaway allocations before they kill your server. Set it lower than your system's memory limit or you'll be debugging a dead process. On a typical data processing script (500MB dataset, pandas operations), memory_profiler added about 4x overhead - your 30-second script becomes 2 minutes. Plan accordingly.

Official memory_profiler Example

Actually Useful Questions About memory_profiler

Q

Why does this give different numbers every time I run it?

A

Python's garbage collector runs whenever it feels like it, which affects memory measurements. You'll see fluctuations of 10-50MB between runs on the same code. The patterns matter more than exact numbers

  • if line 42 consistently shows a big spike, that's your problem.
Q

Will this slow down my code enough to matter?

A

Line-by-line profiling with @profile decorators adds 2-10x overhead.

Don't leave those in production code. Use `mprof` for external monitoring

  • it's much gentler, maybe 10-20% slowdown.
Q

What's the overhead in production?

A

For external monitoring with mprof, expect 10-20% performance impact. For decorator-based profiling, you're looking at 2-10x slower execution. Never ship @profile decorators to production unless you enjoy angry customers.

Q

Does it actually work on Windows?

A

Yeah, it works on Windows but the memory measurements jump around like a caffeinated squirrel. I've seen 200MB usage spikes that vanished on the next measurement. It's still useful for finding big leaks, just don't trust the exact numbers. Check the Windows compatibility notes.

Q

What's the difference between this and tracemalloc?

A

memory_profiler shows actual RAM usage including C extensions, numpy arrays, and whatever else is eating memory. tracemalloc only tracks Python objects, so it misses a lot. If you're using pandas or numpy heavily, tracemalloc will lie to you.

Q

My multiprocessing code gives wrong results. Why?

A

memory_profiler struggles with multiprocessing because RSS measurements double-count shared memory. Use --backend psutil_pss if you're on Linux, or just accept that the numbers will be inflated. The alternative is rewriting your code to avoid multiprocessing, which nobody wants to do.

Q

Should I use this if the project is dead?

A

Version 0.61.0 from 2022 still works fine. No bugs that'll break your code. The maintainers abandoned it, but it's simple enough that it doesn't need much maintenance. For new projects, consider Scalene instead.

Q

How do I profile without changing my code?

A

mprof run python script.py then mprof plot. Works on any Python script without modification. The plots sometimes look wonky but you'll spot memory leaks and usage patterns. See the external process monitoring docs.

Q

Does it work with Docker containers?

A

Yes, but RSS measurements will be wrong because of shared memory counting. Use --backend psutil_pss if available, or just look for trends rather than absolute numbers. Container memory limits don't fix RSS overcounting.

Docker Memory Monitoring

Q

Can I catch memory spikes before they crash my server?

A

Use --pdb-mmem=1000 to drop into the debugger when memory hits 1GB (or whatever threshold you set). Set it below your container memory limit or you'll be debugging a killed process. This works great with Kubernetes pod limits.

Related Tools & Recommendations

tool
Similar content

Pympler - Python Memory Profiler That Actually Works

Find memory leaks before they kill your production server

Pympler
/tool/pympler/overview
100%
tool
Similar content

tracemalloc - Find Memory Leaks in Your Python Code

Master Python's tracemalloc to diagnose and fix memory leaks. Learn setup, usage, common pitfalls, and real-world debugging strategies for optimizing app perfor

tracemalloc
/tool/tracemalloc/overview
99%
tool
Similar content

Python 3.13 Performance - Stop Buying the Hype

Get the real story on Python 3.13 performance. Learn practical optimization strategies, memory management tips, and answers to FAQs on free-threading and memory

Python 3.13
/tool/python-3.13/performance-optimization-guide
76%
tool
Popular choice

jQuery - The Library That Won't Die

Explore jQuery's enduring legacy, its impact on web development, and the key changes in jQuery 4.0. Understand its relevance for new projects in 2025.

jQuery
/tool/jquery/overview
42%
troubleshoot
Similar content

Python Performance Disasters - What Actually Works When Everything's On Fire

Your Code is Slow, Users Are Pissed, and You're Getting Paged at 3AM

Python
/troubleshoot/python-performance-optimization/performance-bottlenecks-diagnosis
40%
tool
Popular choice

Hoppscotch - Open Source API Development Ecosystem

Fast API testing that won't crash every 20 minutes or eat half your RAM sending a GET request.

Hoppscotch
/tool/hoppscotch/overview
40%
tool
Popular choice

Stop Jira from Sucking: Performance Troubleshooting That Works

Frustrated with slow Jira Software? Learn step-by-step performance troubleshooting techniques to identify and fix common issues, optimize your instance, and boo

Jira Software
/tool/jira-software/performance-troubleshooting
38%
tool
Popular choice

Northflank - Deploy Stuff Without Kubernetes Nightmares

Discover Northflank, the deployment platform designed to simplify app hosting and development. Learn how it streamlines deployments, avoids Kubernetes complexit

Northflank
/tool/northflank/overview
36%
tool
Popular choice

LM Studio MCP Integration - Connect Your Local AI to Real Tools

Turn your offline model into an actual assistant that can do shit

LM Studio
/tool/lm-studio/mcp-integration
35%
tool
Popular choice

CUDA Development Toolkit 13.0 - Still Breaking Builds Since 2007

NVIDIA's parallel programming platform that makes GPU computing possible but not painless

CUDA Development Toolkit
/tool/cuda/overview
33%
tool
Recommended

Python Async & Concurrency - The GIL Workaround Guide

When your Python app hits the performance wall and you realize threading is just fancy single-core execution

Python
/brainrot:tool/python/async-concurrency-guide
31%
compare
Recommended

Python vs Rust Performance Reality Check

rust bros wont stop dickriding memory safety while python devs pretend their apps dont crash more than my mental health on mondays

Python
/brainrot:compare/python/rust/performance-battle
31%
news
Popular choice

Taco Bell's AI Drive-Through Crashes on Day One

CTO: "AI Cannot Work Everywhere" (No Shit, Sherlock)

Samsung Galaxy Devices
/news/2025-08-31/taco-bell-ai-failures
31%
news
Popular choice

AI Agent Market Projected to Reach $42.7 Billion by 2030

North America leads explosive growth with 41.5% CAGR as enterprises embrace autonomous digital workers

OpenAI/ChatGPT
/news/2025-09-05/ai-agent-market-forecast
30%
news
Popular choice

Builder.ai's $1.5B AI Fraud Exposed: "AI" Was 700 Human Engineers

Microsoft-backed startup collapses after investigators discover the "revolutionary AI" was just outsourced developers in India

OpenAI ChatGPT/GPT Models
/news/2025-09-01/builder-ai-collapse
28%
news
Popular choice

Docker Compose 2.39.2 and Buildx 0.27.0 Released with Major Updates

Latest versions bring improved multi-platform builds and security fixes for containerized applications

Docker
/news/2025-09-05/docker-compose-buildx-updates
28%
news
Popular choice

Anthropic Catches Hackers Using Claude for Cybercrime - August 31, 2025

"Vibe Hacking" and AI-Generated Ransomware Are Actually Happening Now

Samsung Galaxy Devices
/news/2025-08-31/ai-weaponization-security-alert
28%
news
Popular choice

China Promises BCI Breakthroughs by 2027 - Good Luck With That

Seven government departments coordinate to achieve brain-computer interface leadership by the same deadline they missed for semiconductors

OpenAI ChatGPT/GPT Models
/news/2025-09-01/china-bci-competition
28%
news
Popular choice

Tech Layoffs: 22,000+ Jobs Gone in 2025

Oracle, Intel, Microsoft Keep Cutting

Samsung Galaxy Devices
/news/2025-08-31/tech-layoffs-analysis
28%
news
Popular choice

Builder.ai Goes From Unicorn to Zero in Record Time

Builder.ai's trajectory from $1.5B valuation to bankruptcy in months perfectly illustrates the AI startup bubble - all hype, no substance, and investors who for

Samsung Galaxy Devices
/news/2025-08-31/builder-ai-collapse
28%

Recommendations combine user behavior, content similarity, research intelligence, and SEO optimization