Currently viewing the human version
Switch to AI version

Why Pympler Actually Works (Unlike Half the Other Memory Profilers)

Pympler Memory Analysis

When your Python app is slowly eating through server memory and you need answers fast, Pympler delivers where others fail. It works everywhere Python works, no compilation required. It's not the fastest profiler, but it's the one that actually installs without fighting your system for an hour. Been around since August 2008 and still gets regular updates - version 1.1 dropped in June 2024 with Python 3.12 support.

The real value isn't the fancy architecture - it's that when your Django app is eating 4GB of RAM and you have no idea why, Pympler actually tells you what's wrong. Spent most of Saturday debugging this memory leak that was killing our production server every 12 hours. Turned out to be 10,000 unclosed database connections because some genius decided to create a new connection pool in a class initializer that got called on every request. This brought down production during our busiest shopping weekend.

Three Tools That Actually Do Different Things

asizeof - Finally tells you how much memory your objects are really using. Unlike sys.getsizeof() which lies about nested structures, asizeof recursively calculates the actual footprint. When you think a dictionary is 200 bytes but it's actually 20MB because of all the shit it references, asizeof shows you the truth.

muppy - Tracks memory in real-time so you can see what's growing over time. Perfect for finding those slow leaks that only show up after your app runs for days. This will tank your performance if you run it constantly. We trigger it when memory usage spikes above 80% - works great for finding which endpoints are memory hogs.

Class Tracker - Monitors specific object types throughout their lifecycle. Essential when you need to know why certain classes keep creating objects that never get garbage collected. Saved us when we discovered a third-party library was creating thousands of uncollected objects in a background thread.

The Web Interface That Doesn't Suck

Pympler Web Interface

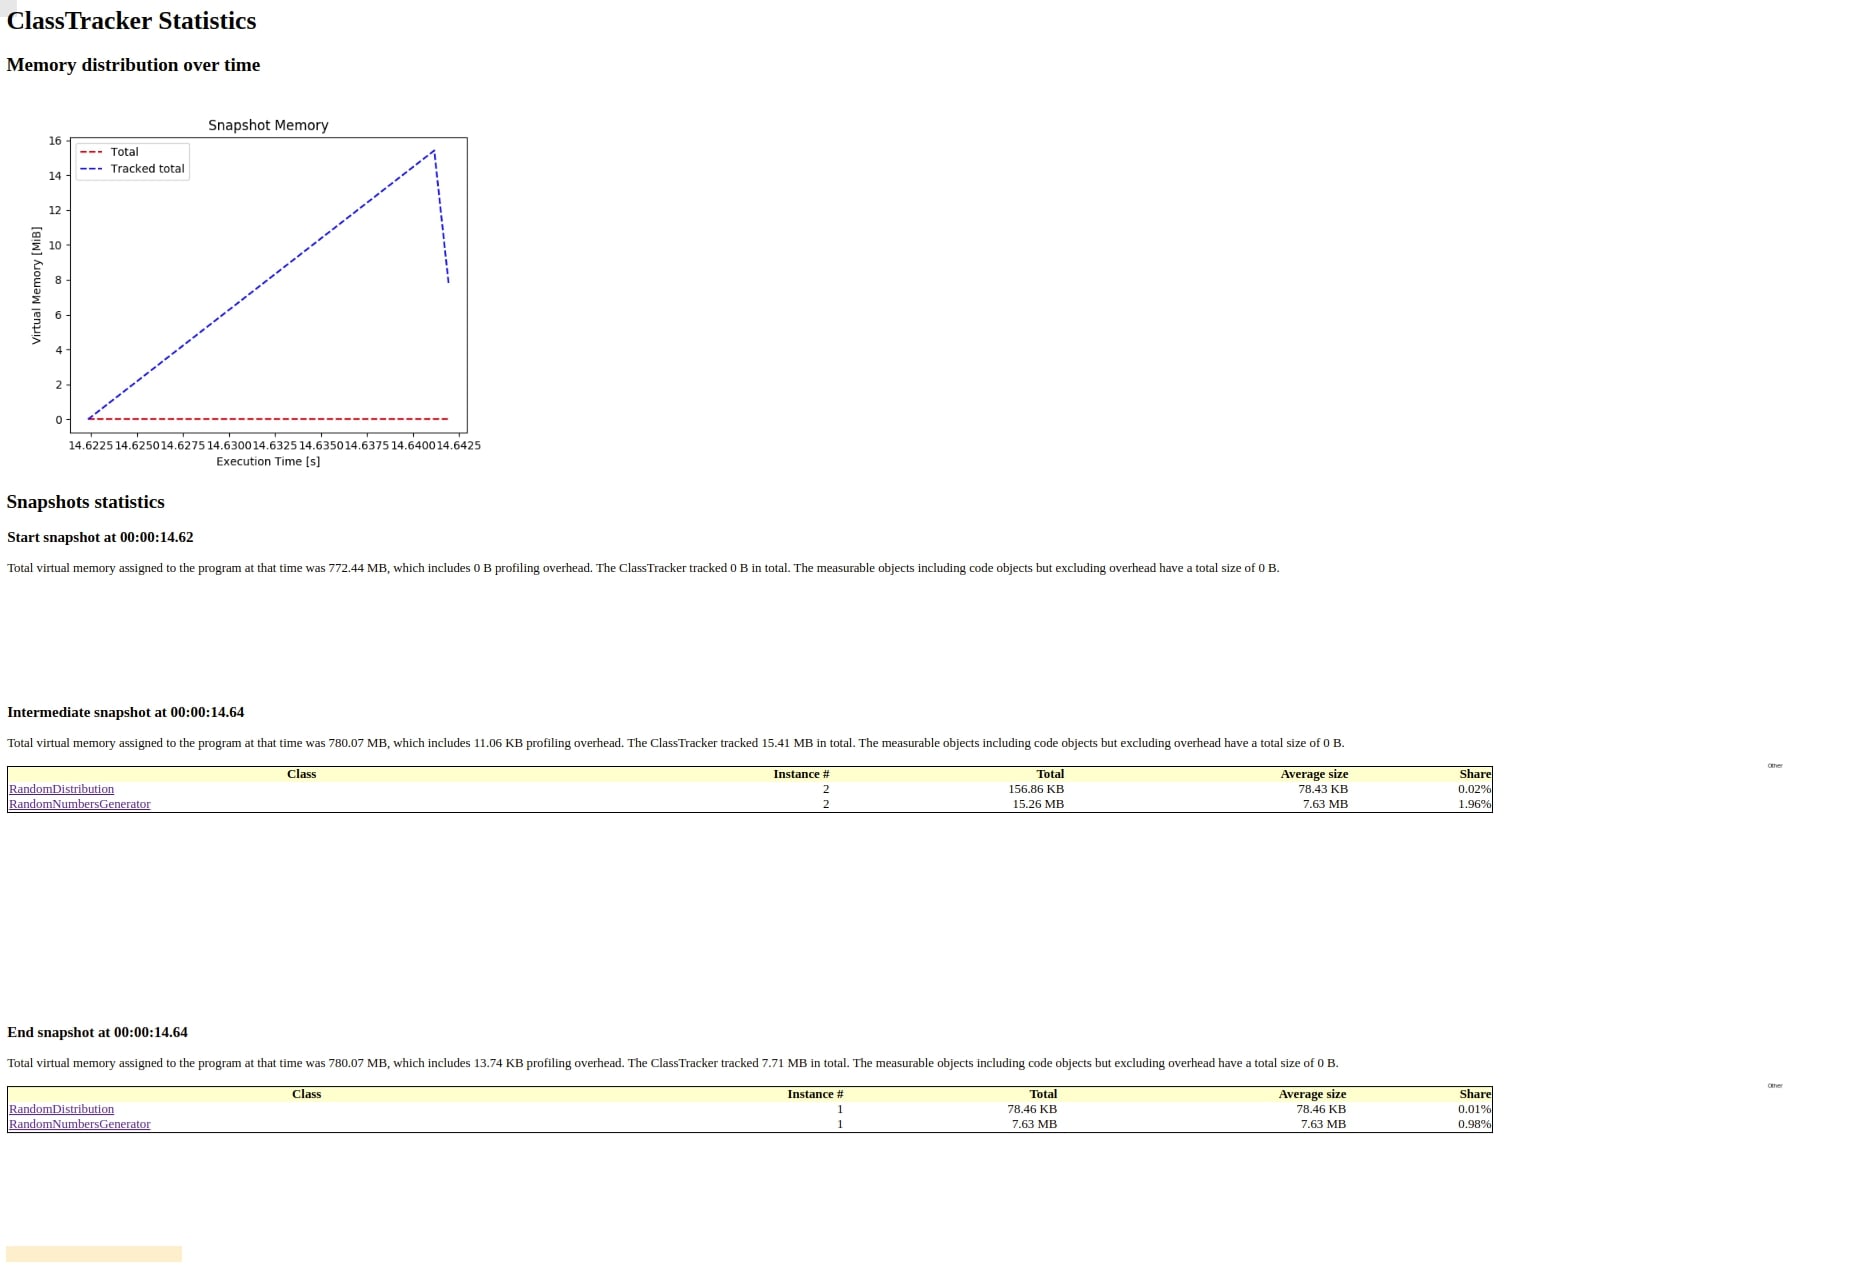
The web interface is actually useful, which is rare. Instead of dumping raw data to your terminal, you get interactive charts showing memory growth, object counts, and garbage collection stats. Your PM can actually understand the output without learning command-line profiling. Plus it runs in any browser, so you can debug memory issues on remote servers through SSH tunneling.

Memory Profiling Visualization

Works On Everything (Even Windows)

Python 3.6 through 3.12 on Linux, macOS, and Windows. On Windows you need pywin32 but pip usually handles that. The pure Python implementation means no compilation hell - it just works. Unlike Memray which is technically better but good luck getting it to compile on your machine. Sometimes "just works" beats "technically superior."

Production Reality Check

Don't run this constantly in production unless you hate performance. It's going to slow things down - maybe 20-30% if you're monitoring everything. We've seen Flask APIs drop from normal throughput to crawling when you turn on full monitoring. Use it during maintenance windows or when debugging specific memory spikes. The overhead is worth it when you're trying to figure out why your app crashes with OOMKilled every few hours.

Pympler vs Other Memory Profilers (The Real Story)

Feature

Pympler

tracemalloc

memory_profiler

Memray

Guppy3/Heapy

Installation Pain

Just works (pip install)

Built-in Python 3.4+

psutil fights you like an angry cat

Compilation hell

  • prepare for dependency nightmares

Dead project, abandon hope

Platform Reality

Works on Windows (miraculously)

Everywhere Python runs

Works but psutil will ruin your day

Linux/macOS only, Windows can go cry

CPython only, everything else is screwed

Performance Hit

20-30% slower

Minimal impact

Slow as hell on large apps

Fast but limited compatibility

Medium overhead

Actually Useful

Web UI even your PM can understand

Good for basic stuff

Line-by-line overkill for most problems

Best tool if you can actually get it working

Too academic

  • designed by PhDs for PhDs

Memory Leak Detection

Multiple approaches work

Good snapshot comparison

Overkill for most cases

Excellent if compiled

Reference cycles only

Learning Curve

Medium

  • docs are decent

Easy if you know Python

Decorator hell

Steep

  • new paradigm

PhD required

Production Ready

Use with sampling

Yes, very lightweight

Don't even think about it

Yes, designed for prod

Development only

Threading Support

Single-threaded only

Handles threads correctly

Multi-threaded support

Full threading support

Single-threaded

Getting Started (When Your App is Eating Memory)

Memory Usage Tracking

Enough theory - let's get Pympler working when you're facing a memory crisis. The installation is simple: pip install Pympler usually works. If you're on an older system or using conda, prepare for dependency hell. On Windows, you might get conflicts with pywin32 - just reinstall it if things break. Check the official installation guide if you run into issues with virtualenv or conda environments.

Real Examples That Actually Work

Find Out What's Actually Using Memory

sys.getsizeof() lies about nested structures. asizeof tells you the truth:

from pympler import asizeof

## This looks innocent but could be huge
data = {'users': [{'id': i, 'sessions': list(range(100))} for i in range(1000)]}

print(f"sys.getsizeof lies: {sys.getsizeof(data)} bytes")
print(f"asizeof truth: {asizeof.asizeof(data)} bytes")  # Way bigger

## See the breakdown of what's eating memory
print(asizeof.asized(data, detail=2).format())

asizeof can be slow as hell on deeply nested structures. Don't run this on your production Django ORM objects or SQLAlchemy models unless you enjoy waiting. Also, if you get import errors, you probably have conflicting versions of something.

Track Memory Leaks Over Time

Perfect for finding those bastard leaks that only show up after your app runs for hours:

from pympler import tracker

tr = tracker.SummaryTracker()
## Run your suspect code here - maybe a request handler
## or that background task that keeps growing

tr.print_diff()  # Shows what grew since last snapshot

This will slow your app down. We trigger it when memory usage hits 80% or when we're actively debugging a leak. Don't leave it running in production 24/7.

Track Specific Classes That Won't Die

When you suspect a particular class is leaking objects:

from pympler import classtracker

tr = classtracker.ClassTracker()
tr.track_class(YourSuspiciousClass)
tr.create_snapshot("before")

## Do the thing that might leak
your_leaky_operation()

tr.create_snapshot("after")
tr.stats.print_summary()  # Shows object creation/destruction

Don't use this with multi-threaded apps - the results are garbage. Single-threaded only or your measurements will be wrong.

Web Interface for Non-Terminal People

Python Profiling Dashboard

The web interface is actually useful:

from pympler import web
web.start_profiler()  # Starts on localhost:8080

Your PM can see memory graphs without learning command-line tools. Just don't forget to tunnel through SSH if you're debugging on a remote server.

Memory Profiler Output

Production Integration (Don't Be Stupid About It)

CI/CD Memory Regression Testing

Set up baseline measurements and alert when memory usage jumps:

## In your test suite
baseline_memory = get_baseline_from_somewhere()
current_memory = measure_memory_with_pympler()
assert current_memory < baseline_memory * 1.2  # Allow 20% growth

Production Monitoring Strategy

Don't run continuous monitoring unless you want your app to crawl. We use sampling strategies - trigger profiling when memory spikes or during maintenance windows.

Example: Monitor memory every 5 minutes, trigger Pympler when usage > 80% of available RAM. Works great for catching gradual leaks before they kill your server. Integrate with Prometheus monitoring or Grafana dashboards for long-term tracking.

Common Gotchas That Will Waste Your Time

  • Threading: Pympler doesn't handle concurrent threads correctly. Use single-threaded development servers for accurate profiling.
  • Overhead: This will make your app slower. Factor that into your measurements.
  • Windows PATH: Long paths can break on Windows. Keep your virtualenv path short.
  • Memory Pressure: In memory-constrained environments, profiling itself can affect what you're measuring.
  • Object References: Pympler holds references to objects it's tracking, which can prevent garbage collection. Clear trackers with tr.clear() when done profiling to avoid artificial memory retention.

Django integration works fine if you stick to runserver. Try this with gunicorn and you'll get garbage data that'll waste your time. For Flask applications, same deal - single-threaded only. Celery background tasks can be profiled individually but watch out for memory leaks in long-running workers.

Questions Engineers Actually Ask

Q

Why not just use sys.getsizeof()?

A

Because sys.getsizeof() lies. It only shows the size of the top-level object, not all the shit it references. When you have a dictionary with nested lists and that dictionary claims to be 200 bytes but is actually consuming 20MB of memory, Pympler's asizeof shows you the real footprint. Saved us from a memory leak where we thought we were storing tiny config objects but they each held references to massive data structures.

Q

Can I run this in production without tanking performance?

A

If you hate performance, sure. Pympler will slow things down like your app is running on a Raspberry Pi. Expect 20-30% performance hit if you're monitoring everything constantly. We trigger it when memory usage spikes above 80% or during maintenance windows. Don't run SummaryTracker() on every request unless you enjoy watching your response times crawl slower than a Windows update.

Q

Why choose Pympler over Memray?

A

Memray is technically better but compiling it is like solving a Rubik's cube blindfolded while someone screams at you about dependencies. Spent 3 hours trying to build Memray on our CI system before giving up and going back to Pympler. Sometimes "just works" beats "technically superior." Plus Pympler works on Windows, which Memray doesn't.

Q

Does this work with Python 3.12?

A

Version 1.1 supports Python 3.6 through 3.12. Been using it with Python 3.11 in production for months without issues. The maintainers actually keep up with new Python releases, unlike some dead memory profiling projects.

Q

What dependencies will break my environment?

A

Almost none. Pure Python on Linux/mac

OS. On Windows you need pywin32 but pip usually handles that. If you're using conda, prepare for the usual dependency resolution hell

  • but that's conda's fault, not Pympler's.
Q

How do I find memory leaks that only happen after hours?

A

Use tracker.SummaryTracker() to compare snapshots over time:

tr = tracker.SummaryTracker()
## Let your app run for a while
tr.print_diff()  # Shows what grew

Perfect for those bastard leaks that only show up after your app processes thousands of requests. Found a Django app that was leaking like 40-60MB per hour because someone cached QuerySets in a global dictionary and never cleared them.

Q

Can this do line-by-line profiling like memory_profiler?

A

No, and that's probably a good thing. Line-by-line profiling with memory_profiler will make your app crawl. Pympler focuses on object-level analysis, which is usually what you actually need. If you want line-by-line, use memory_profiler but don't expect it to be fast.

Q

How do I use the web interface on remote servers?

A

SSH tunnel is your friend:

ssh -L 8080:localhost:8080 your-server

Then run web.start_profiler() on the server and open localhost:8080 in your browser. The interface is actually useful - shows memory growth charts your non-technical team can understand without learning command-line profiling.

Q

Will this work with my multi-threaded Django app?

A

Don't use this with multi-threaded apps

  • the results are garbage. Pympler doesn't handle concurrent threads correctly. Use single-threaded development servers (runserver) for accurate profiling. Don't try to profile gunicorn workers
  • you'll get confusing results.
Q

How hard is this to learn?

A

Basic stuff is easy

  • asizeof to check object sizes, `Summary

Tracker` to find leaks. The learning curve gets steeper with Class Tracker and web interface customization. The docs are decent, unlike some Python libraries where the documentation was clearly written by someone who hates users. Took our junior dev about a day to start finding useful memory insights.

Essential Pympler Resources

Advanced Stuff (When Basic Profiling Isn't Enough)

GPU Memory Visualization

Production Monitoring Without Killing Performance

Don't run Pympler constantly in production unless you want your app to crawl. We trigger it when memory usage hits certain thresholds:

## Monitor memory every 5 minutes
if memory_usage_percent > 80:
    trigger_pympler_analysis()

## Or during maintenance windows
if is_maintenance_window():
    run_full_memory_analysis()

Use Class Tracker for specific suspicious objects rather than system-wide monitoring. Much less overhead when you're tracking one leaky class instead of every object in memory.

Memory Regression Testing That Actually Works

I integrate Pympler into CI/CD to catch memory regressions before they hit production:

## In your test suite
def test_memory_regression():
    baseline = 50_000_000  # 50MB baseline
    current_usage = measure_key_data_structures()
    assert current_usage < baseline * 1.2  # Allow 20% growth

We caught someone who "optimized" a data structure and doubled our memory usage. The CI build failed before it reached production - saved our asses.

Deep Analysis for Data Science Nightmares

If you're working with pandas, numpy, or ML models, asizeof is a lifesaver. Those nested data structures can hide massive memory consumption:

from pympler import asizeof

## This DataFrame looks innocent but might be huge
df_memory = asizeof.asizeof(your_dataframe)
model_memory = asizeof.asizeof(your_ml_model)

print(f"DataFrame: {df_memory / 1024**2:.1f} MB")
print(f"Model: {model_memory / 1024**2:.1f} MB")

Found a scikit-learn pipeline that was caching every training sample in memory. The model claimed to be 10MB but was actually holding 2GB of training data.

Team Debugging Sessions

The web interface is great for collaborative debugging. Instead of everyone crowding around your terminal, fire up the web UI:

from pympler import web
web.start_profiler(port=8080)

Your team can see memory graphs in real-time. Even the PM can understand what's happening without learning command-line tools. Just remember to tunnel through SSH if you're debugging on remote servers.

What Will Break and When

Threading Support is Garbage: Pympler doesn't handle concurrent threads correctly. The results are wrong and confusing. Use single-threaded development servers only. Don't try to profile gunicorn workers - you'll get garbage data.

Memory-Constrained Environments: Profiling itself uses memory. In containers with tight memory limits, Pympler can trigger the very OOMKilled errors you're trying to debug. Factor the overhead into your analysis.

Platform Differences: Memory profiling on Windows is weird compared to Linux - don't trust your macOS results for production. I've seen the same code use 30% more memory on Windows for no apparent reason.

Modern DevOps Integration

Memory Analysis Chart

Kubernetes Resource Limits: Use Pympler to right-size your container memory requests and limits:

peak_memory = run_load_test_with_pympler()
memory_request = peak_memory * 1.5  # Add buffer
memory_limit = peak_memory * 2.0   # Hard limit

Prometheus Monitoring: Export Pympler metrics for long-term tracking:

## Custom Prometheus exporter
pympler_memory_usage.set(get_current_memory_usage())
pympler_object_count.set(get_object_count())

Log Correlation: Combine Pympler snapshots with application logs to correlate memory spikes with specific operations:

logger.info(f"Memory before operation: {get_memory_snapshot()}")
perform_risky_operation()
logger.info(f"Memory after operation: {get_memory_snapshot()}")

I use this to track which API endpoints cause memory spikes. Turns out our report generation endpoint was caching every generated report in memory instead of streaming them to disk.

When to Stop Using Pympler

If you need production-grade profiling with minimal overhead, switch to Memray (if you can get it compiled). If you need line-by-line analysis, use memory_profiler (if you can tolerate the performance hit).

Pympler shines when you need "just works" cross-platform memory analysis for debugging specific issues. It's not the fastest or most feature-rich, but it's reliable and actually installs without drama. For teams using Docker containers and Kubernetes deployments, Pympler provides the cross-platform compatibility you need for consistent profiling across development and production environments.

The bottom line: When your app is leaking memory at 3am and you need to find the cause before it murders your production server, Pympler gets the job done without making you jump through dependency hell hoops. It's the screwdriver of memory profilers - not the fanciest tool in the shed, but the one that actually works when you need it most.

Your Next Steps

  1. Install it now: pip install Pympler - seriously, it takes 30 seconds
  2. Start with asizeof: Check if your "small" objects are actually memory hogs
  3. Set up monitoring: Trigger profiling when memory usage hits 80%
  4. Bookmark this page: You'll need it when debugging memory leaks at ungodly hours

When that memory leak finally strikes (and it will), you'll thank yourself for having Pympler ready to go. Don't wait until your server is dying to learn memory profiling - by then it's too late to be fumbling with compilation errors and broken dependencies.

Related Tools & Recommendations

tool
Similar content

tracemalloc - Find Memory Leaks in Your Python Code

Master Python's tracemalloc to diagnose and fix memory leaks. Learn setup, usage, common pitfalls, and real-world debugging strategies for optimizing app perfor

tracemalloc
/tool/tracemalloc/overview
100%
tool
Similar content

Django Production Deployment - Enterprise-Ready Guide for 2025

From development server to bulletproof production: Docker, Kubernetes, security hardening, and monitoring that doesn't suck

Django
/tool/django/production-deployment-guide
53%
tool
Popular choice

jQuery - The Library That Won't Die

Explore jQuery's enduring legacy, its impact on web development, and the key changes in jQuery 4.0. Understand its relevance for new projects in 2025.

jQuery
/tool/jquery/overview
42%
tool
Popular choice

Hoppscotch - Open Source API Development Ecosystem

Fast API testing that won't crash every 20 minutes or eat half your RAM sending a GET request.

Hoppscotch
/tool/hoppscotch/overview
41%
tool
Popular choice

Stop Jira from Sucking: Performance Troubleshooting That Works

Frustrated with slow Jira Software? Learn step-by-step performance troubleshooting techniques to identify and fix common issues, optimize your instance, and boo

Jira Software
/tool/jira-software/performance-troubleshooting
39%
tool
Popular choice

Northflank - Deploy Stuff Without Kubernetes Nightmares

Discover Northflank, the deployment platform designed to simplify app hosting and development. Learn how it streamlines deployments, avoids Kubernetes complexit

Northflank
/tool/northflank/overview
37%
tool
Popular choice

LM Studio MCP Integration - Connect Your Local AI to Real Tools

Turn your offline model into an actual assistant that can do shit

LM Studio
/tool/lm-studio/mcp-integration
35%
tool
Popular choice

CUDA Development Toolkit 13.0 - Still Breaking Builds Since 2007

NVIDIA's parallel programming platform that makes GPU computing possible but not painless

CUDA Development Toolkit
/tool/cuda/overview
33%
troubleshoot
Recommended

Conflictos de Dependencias Python - Soluciones Reales

built on Python

Python
/es:troubleshoot/python-dependency-conflicts/common-errors-solutions
32%
compare
Recommended

mojo vs python mobile showdown: why both suck for mobile but python sucks harder

built on Mojo

Mojo
/brainrot:compare/mojo/python/performance-showdown
32%
compare
Recommended

Python vs JavaScript vs Go vs Rust - Production Reality Check

What Actually Happens When You Ship Code With These Languages

python
/compare/python-javascript-go-rust/production-reality-check
32%
news
Popular choice

Taco Bell's AI Drive-Through Crashes on Day One

CTO: "AI Cannot Work Everywhere" (No Shit, Sherlock)

Samsung Galaxy Devices
/news/2025-08-31/taco-bell-ai-failures
32%
tool
Recommended

Django - The Web Framework for Perfectionists with Deadlines

Build robust, scalable web applications rapidly with Python's most comprehensive framework

Django
/tool/django/overview
31%
tool
Recommended

django-redis - Redis Cache That Actually Works

Stop fighting with Django's cache system and just use this

django-redis
/tool/django-redis/overview
31%
compare
Recommended

Django、Flask、FastAPI - 結局どれ使えば死なずに済むのか

compatible with Django

Django
/ja:compare/django/flask/fastapi/production-framework-selection
31%
tool
Recommended

Flask - 自由すぎて困るPython Web Framework

軽量だけど奥が深い、愛憎入り混じるmicroframework

Flask
/ja:tool/flask/overview
31%
news
Popular choice

AI Agent Market Projected to Reach $42.7 Billion by 2030

North America leads explosive growth with 41.5% CAGR as enterprises embrace autonomous digital workers

OpenAI/ChatGPT
/news/2025-09-05/ai-agent-market-forecast
30%
news
Popular choice

Builder.ai's $1.5B AI Fraud Exposed: "AI" Was 700 Human Engineers

Microsoft-backed startup collapses after investigators discover the "revolutionary AI" was just outsourced developers in India

OpenAI ChatGPT/GPT Models
/news/2025-09-01/builder-ai-collapse
28%
news
Popular choice

Docker Compose 2.39.2 and Buildx 0.27.0 Released with Major Updates

Latest versions bring improved multi-platform builds and security fixes for containerized applications

Docker
/news/2025-09-05/docker-compose-buildx-updates
28%
news
Popular choice

Anthropic Catches Hackers Using Claude for Cybercrime - August 31, 2025

"Vibe Hacking" and AI-Generated Ransomware Are Actually Happening Now

Samsung Galaxy Devices
/news/2025-08-31/ai-weaponization-security-alert
28%

Recommendations combine user behavior, content similarity, research intelligence, and SEO optimization