Production Deployment Reality Check

Your Hono app runs great on localhost. But production? That's where the real fun starts. Like finding out your "sub-20ms cold starts" turn into 2-second timeouts when users actually hit your endpoints. Or discovering your database connection pool of 10 becomes 0 under load because you forgot about connection pooling entirely.

Which Runtime Won't Screw You Over

Docker Architecture Overview

Cloudflare Workers is where most Hono apps end up, and for good reason. Cold starts are anywhere from 50ms to 1200ms depending on your bundle size and whether Mercury is in retrograde. That "sub-20ms" marketing bullshit? Sure, for a hello-world app with no dependencies. Real apps with Prisma and auth middleware? More like 400-800ms cold starts, which is still pretty good.

The 128MB memory limit will bite you eventually. Our e-commerce API hit this limit during Black Friday when we tried to cache too much user data in memory. Spent 4 hours debugging "Memory limit exceeded" errors at 2am.

Node.js + Docker gives you the most control, which is both a blessing and a curse. You can configure everything exactly how you want, but you also have to configure everything exactly right. PM2 clustering sounds great until you realize WebSocket connections don't work with it by default. Ask me how I know.

Memory allocation starts at 512MB but you'll need 1-2GB for anything serious. Our API gateway uses 3GB because we cache authentication tokens and rate limiting data. Docker networking will make you question your career choices - expect to spend a weekend figuring out why your containers can't talk to each other.

Bun is genuinely faster when it works. Our image processing API saw 60% performance improvement after switching from Node.js. Bundle sizes are smaller too - our Docker images went from 400MB to 180MB. But Bun breaks in weird ways that make you miss Node.js's predictable failures. Random segfaults, NPM package compatibility issues, and memory leaks with Prisma that only show up in production. There are multiple memory leak reports where memory climbs until the server crashes.

Security Update (September 2025): Hono v4.9.6 fixed a critical URL path parsing bug that could cause path confusion under malformed requests. If you rely on reverse proxies like NGINX for access control, update immediately. This isn't theoretical - path confusion attacks have bypassed admin endpoint restrictions.

The Architecture That Actually Works

Serverless ETL Pipeline Architecture

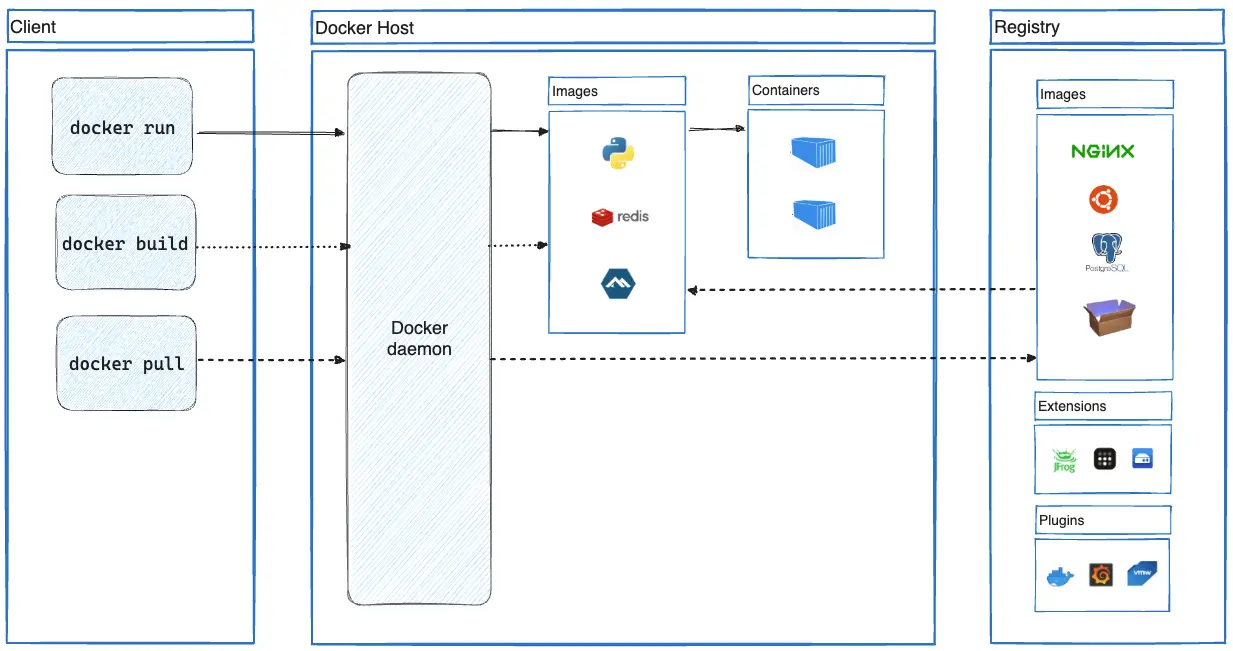
Modern serverless architecture for global API deployment with Hono and Cloudflare Workers. Source: Cloudflare Reference Architecture

Load balancing is where things get interesting. NGINX works great until you need to debug why 1% of requests are timing out. Turns out upstream health checks don't catch everything - our API was returning 200 OK while the database was completely locked up. Health checks that actually verify your database connection are worth their weight in gold.

AWS ALB sounds fancy but costs 3x more than NGINX for the same traffic. We switched back to self-managed NGINX after getting a $2,000 monthly ALB bill for a startup with 50,000 monthly users.

Database Connection Pooling

Database connection pooling will save your ass or end it. Start with 10 connections per container, not 15 - PostgreSQL defaults to 100 total connections and you'll hit that limit faster than you think. We had 12 containers trying to use 15 connections each. Math is hard at 3am.

Connection timeouts should be 10 seconds max, not 30. Hung connections are cancer - they tie up your pool while appearing "active" to monitoring. Prisma's connection pooling guide explains why shorter timeouts matter. PgBouncer can help manage this mess.

Horizontal scaling means everything breaks in new and exciting ways. Session data in Redis sounds simple until Redis goes down and you realize you have no session persistence fallback. We learned this during a AWS outage that took down ElastiCache. Users couldn't stay logged in for 3 hours.

File uploads to S3 work great until you hit the 5GB single-upload limit. Our users tried uploading large video files and got cryptic "EntityTooLarge" errors. Pre-signed URL multipart uploads are mandatory for anything over 100MB.

Security (Or How to Not Get Fired)

Security and Rate Limiting

HTTPS enforcement - obviously mandatory, but Let's Encrypt will fuck you over at the worst possible time. Certificates expire exactly when you're on vacation. We've been woken up at 4am by SSL certificate expiration alerts twice. Cloudflare's Universal SSL is worth it just for the sleep.

Rate limiting is where you learn about distributed systems the hard way. In-memory rate limiting works great with one server. Add a second server and suddenly half your users can bypass limits. Redis-backed rate limiting adds complexity but beats explaining to your boss why someone scraped your entire database.

Our rate limiter failed during a traffic spike when Redis hit memory limits. The fallback? No rate limiting at all. Learned that lesson during a DDoS that cost us $800 in AWS bandwidth charges.

Input validation with Zod is solid until someone sends you a JSON payload that's 50MB of nested objects. Zod will happily validate all 50MB while your server runs out of memory. Body size limits should be configured at the server level, not just application level.

Performance Optimization (The Hard-Learned Way)

Bundle optimization matters more than you think. Our initial Hono + Prisma + Auth0 bundle was 2.8MB, leading to 3-5 second cold starts. After tree-shaking and switching to native Web APIs, we got it down to 280KB. Cold starts dropped to 400-800ms.

esbuild is fast but breaks in subtle ways. External packages sometimes get bundled incorrectly, leading to runtime errors that only show up in production. Always test your bundled code before deploying.

Caching strategies are a double-edged sword. Redis caching cut our database load by 80%, but cache invalidation is the hardest problem in computer science for a reason. Stale user data led to customers seeing other people's orders. Cache TTL of 5 minutes for user-specific data, 1 hour for public data.

Cache stampedes will bring down your database. When cache expires under high load, every request hits the database simultaneously. Single-flight pattern in Vercel Edge Functions prevents this.

Memory management in Node.js is like playing Russian roulette. --max-old-space-size=1536 for a 2GB container leaves room for OS overhead. Set it too high and OOM killer will terminate your process without warning. Set it too low and garbage collection will eat your CPU.

Memory leaks are everywhere. This innocent-looking middleware caused a slow memory leak that crashed our production servers after 3 days. Always test with realistic load over time, not just burst traffic.

Deployment Automation (When It Works)

New in 2025: Hono v4.9+ includes the parseResponse utility for better RPC client error handling, plus improved CSRF protection with Fetch Metadata. Both essential for production APIs.

CI/CD pipelines are supposed to make life easier. They don't. GitHub Actions works great until you realize you're paying $0.008 per minute and your builds take 15 minutes because you're installing 300 NPM packages every time. Use Docker layer caching or prepare for sticker shock.

Security scanning in CI is security theater. Tools flag every transitive dependency as "critical" while missing actual vulnerabilities. We spent 3 weeks fixing false-positive vulnerabilities in dev dependencies that never reach production.

Blue-green deployments sound fancy but mean double the infrastructure costs. AWS CodeDeploy is expensive for small teams. We use a simpler approach: deploy to staging, run smoke tests, then promote the same Docker image to production. Works 95% of the time.

The 5% failure rate hits at 5pm on Friday. Health checks pass but the app is broken. That's why manual approval gates exist - someone needs to actually verify the deployment works before switching traffic.

Infrastructure as Code with Terraform is great until you need to make emergency changes. Terraform state files become corrupted at the worst times. We've bypassed Terraform during outages and spent hours reconciling state afterward. Keep manual runbooks for critical infrastructure changes.

Production Monitoring (When Your App Breaks at 3am)

Production Monitoring Dashboard

Your monitoring setup is perfect. Dashboards are green, alerts are silent. Then your phone buzzes at 3am because users can't log in, but all your metrics say everything is fine. Welcome to production monitoring reality - the thing you're not monitoring is always what breaks.

What Actually Breaks in Production

OpenTelemetry Tracing

Request tracing with OpenTelemetry sounds great until you realize it adds 20-50ms latency to every request. We turned off tracing for our hot paths after it became the performance bottleneck we were trying to debug. Jaeger helps with distributed tracing when it actually works.

Distributed tracing is useful when it works. Half the time, trace spans are missing or incomplete. Our authentication service shows up in traces but the database calls vanish into the void. Spent 2 weeks debugging phantom performance issues that only existed in the tracing data. Zipkin is an alternative that's equally frustrating.

Response time SLAs are meaningless. "Under 100ms for cached responses" - yeah, until the cache is cold, or Redis is having a bad day, or someone deployed code that does synchronous crypto operations. Real response times: 10ms best case, 2 seconds when everything goes wrong.

Error tracking with Sentry catches the errors you don't care about and misses the ones that matter. 500 alerts about "ResizeObserver loop limit exceeded" (thanks, Chrome), but radio silence when our payment processor API starts returning 500s.

Error rates above 0.5% mean something is seriously wrong, not 1%. By the time you hit 1% error rate, customers are already tweeting about your broken app.

Infrastructure That Lies to You

Prometheus Monitoring Architecture

Resource utilization monitoring tells you that CPU is at 40% while your app is completely unresponsive. Turns out Node.js event loop blocking doesn't show up in CPU metrics. Prometheus collects 847 metrics but none of them tell you why your API is timing out. Grafana makes pretty charts of useless data.

Memory consumption looks "stable" until it isn't. JavaScript memory leaks are slow and steady until they hit the limit and everything crashes. We monitor heap used, heap total, and heap committed, but the real metric that matters is "time until OOM killer terminates the process." Chrome DevTools helps debug memory leaks locally.

Kubernetes metrics are great for debugging Kubernetes, terrible for debugging applications. Pod restarts are a symptom, not the disease. Resource limits protect the cluster but kill your app in ways that are hard to debug. kubectl top shows resource usage but not why it's high.

Health checks are the most important thing you'll get wrong. Our /health endpoint returns 200 OK while the database connection pool is exhausted and users can't sign up. Health checks that only verify the app is running are useless - they need to verify the app is functional.

// Useless health check - management loves this shit
app.get('/health', (c) => c.text('OK')) // Says OK while everything burns

// Slightly better but still a lie
app.get('/health', async (c) => {
  await db.$queryRaw`SELECT 1` // Times out under load, naturally
  return c.text('OK')
})

// Actually useful (learned this the hard way)
app.get('/health', async (c) => {
  const checks = await Promise.allSettled([
    db.$queryRaw`SELECT 1`.then(() => 'ok').catch(() => 'down'),
    redis.ping().then(() => 'ok').catch(() => 'down'), 
    // TODO: check payment processor - broke prod twice
    // TODO: check email service - users can't reset passwords when down
  ])
  
  const allHealthy = checks.every(check => 
    check.status === 'fulfilled' && check.value === 'ok'
  )
  
  // Return 503 so load balancer actually removes us from rotation
  return c.json({ healthy: allHealthy }, allHealthy ? 200 : 503)
})

Logging Best Practices

Structured logging is what you'll wish you had set up properly after spending 6 hours trying to correlate errors across 15 different containers. JSON logs are a pain to set up but save your ass when production breaks. Winston works fine but will make your logs look like a JSON vomit factory.

import { logger } from 'hono/logger'

app.use(logger((message, ...rest) => {
  console.log(JSON.stringify({
    timestamp: new Date().toISOString(),
    level: 'info',
    message,
    metadata: rest,
    // This is stupid but it works - correlation IDs for tracing
    requestId: Math.random().toString(36) // TODO: use proper UUID lib
  }))
}))

Log aggregation is where you'll learn that the ELK stack costs more than your car payment and crashes more often than Internet Explorer. We switched to Loki after spending $2,000/month just to store logs we never actually read. AWS CloudWatch is expensive but at least it works when you desperately need to debug at 3am.

Security logging means watching failed login attempts pile up while your actual security breach goes unnoticed. Track auth failures, sure, but also track weird shit like users suddenly accessing APIs they've never touched. Our payment processor breach happened because nobody noticed a user started hitting every single customer endpoint in alphabetical order.

Performance Troubleshooting (When Everything is Slow)

Memory leak detection is what you'll be doing at 3am when your server crashes every 6 hours like clockwork. Node.js heap snapshots will tell you that 90% of your memory is "unknown" objects, which is super helpful for debugging. Memory should be stable across requests, but in reality it slowly creeps up until the OOM killer sends your process to hell.

Database performance is probably why your app is slow, not your brilliant code. PostgreSQL's EXPLAIN ANALYZE will show you that your "optimized" query is scanning 2 million rows to find 3 records. Connection pools run out at the worst possible time - like when your CEO is demoing the product to investors.

Cold start optimization in serverless is a losing battle. You bundle-split and tree-shake until your fingers bleed, then Cloudflare Workers still takes 800ms to boot up your "optimized" bundle. The metrics dashboard shows beautiful 50ms cold starts for hello-world, but real apps with Prisma? Different story.

Incident Response (When Everything Goes to Hell)

Alerting thresholds are the art of balancing "boy who cried wolf" with "everything is on fire and nobody noticed." Set error rates too low and you'll get 50 alerts for a single user with a bad browser. Too high and your entire user base is screaming on Twitter before you know there's a problem. 5% error rate for 5 minutes means it's definitely broken, not just "having a bad moment."

Automated recovery sounds smart until your circuit breaker decides to fail open during a real outage, making everything worse. Retry policies with exponential backoff are great until your retry logic creates a DDoS attack against your own database. I've seen systems recover themselves into a deeper hole.

Rollback procedures are what you'll desperately need when your "safe" deployment breaks everything. Blue-green sounds fancy but costs double the infrastructure. We just deploy to a canary, pray to the demo gods, then promote. Works until it doesn't, usually at the worst possible moment like during a board meeting.

Production Optimization (Or How to Make Things Less Broken)

Caching implementations will save your database or kill your consistency. Redis clustering sounds great until one node goes down and suddenly half your cache is missing. 90% cache hit rate looks amazing on dashboards until you realize the 10% of misses are the expensive queries that matter. Cache invalidation is still the hardest problem in computer science.

Content delivery networks are great until you need to purge cache at 2am and Cloudflare's purge API is rate-limited. AWS CloudFront takes 15 minutes to invalidate, which is 15 minutes too long when your homepage is showing last week's pricing. CDN cache headers are black magic that nobody fully understands.

Database optimization is an endless rabbit hole where every "fix" creates two new problems. Connection pooling helps until you run out of connections. Read replicas are great until the lag causes users to see stale data. PostgreSQL monitoring will show you 200 metrics but won't tell you why your users can't log in.

Production Deployment Platform Comparison

Platform

Cold Start

Scaling

Cost Model

Best For

Cloudflare Workers

50ms-1.2s (depending on bundle)

Automatic, global

Pay per request

Global APIs, edge computing

AWS Lambda

200ms-2s (Java/Python worse)

Auto-scaling

Pay per execution

Event-driven, AWS ecosystem

Node.js + Docker

2-15s (container startup)

Manual/auto

Fixed instance cost

Traditional hosting, full control

Vercel Edge Functions

100ms-800ms

Automatic

Pay per invocation

Frontend integration, JAMstack

Bun + Docker

1-8s (faster but unreliable)

Manual/auto

Fixed instance cost

Performance-critical apps

Deno Deploy

200ms-1s

Automatic

Pay per request

TypeScript-first, simple deployment

Production Deployment FAQ

Q

How do I handle database connections in production?

A

Your connection pool will run out at the worst possible time. Start with 10 connections per container, not 15. PostgreSQL defaults to 100 connections total and you'll hit that limit with 8-10 containers before you realize what's happening.

Prisma handles connection pooling but loves to hold connections open longer than you'd expect. Set connection_limit and pool_timeout explicitly or prepare for mysterious "database connection timeout" errors during traffic spikes.

For Cloudflare Workers, traditional connection pooling doesn't work because workers are stateless. Use D1 for SQLite or PlanetScale which has built-in connection pooling. We tried maintaining persistent connections in Workers - it doesn't work and you'll waste a week figuring that out.

Q

What's the proper way to handle environment variables in production?

A

Environment variables will bite you when you least expect it. Never hardcode secrets, but also don't assume environment variables are secure - they show up in process lists and error logs.

Validate environment variables at startup or your app will start successfully and fail mysteriously later. Ask me how I know - our payment processing broke for 4 hours because STRIPE_SECRET_KEY was undefined but the startup code didn't check.

Q

How do I implement proper logging for production?

A

Logging is where you'll learn about JSON parsing performance. Structured logging sounds great until you realize JSON.stringify() adds 5-10ms to every request. We moved to pino after our logging middleware became slower than our business logic.

import { pino } from 'pino'
const logger = pino()

app.use(async (c, next) => {
  const start = Date.now()
  await next()
  
  logger.info({
    method: c.req.method,
    path: c.req.path,
    status: c.res.status,
    duration: Date.now() - start,
    // Don't log user agents - they're massive and mostly useless
  })
})

Log aggregation will eat your budget. ELK stack costs $500/month for decent log retention. Splunk starts at $1,800/month and goes up from there. We switched to Loki and saved 80% on logging costs.

Pro tip: Log sampling. Don't log every successful request in production - log errors, slow requests (>500ms), and sample 1% of normal traffic. Your logs will be more useful and cheaper.

Q

What are the security requirements for production deployment?

A

HTTPS is mandatory for all production traffic. Use TLS 1.2 minimum, preferably TLS 1.3. Critical: Update to Hono v4.9.6+ immediately to fix the URL path parsing vulnerability (GHSA-9hp6-4448-45g2).

Implement security headers through helmet or custom middleware:

app.use('*', async (c, next) => {
  c.header('X-Content-Type-Options', 'nosniff')
  c.header('X-Frame-Options', 'DENY')
  c.header('X-XSS-Protection', '1; mode=block')
  c.header('Strict-Transport-Security', 'max-age=31536000')
  await next()
})

Input validation must validate all user inputs. Use Zod schemas with Hono's validator middleware to prevent injection attacks and ensure data integrity.

Q

How do I handle application errors in production?

A

Comprehensive error handling prevents application crashes and provides useful debugging information.

New in Hono v4.9+: Use the parseResponse utility for better RPC client error handling:

import { parseResponse, DetailedError } from 'hono/client'

const result = await parseResponse(client.api.$get()).catch(
  (e: DetailedError) => {
    console.error('API call failed:', e.message)
    return null
  }
)

Traditional error handling:

app.onError((err, c) => {
  console.error({
    timestamp: new Date().toISOString(),
    error: err.message,
    stack: err.stack,
    path: c.req.path,
    method: c.req.method
  })
  
  return c.json({
    error: 'Internal server error',
    requestId: crypto.randomUUID()
  }, 500)
})

Error monitoring services like Sentry provide real-time error tracking with context and performance impact analysis.

Q

How do I implement health checks for load balancers?

A

Health check endpoints verify application readiness:

app.get('/health', async (c) => {
  try {
    // Verify database connectivity
    await db.$queryRaw`SELECT 1`
    
    // Check external services
    await fetch('https://external-api.com/health')
    
    return c.json({
      status: 'healthy',
      timestamp: new Date().toISOString(),
      uptime: process.uptime(),
      checks: {
        database: 'ok',
        external_api: 'ok'
      }
    })
  } catch (error) {
    return c.json({
      status: 'unhealthy',
      error: error.message
    }, 503)
  }
})

Load balancers should be configured to check health endpoints every 30 seconds with a 5-second timeout.

Q

What's the recommended deployment strategy for zero downtime?

A

Blue-green deployments eliminate downtime during updates. Deploy the new version to a parallel environment, verify functionality, then switch traffic:

  1. Deploy new version to green environment
  2. Run health checks and smoke tests
  3. Switch load balancer traffic to green
  4. Monitor metrics for anomalies
  5. Keep blue environment for quick rollback

Rolling updates work well for containerized deployments, updating instances gradually while maintaining service availability.

Q

How do I optimize Hono applications for production performance?

A

Bundle optimization significantly impacts cold start times:

  • Use tree-shaking to eliminate unused code
  • Minimize dependencies, especially those with large dependency trees
  • Use esbuild or similar tools for production builds

Caching strategies reduce database load and improve response times:

  • Implement Redis caching for frequently accessed data
  • Use CDN caching for static assets and cacheable API responses
  • Consider application-level caching for expensive computations

Database optimization maintains performance under load:

  • Use connection pooling appropriately for your runtime
  • Implement proper indexes for frequent query patterns
  • Consider read replicas for read-heavy workloads
Q

What monitoring tools work best with Hono in production?

A

Application Performance Monitoring (APM) solutions provide comprehensive visibility:

  • New Relic offers excellent Node.js and serverless monitoring
  • DataDog provides infrastructure and application monitoring
  • Honeycomb excels at distributed tracing and observability

Custom metrics through Prometheus enable detailed performance tracking specific to your application needs.

Q

How do I handle file uploads in production?

A

Direct cloud storage uploads are recommended for production systems:

  • Generate presigned URLs for client-side uploads to S3/R2/GCS
  • Validate file types and sizes before generating upload URLs
  • Process uploaded files asynchronously through queues

Avoid storing files locally in serverless environments or containers, as they lack persistent storage.

Q

What's the best practice for API versioning in production?

A

URL versioning provides clear API evolution paths:

const v1 = new Hono().basePath('/api/v1')
const v2 = new Hono().basePath('/api/v2')

v1.get('/users', handleV1Users)
v2.get('/users', handleV2Users)

app.route('/api/v1', v1)
app.route('/api/v2', v2)

Header-based versioning works well for backward-compatible changes, while URL versioning handles breaking changes better.

Resources That Actually Help (Not Just Marketing)

Related Tools & Recommendations

tool
Similar content

Express.js - The Web Framework Nobody Wants to Replace

It's ugly, old, and everyone still uses it

Express.js
/tool/express/overview
100%
compare
Recommended

I Benchmarked Bun vs Node.js vs Deno So You Don't Have To

Three weeks of testing revealed which JavaScript runtime is actually faster (and when it matters)

Bun
/compare/bun/node.js/deno/performance-comparison
96%
tool
Similar content

Node.js Production Deployment - How to Not Get Paged at 3AM

Optimize Node.js production deployment to prevent outages. Learn common pitfalls, PM2 clustering, troubleshooting FAQs, and effective monitoring for robust Node

Node.js
/tool/node.js/production-deployment
80%
tool
Similar content

Node.js Deployment Strategies: Master CI/CD, Serverless & Containers

Master Node.js deployment strategies, from traditional servers to modern serverless and containers. Learn to optimize CI/CD pipelines and prevent production iss

Node.js
/tool/node.js/deployment-strategies
76%
tool
Similar content

Hono Overview: Fast, Lightweight Web Framework for Production

12KB total. No dependencies. Faster cold starts than Express.

Hono
/tool/hono/overview
74%
howto
Similar content

Bun Production Deployment Guide: Docker, Serverless & Performance

Master Bun production deployment with this comprehensive guide. Learn Docker & Serverless strategies, optimize performance, and troubleshoot common issues for s

Bun
/howto/setup-bun-development-environment/production-deployment-guide
67%
tool
Similar content

Qwik Production Deployment: Edge, Scaling & Optimization Guide

Real-world deployment strategies, scaling patterns, and the gotchas nobody tells you

Qwik
/tool/qwik/production-deployment
67%
compare
Recommended

Which Node.js framework is actually faster (and does it matter)?

Hono is stupidly fast, but that doesn't mean you should use it

Hono
/compare/hono/express/fastify/koa/overview
66%
tool
Similar content

HTMX Production Deployment - Debug Like You Mean It

Master HTMX production deployment. Learn to debug common issues, secure your applications, and optimize performance for a smooth user experience in production.

HTMX
/tool/htmx/production-deployment
64%
tool
Similar content

Supabase Production Deployment: Best Practices & Scaling Guide

Master Supabase production deployment. Learn best practices for connection pooling, RLS, scaling your app, and a launch day survival guide to prevent crashes an

Supabase
/tool/supabase/production-deployment
64%
tool
Similar content

Cursor Security & Enterprise Deployment: Best Practices & Fixes

Learn about Cursor's enterprise security, recent critical fixes, and real-world deployment patterns. Discover strategies for secure on-premises and air-gapped n

Cursor
/tool/cursor/security-enterprise-deployment
64%
tool
Similar content

Hono Performance Optimization: Eliminate Cold Starts & API Lag

Optimize Hono API performance by tackling cold starts, common middleware mistakes, and other bottlenecks. Learn how to build faster, more efficient Hono applica

Hono
/tool/hono/performance-optimization
60%
tool
Similar content

Neon Serverless PostgreSQL: An Honest Review & Production Insights

PostgreSQL hosting that costs less when you're not using it

Neon
/tool/neon/overview
59%
tool
Similar content

Bolt.new Production Deployment Troubleshooting Guide

Beyond the demo: Real deployment issues, broken builds, and the fixes that actually work

Bolt.new
/tool/bolt-new/production-deployment-troubleshooting
55%
howto
Similar content

Deploy Django with Docker Compose - Complete Production Guide

End the deployment nightmare: From broken containers to bulletproof production deployments that actually work

Django
/howto/deploy-django-docker-compose/complete-production-deployment-guide
55%
tool
Similar content

LangChain Production Deployment Guide: What Actually Breaks

Learn how to deploy LangChain applications to production, covering common pitfalls, infrastructure, monitoring, security, API key management, and troubleshootin

LangChain
/tool/langchain/production-deployment-guide
55%
tool
Similar content

BentoML Production Deployment: Secure & Reliable ML Model Serving

Deploy BentoML models to production reliably and securely. This guide addresses common ML deployment challenges, robust architecture, security best practices, a

BentoML
/tool/bentoml/production-deployment-guide
55%
tool
Similar content

Fix Astro Production Deployment Nightmares: Troubleshooting Guide

Troubleshoot Astro production deployment issues: fix 'JavaScript heap out of memory' build crashes, Vercel 404s, and server-side problems. Get platform-specific

Astro
/tool/astro/production-deployment-troubleshooting
53%
tool
Similar content

Vercel Overview: Deploy Next.js Apps & Get Started Fast

Get a no-bullshit overview of Vercel for Next.js app deployment. Learn how to get started, understand costs, and avoid common pitfalls with this practical guide

Vercel
/tool/vercel/overview
50%
troubleshoot
Similar content

FastAPI Deployment Errors: Debugging & Troubleshooting Guide

Your 3am survival manual for when FastAPI production deployments explode spectacularly

FastAPI
/troubleshoot/fastapi-production-deployment-errors/deployment-error-troubleshooting
50%

Recommendations combine user behavior, content similarity, research intelligence, and SEO optimization