Memory Management: Stop the JavaScript Heap Crashes

GitHub issue showing Gatsby memory leak discussion

The most common Gatsby build failure isn't complexity - it's running out of memory. The Node.js documentation explains heap limits, but Gatsby pushes past them. If you're seeing this error, you're not alone - Stack Overflow has hundreds of related issues:

FATAL ERROR: Reached heap limit Allocation failed - JavaScript heap out of memory

This happens because Gatsby loads everything into memory at once instead of streaming like modern frameworks such as Next.js. The V8 JavaScript engine wasn't designed for this pattern. Here's how to survive until you can escape.

The Memory Limit Bandaid

Your first line of defense is increasing Node's memory limit. Most developers try 4GB and watch it still crash. Skip the baby steps:

NODE_OPTIONS=\"--max-old-space-size=8192\"

That gives Node 8GB of heap space. Still crashing? Try 16GB:

NODE_OPTIONS=\"--max-old-space-size=16384\"

If you need more than 16GB to build a website, your framework is fundamentally broken and you need to migrate immediately. GitHub Actions runners max out at 7GB, so this becomes a real blocker.

For GitHub Actions, add this to your workflow:

- name: Build site
  env:
    NODE_OPTIONS: \"--max-old-space-size=8192\"
  run: npm run build

Memory Profiling: Find What's Actually Leaking

Want to see exactly where your memory goes? Run this and watch the carnage:

node --inspect node_modules/.bin/gatsby build

Open Chrome DevTools (chrome://inspect), click your Node target, go to Memory tab, take heap snapshots during the build. The memory profiling guide explains the process. You'll see memory climbing from 500MB to 6GB+ and never coming down.

The leak is usually in source-and-transform-nodes phase. Gatsby's GraphQL layer loads all your data at once and holds references even after transforming. Nothing you can do about it - just increase memory and pray.

Plugin Memory Bombs

Some plugins are memory grenades waiting to explode:

gatsby-plugin-sharp is the worst offender. If you have 500+ images, it'll eat 6GB+ during processing. Each image transformation loads the full image into memory, processes all sizes, then sometimes forgets to clean up.

gatsby-source-contentful with 10k+ entries will consume 2GB+ just parsing the GraphQL responses. The plugin loads every single entry into memory before creating nodes.

gatsby-transformer-remark with syntax highlighting can leak memory on large codebases. Each code block gets processed through Prism.js and the AST nodes stick around.

Check your memory usage by plugin:

gatsby build --verbose 2>&1 | grep \"source and transform\"

If you see one plugin taking 90% of the time, that's your memory hog.

The Cache Savior (When It Works)

Keep your .cache and public folders between builds. This is the difference between 47 minutes and 6 minutes:

## DON'T do this in CI/CD
gatsby clean && gatsby build

## DO this instead  
gatsby build

For Netlify, install the Essential Gatsby Plugin:

[[plugins]]
  package = \"@netlify/plugin-gatsby\"

For GitHub Actions, cache these directories:

- name: Cache Gatsby
  uses: actions/cache@v3
  with:
    path: |
      .cache
      public
    key: gatsby-${{ hashFiles('package-lock.json') }}

Warning: The cache sometimes gets corrupted and makes builds slower. If builds suddenly take 2x longer, delete .cache and start over. Usually happens after Gatsby version updates or plugin changes.

Image Optimization: Stop Processing Giants

Your 8MB photographer images don't need to be 8MB in git. Resize them before committing:

## Install sharp-cli globally
npm install -g sharp-cli

## Resize all images to max 2000px width
find ./src/images -name \"*.jpg\" -exec sharp resize 2000 {} \; 

Or use squoosh.app to manually optimize before committing. A 5MB image that gets resized to 1200px for web display should be 200KB max.

Pro tip: Set up a pre-commit hook to resize images automatically:

#!/bin/sh
find . -name \"*.jpg\" -size +1M -exec echo \"Image {} is too large (>1MB)\" \; -exec false \;

The Nuclear Option: Skip Image Processing

If you're using an external image service like Cloudinary or Imgix, you can skip Gatsby's image processing entirely:

// gatsby-config.js
module.exports = {
  plugins: [
    // Remove gatsby-plugin-sharp and gatsby-transformer-sharp
    // Use gatsby-transformer-cloudinary instead
    {
      resolve: 'gatsby-transformer-cloudinary',
      options: {
        cloudName: 'your-cloud-name',
        apiKey: 'your-api-key',
        apiSecret: 'your-api-secret',
      },
    },
  ],
}

Build time drops from 30 minutes to 3 minutes because you're not processing thousands of images locally. Images load from Cloudinary's CDN with automatic optimization. The Gatsby image docs don't mention this workaround, but performance case studies show external image services can be faster than local processing.

This is how you survive until migration. It's not pretty, but it works. Migration guides are available when you're ready to escape.
Frequently Asked Questions

Q

Why does my build crash at exactly the same page every time?

A

It's not the page that's broken

  • it's the memory limit. Gatsby loads everything sequentially, and when it hits page 8,127 (or whatever your magic number is), that's when memory usage crosses the threshold. The "Men's Blue Cotton T-Shirt" page isn't special
  • it's just when the heap finally explodes. Increase --max-old-space-size to 8192 and watch it crash at page 12,489 instead.
Q

My build worked fine on Gatsby 4.15, why does 4.24+ crash?

A

GitHub issue #36899 documented a memory leak introduced in 4.24+. Memory usage went from 2.5GB to 4.7GB for the same codebase. Nobody fixed it and nobody will.Downgrade to 4.15.2 or accept that you need 8GB+ RAM for builds now.

Q

Why doesn't `gatsby clean` fix my memory issues?

A

gatsby clean deletes the cache, which makes your next build even slower. The memory leak happens during initial data processing, not from cached files. You're just making the problem worse by forcing full rebuilds every time.Only run gatsby clean when the cache is corrupted (builds suddenly taking 2x longer).

Q

Can I run Gatsby builds in Docker with memory limits?

A

Barely. You need at least 8GB containers for medium sites:

docker run --memory=8g node:16 npm run build

Most CI systems default to 2GB containers, which crash immediately. GitHub Actions Standard runners have 7GB available, which is cutting it close for larger sites.

Q

Is there a way to profile which GraphQL queries use the most memory?

A

Not really. Gatsby loads all data into memory before query processing starts, so every query sees the full dataset. The memory usage is in the data loading phase, not the query execution.You can see which source plugins load the most data:

gatsby build --verbose | grep "source and transform"

But there's no query-level profiling. The entire data layer is designed wrong.

Q

Why do image builds randomly succeed/fail?

A

Image processing happens in parallel, and parallel operations compete for memory. Sometimes the garbage collector runs at the right moment, sometimes it doesn't. It's basically random.This is why you need retry logic in CI/CD:

- name: Build with retry
  uses: nick-fields/retry@v2
  with:
    timeout_minutes: 60  
    max_attempts: 3
    command: npm run build

Usually works on attempt 2-3. If it fails 3 times in a row, increase memory limits.

Q

How do I know if plugins are conflicting or just using too much memory?

A

Plugin conflicts cause weird GraphQL errors or missing data. Memory issues cause heap crashes with stack traces pointing to V8 internals.If you see Mark-Sweep and Scavenge in the error, it's memory. If you see plugin names in the stack trace, it's conflicts.

Build Optimization Techniques: What Actually Works

Technique

Time Savings

Memory Impact

Effort

Success Rate

Notes

Increase NODE_OPTIONS Memory

None

Prevents crashes

5 minutes

90%

First thing to try. 8GB minimum, 16GB for large sites

Cache .cache/public Folders

80-90% after first build

No change

1 hour setup

95%

Game changer. Must-have for CI/CD

Resize Images Before Commit

30-50% for image-heavy sites

60-80% reduction

2-3 hours

85%

Sharp-cli or squoosh.app. Prevents most image memory issues

Skip Image Processing (Cloudinary)

70-90% for image sites

90% reduction

1-2 days migration

95%

Nuclear option. Works but requires refactoring

Remove Unused Plugins

10-20% per plugin

20-40% per plugin

30 minutes

100%

Easy wins. Check if you actually use analytics/SEO plugins

Parallel Image Processing

30-40% for image-heavy

Increases memory usage

4+ hours setup

60%

Experimental. Can make memory issues worse

GraphQL Query Optimization

5-15%

10-30%

2-4 hours

70%

Limited impact. Gatsby loads everything anyway

Downgrade to Gatsby 4.15.2

None

50% reduction

1 hour + testing

80%

Fixes 4.24+ memory leaks but breaks newer features

gatsby clean Before Every Build

-50% (makes it worse)

No change

None

0%

Don't do this. Destroys caching benefits

Advanced Techniques for Desperate Times

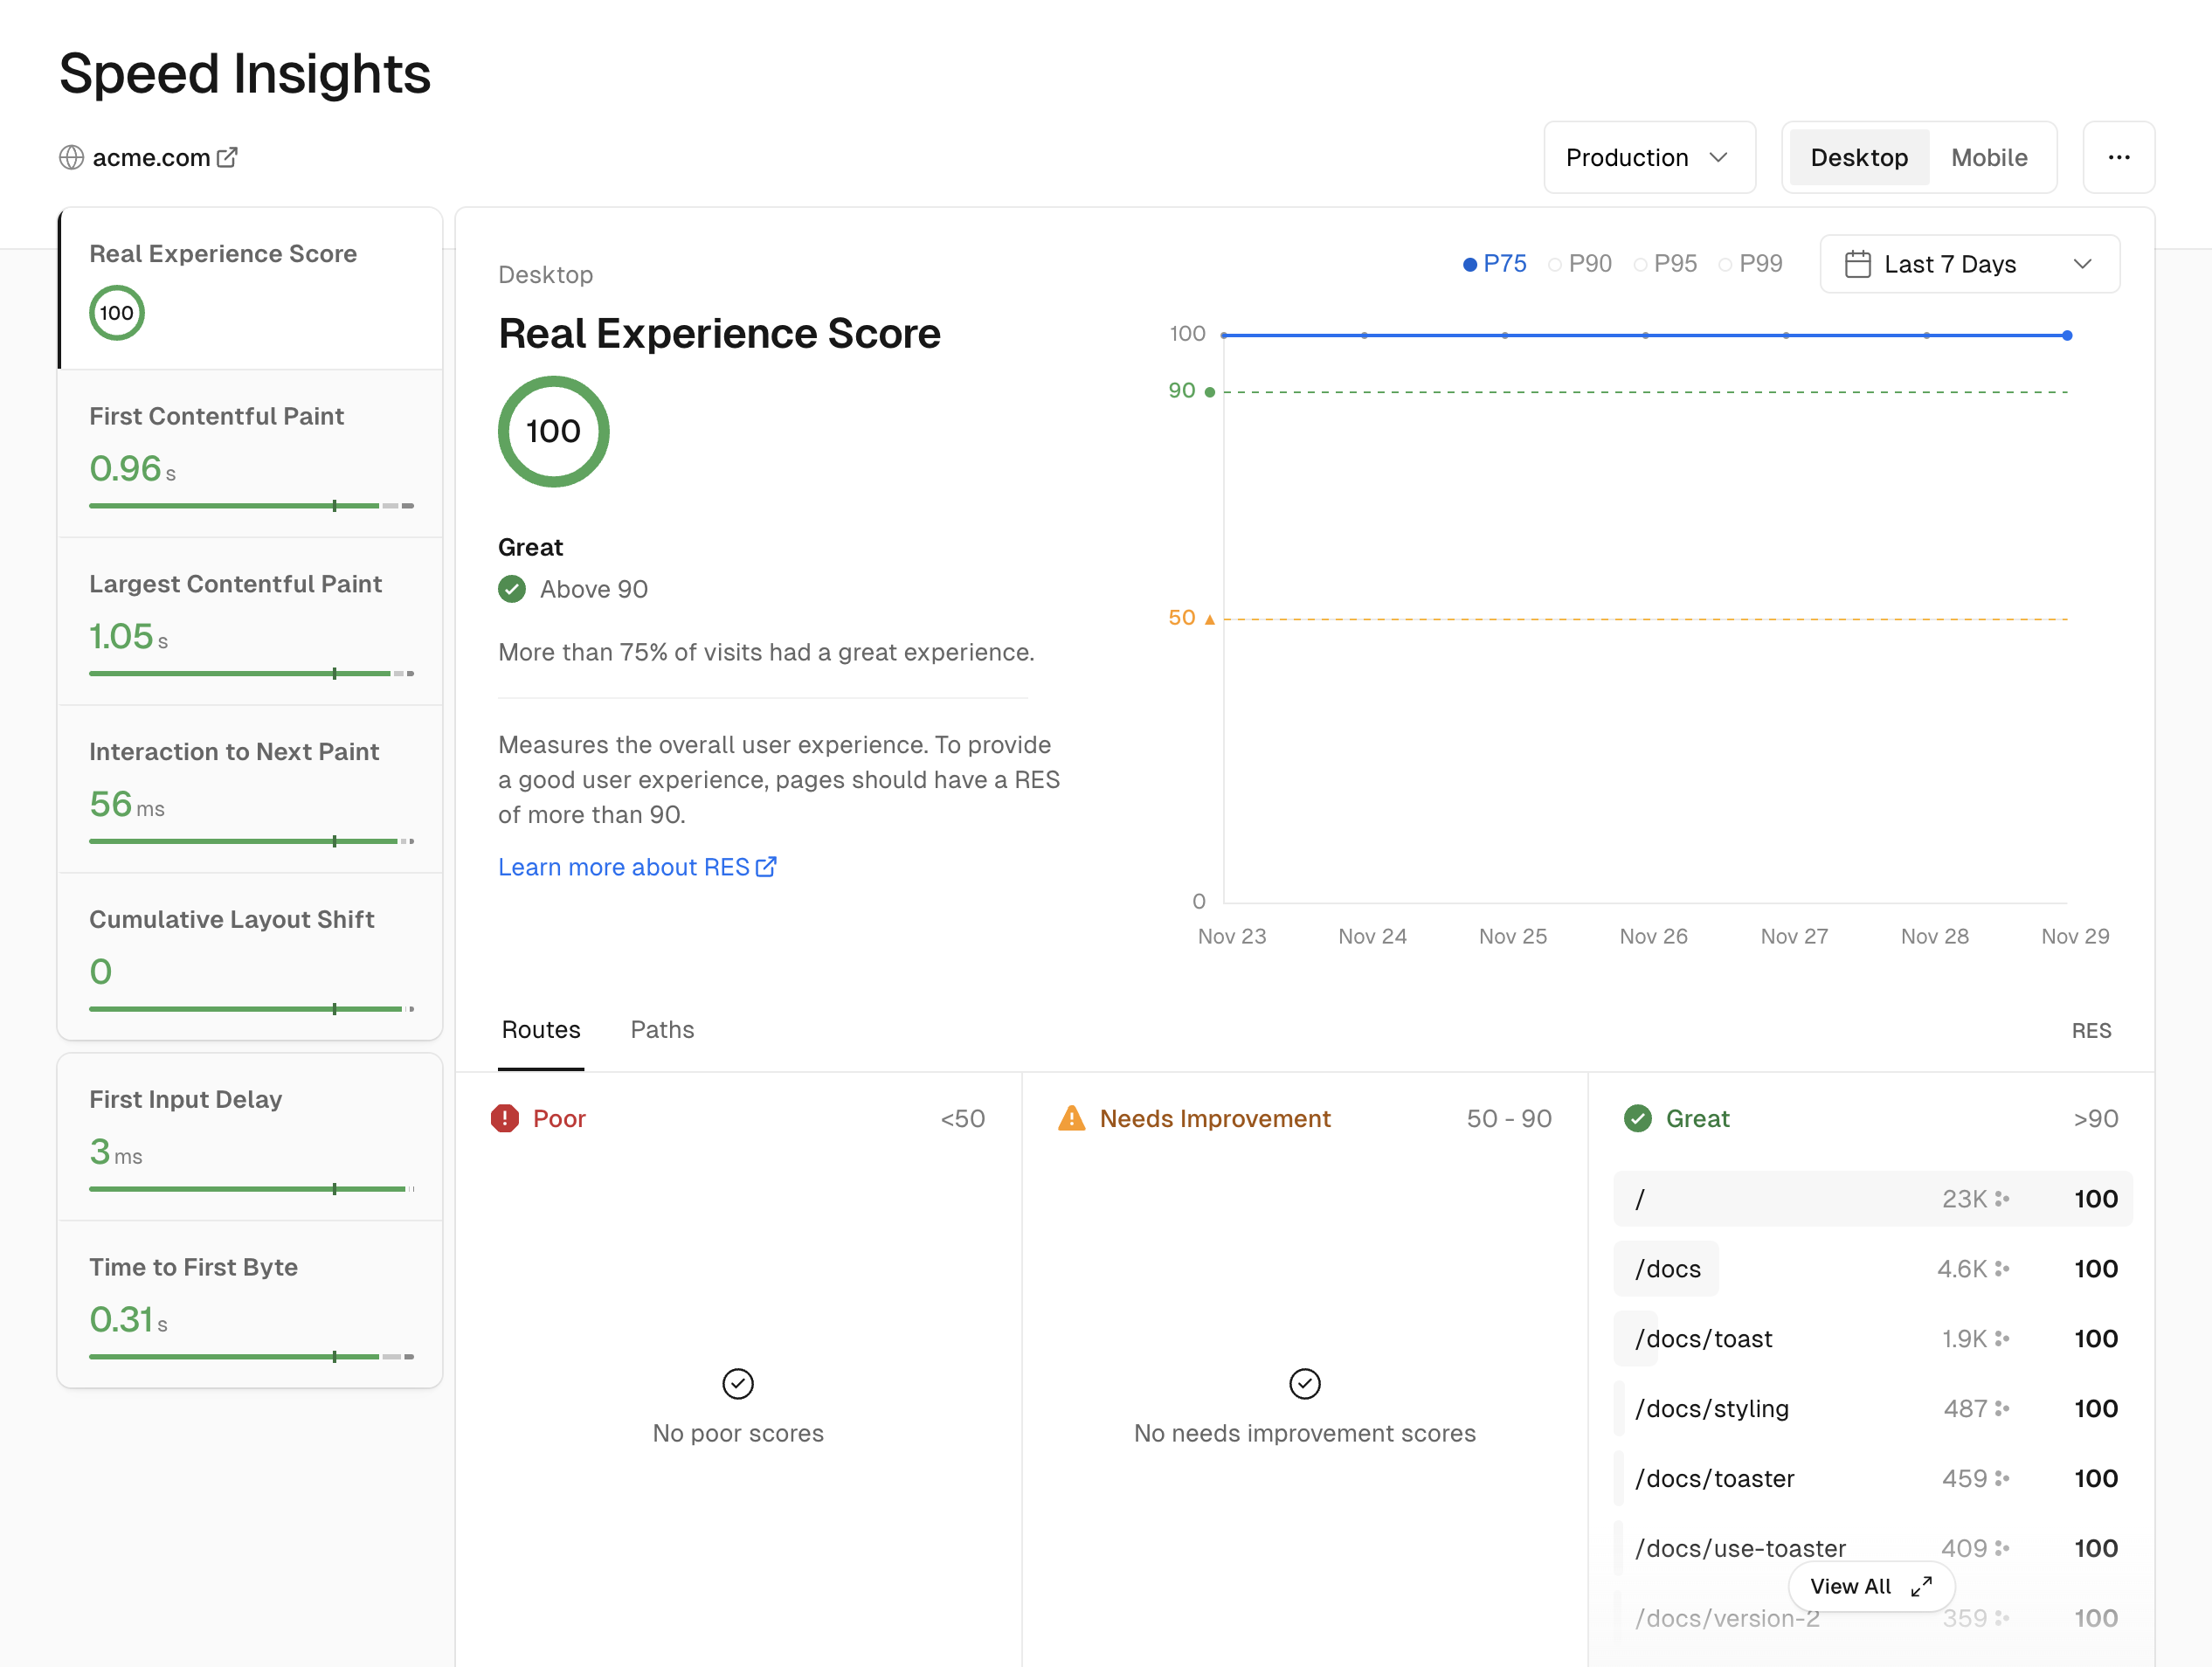
Vercel Speed Insights dashboard showing performance monitoring

When basic memory fixes aren't enough and your builds are still failing, these advanced techniques might buy you more time before migration.

Parallel Processing: The Double-Edged Sword

Gatsby normally processes everything sequentially. You can enable parallel processing for certain operations, but it's a gamble - sometimes faster, sometimes uses more memory and crashes harder. The Gatsby performance docs mention these flags but don't explain the memory trade-offs. See the Node.js worker threads documentation for underlying implementation details and V8 memory management for memory behavior.

For image processing, try this experimental flag:

// gatsby-config.js
module.exports = {
  flags: {
    PARALLEL_PROCESSING: true,
    PARALLEL_SOURCING: true,
  }
}

Monitor memory usage closely. On an 8-core machine, this can cut image processing time by 60% but uses 3x more peak memory. If you have the RAM headroom, it's worth trying.

Source Plugin Optimization: Stop Loading Everything

Most source plugins are dumb and load everything by default. The official plugin docs rarely mention optimization options. You can usually configure them to load less data by reading the source code directly:

gatsby-source-contentful:

{
  resolve: 'gatsby-source-contentful',
  options: {
    spaceId: 'your-space-id',
    accessToken: 'your-token',
    // Only load specific content types
    contentTypes: ['blogPost', 'author'],
    // Skip downloading asset files
    downloadLocal: false,
  }
}

gatsby-source-shopify:

{
  resolve: 'gatsby-source-shopify',
  options: {
    password: 'your-password',
    storeUrl: 'your-store.myshopify.com',
    // Skip unused data
    salesChannel: 'online_store',
    includeCollections: ['featured'],
  }
}

Each content type you skip saves 200-500MB of memory during processing. The Contentful docs explain query optimization, but the Gatsby plugin implementation doesn't follow their best practices.

webpack Bundle Analysis: Find the Real Bloat

Large JavaScript bundles slow builds because webpack takes forever to process them. The webpack documentation covers optimization, but Gatsby's webpack config makes it harder to debug. Find your biggest modules:

npm install -g webpack-bundle-analyzer
gatsby build --prefix-paths
npx webpack-bundle-analyzer public/webpack-runtime-*.js

Common bloat sources:

  • lodash (400KB) - use lodash-es or individual functions
  • moment.js (300KB) - switch to date-fns or dayjs
  • material-ui icons (2MB+) - import individual icons
  • syntax highlighting (500KB+) - lazy load Prism.js

Remove unused imports and switch to lighter alternatives. A 2MB bundle reduction can cut build time by 5-10 minutes.

GraphQL Query Batching: Reduce Memory Pressure

Instead of one massive query loading all data, break it into smaller chunks:

Bad:

query AllData {
  allMarkdownRemark { nodes { frontmatter { title } html } }
  allContentfulPost { nodes { title body } }
  allShopifyProduct { nodes { title variants { price } } }
}

Better:

// Use separate page queries and combine data in components
export const query = graphql`
  query BlogQuery($limit: Int = 50) {
    allMarkdownRemark(limit: $limit) {
      nodes { frontmatter { title } }
    }
  }
`

Process data in pages of 50-100 items instead of loading thousands at once. Memory usage stays flat instead of climbing exponentially.

Build Environment Tuning

Your build environment matters more than you think:

Node.js version: Stick with Node 16.x. Node 18+ changed garbage collection and uses more memory with Gatsby. This isn't documented anywhere official, but GitHub issues show the pattern. Node 14 is too old and missing optimizations, while Node 20 breaks even more things. Check the Node.js compatibility matrix and V8 changelog for garbage collection changes affecting build performance.

CI/CD machine specs:

  • Minimum: 4 CPU cores, 8GB RAM
  • Recommended: 8 CPU cores, 16GB RAM
  • Large sites: 16+ CPU cores, 32GB RAM

See GitHub Actions hardware specs and Vercel build limits for platform-specific requirements.

Environment variables for optimization:

## Faster garbage collection
export NODE_OPTIONS=\"--max-old-space-size=8192 --optimize-for-size\"

## Better memory allocation  
export UV_THREADPOOL_SIZE=8

## Disable source maps in CI (saves memory)
export GATSBY_TELEMETRY_DISABLED=1
export NODE_ENV=production

Database Query Optimization (For CMS Integration)

If you're using a headless CMS, optimize your queries there too. The JAMstack documentation mentions this but doesn't give specific examples for GraphQL optimization:

Contentful GraphQL:

query OptimizedQuery($limit: Int = 50) {
  blogPostCollection(limit: $limit, order: publishDate_DESC) {
    items {
      title
      slug  
      publishDate
      # Don't fetch body/content in list queries
      # Load it per-page instead
    }
  }
}

WordPress REST API:

## Only fetch published posts
/wp-json/wp/v2/posts?status=publish&_fields=id,title,slug,date

## Paginate large datasets  
/wp-json/wp/v2/posts?per_page=50&page=1

Loading 10,000 blog post bodies in one query uses 500MB+. Loading just titles/slugs uses 20MB.

The Monitoring Setup That Saves Sanity

Set up build monitoring so you know when things break before users complain:

## Install build monitoring
npm install --save-dev @gatsbyjs/plugin-utils

## Add to package.json
\"scripts\": {
  \"build\": \"gatsby build\",
  \"build:analyze\": \"gatsby build --profile --report\"
}

Track these metrics:

  • Build duration over time
  • Memory usage peaks
  • Cache hit/miss ratios
  • Plugin execution times
  • Bundle size changes

When build time jumps 50%+ overnight, you know exactly what changed and can revert quickly.

When to Give Up and Migrate

These optimizations can extend Gatsby's life, but there are hard limits:

Red flags that mean migrate NOW:

  • Needing 32GB+ RAM for builds
  • Build success rate below 70% even with retries
  • Spending more than 4 hours/week fighting build issues
  • Cache corruption happening weekly
  • Unable to upgrade Node.js due to compatibility

Green flags that mean optimize instead:

  • Builds work with 8-16GB RAM
  • Success rate above 90% with current setup
  • Memory usage is predictable and stable
  • Team understands the limitations and workarounds

The goal isn't to make Gatsby perfect - it's to buy time for a proper migration while keeping the site running. These techniques can get you 6-18 more months before the technical debt becomes unbearable.

Essential Tools for Gatsby Performance Debugging

Related Tools & Recommendations

tool
Similar content

Webpack: The Build Tool You'll Love to Hate & Still Use in 2025

Explore Webpack, the JavaScript build tool. Understand its powerful features, module system, and why it remains a core part of modern web development workflows.

Webpack
/tool/webpack/overview
100%
tool
Similar content

Webpack Performance Optimization: Fix Slow Builds & Bundles

Optimize Webpack performance: fix slow builds, reduce giant bundle sizes, and implement production-ready configurations. Improve app loading speed and user expe

Webpack
/tool/webpack/performance-optimization
75%
tool
Similar content

SvelteKit: Fast Web Apps & Why It Outperforms Alternatives

I'm tired of explaining to clients why their React checkout takes 5 seconds to load

SvelteKit
/tool/sveltekit/overview
68%
tool
Similar content

Surviving Gatsby Plugin Hell: Maintain Abandoned Plugins in 2025

How to maintain abandoned plugins without losing your sanity (or your job)

Gatsby
/tool/gatsby/plugin-hell-survival
60%
tool
Similar content

Protocol Buffers: Troubleshooting Performance & Memory Leaks

Real production issues and how to actually fix them (not just optimize them)

Protocol Buffers
/tool/protocol-buffers/performance-troubleshooting
60%
compare
Recommended

Framework Wars Survivor Guide: Next.js, Nuxt, SvelteKit, Remix vs Gatsby

18 months in Gatsby hell, 6 months testing everything else - here's what actually works for enterprise teams

Next.js
/compare/nextjs/nuxt/sveltekit/remix/gatsby/enterprise-team-scaling
59%
tool
Similar content

Vite: The Fast Build Tool - Overview, Setup & Troubleshooting

Dev server that actually starts fast, unlike Webpack

Vite
/tool/vite/overview
53%
tool
Similar content

Gatsby's Decline: Slow Builds, Memory Leaks & Netlify Impact

And why you shouldn't start new projects with it in 2025

Gatsby
/tool/gatsby/overview
52%
tool
Similar content

When Gatsby Still Works Well in 2025: Use Cases & Successes

Yeah, it has problems, but here's when it's still your best bet

Gatsby
/tool/gatsby/when-gatsby-works-well
52%
tool
Similar content

pandas Overview: What It Is, Use Cases, & Common Problems

Data manipulation that doesn't make you want to quit programming

pandas
/tool/pandas/overview
47%
tool
Similar content

React Production Debugging: Fix App Crashes & White Screens

Five ways React apps crash in production that'll make you question your life choices.

React
/tool/react/debugging-production-issues
47%
tool
Similar content

LM Studio Performance: Fix Crashes & Speed Up Local AI

Stop fighting memory crashes and thermal throttling. Here's how to make LM Studio actually work on real hardware.

LM Studio
/tool/lm-studio/performance-optimization
47%
tool
Similar content

PostgreSQL: Why It Excels & Production Troubleshooting Guide

Explore PostgreSQL's advantages over other databases, dive into real-world production horror stories, solutions for common issues, and expert debugging tips.

PostgreSQL
/tool/postgresql/overview
47%
tool
Similar content

Gatsby to Next.js Migration: Costs, Timelines & Gotchas

Real costs, timelines, and gotchas from someone who survived the process

Gatsby
/tool/gatsby/migration-strategy
43%
tool
Similar content

Node.js Performance Optimization: Boost App Speed & Scale

Master Node.js performance optimization techniques. Learn to speed up your V8 engine, effectively use clustering & worker threads, and scale your applications e

Node.js
/tool/node.js/performance-optimization
42%
tool
Similar content

Turbopack: Why Switch from Webpack? Migration & Future

Explore Turbopack's benefits over Webpack, understand migration, production readiness, and its future as a standalone bundler. Essential insights for developers

Turbopack
/tool/turbopack/overview
40%
integration
Recommended

I Spent Two Weekends Getting Supabase Auth Working with Next.js 13+

Here's what actually works (and what will break your app)

Supabase
/integration/supabase-nextjs/server-side-auth-guide
40%
tool
Recommended

Next.js - React Without the Webpack Hell

competes with Next.js

Next.js
/tool/nextjs/overview
40%
tool
Similar content

PostgreSQL Performance Optimization: Master Tuning & Monitoring

Optimize PostgreSQL performance with expert tips on memory configuration, query tuning, index design, and production monitoring. Prevent outages and speed up yo

PostgreSQL
/tool/postgresql/performance-optimization
38%
troubleshoot
Similar content

Fix Docker Build Context Too Large: Optimize & Reduce Size

Learn practical solutions to fix 'Docker Build Context Too Large' errors. Optimize your Docker builds, reduce context size from GBs to MBs, and speed up develop

Docker Engine
/troubleshoot/docker-build-context-too-large/context-optimization-solutions
38%

Recommendations combine user behavior, content similarity, research intelligence, and SEO optimization