Consumer lag monitoring is a nightmare. I've wasted weeks tuning thresholds that either fire constantly during traffic spikes or miss dead consumers for hours.
First time I set up Kafka monitoring, I used JMX metrics and Prometheus. Set the lag threshold to like 10,000 messages because that's what some tutorial said. Black Friday hits, traffic doubles, every single alert fires at 2AM. Ops team is fucking pissed. So I raise the threshold to 50,000 or something. Few weeks later, a consumer dies on Thursday afternoon and sits dead all weekend because something like 45,000 messages of lag was "fine" according to my brilliant threshold.
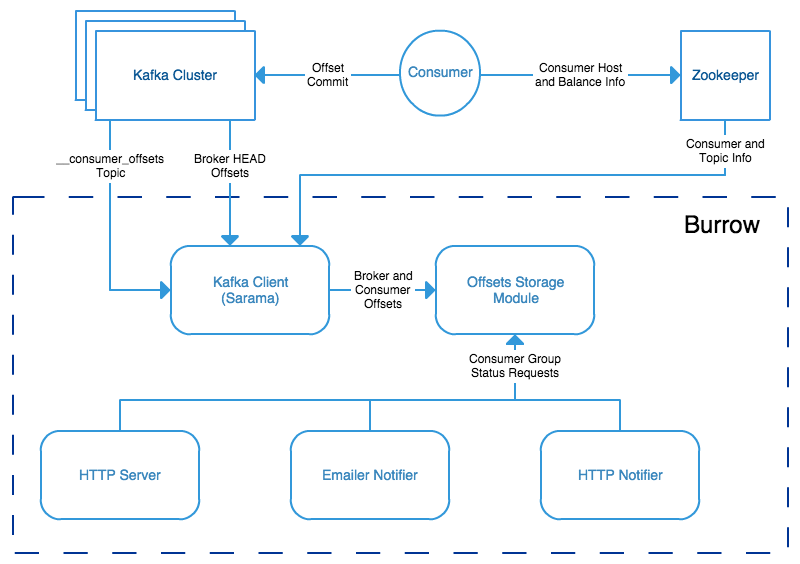
So Burrow does this clever shit - it reads the __consumer_offsets topic that Kafka uses internally to track where consumers are. No per-app JMX bullshit setup, no config for each consumer group, no "we forgot to monitor the payments service" disasters. Point Burrow at your cluster and it sees everything automatically.
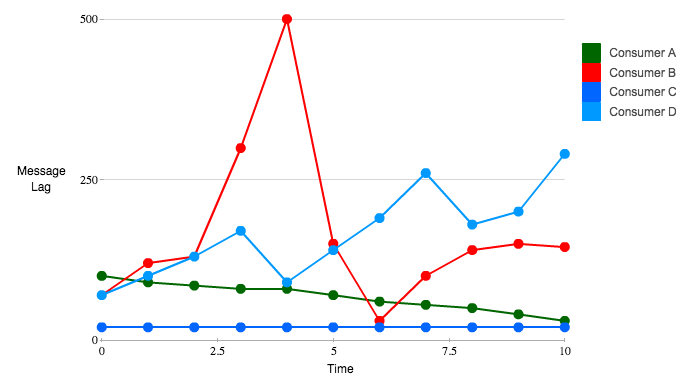
The sliding window thing is what actually makes it not suck. Instead of "lag > threshold = bad," it looks at the pattern over time. High lag but dropping? Consumer's probably catching up from a restart or batch job. High lag and climbing? Falling behind. High lag and flatlined while new messages pile up? Consumer's fucking dead, go fix it.
The Consumer Monitoring Shitshow I Lived Through
Threshold Tuning Hell
I've spent three different weeks at three different jobs tuning consumer lag thresholds. Every time, same story. Start with 1,000 messages like every tutorial recommends - alerts fire on every deploy when consumers restart and rebalance. Raise to 10,000 based on capacity planning docs - Black Friday traffic spike wakes the whole team up. Raise to 100,000 out of desperation - miss actually dead consumers for days.
There's no sweet spot. Traffic patterns aren't consistent, batch processing creates natural spikes, and consumers have different processing speeds depending on message complexity. One threshold can't cover all scenarios.
JMX Disappearing Act
JMX consumer metrics vanish the moment your consumer process dies. Which is exactly when you need them most. Why the fuck does the monitoring disappear right when something breaks? I've spent more time debugging "why aren't we getting lag metrics" than fixing actual broken consumers. The monitoring system can't tell you about problems it can't see.
The "Forgot to Monitor" Problem
New service deploys, team "forgets" to add JMX endpoint configuration. Happened to us last year - some user activity processor died for like three weeks and nobody noticed until the monthly report was empty. "Why didn't we know this stopped?" Because nobody remembered to set up monitoring for the new service. Happens every fucking time in large organizations.
Numbers Without Context Are Useless
Consumer lag of like 50,000 messages. Should you panic? Maybe the consumer's processing a daily batch job and working through backlog normally. Or maybe it's been dead for the last 2 hours. The number by itself tells you jack shit.
How Burrow Fixes This Mess
The key insight: stop asking consumers how they're doing (they lie or disappear). Read Kafka's internal bookkeeping instead.
Every time a consumer commits an offset, Kafka writes it to the __consumer_offsets topic. Burrow reads this topic directly, so it sees every consumer group whether they're running, dead, or somewhere in between. No JMX setup, no per-app configuration, no gaps.
The Sliding Window Thing
Here's what makes it not suck. Instead of "lag > 50,000 = alert," Burrow looks at the last 10 offset commits over about 10 minutes. If lag is high but the commits are moving forward and getting closer to the current offset, the consumer is catching up. Maybe it restarted, maybe it's working through a batch job. Either way, it's not dead.
But if the lag is high and the commits stopped advancing while new messages keep arriving? Consumer's dead. The sliding window catches this pattern reliably.
Three States I Actually Understand
- OK: Consumer is keeping up or catching up normally
- WARNING: Falling behind but still making progress
- ERROR: Consumer is stalled, dead, or completely broken
I query the HTTP API from my existing Prometheus setup. Same alerting infrastructure, just better consumer status evaluation. Works with any Kafka since 0.8.2 when __consumer_offsets became a thing.
This is the monitoring setup that finally let me sleep through the night without lag alerts going off every time traffic spiked or a batch job started.