The N+1 Problem

Why Your Query Hits the Database 500 Times Instead of Once

N+1 Problem Visualization

The N+1 problem is why GraphQL APIs get slow. It's sneaky and will kill your database. Every GraphQL API that sees real traffic needs DataLoader - no exceptions.

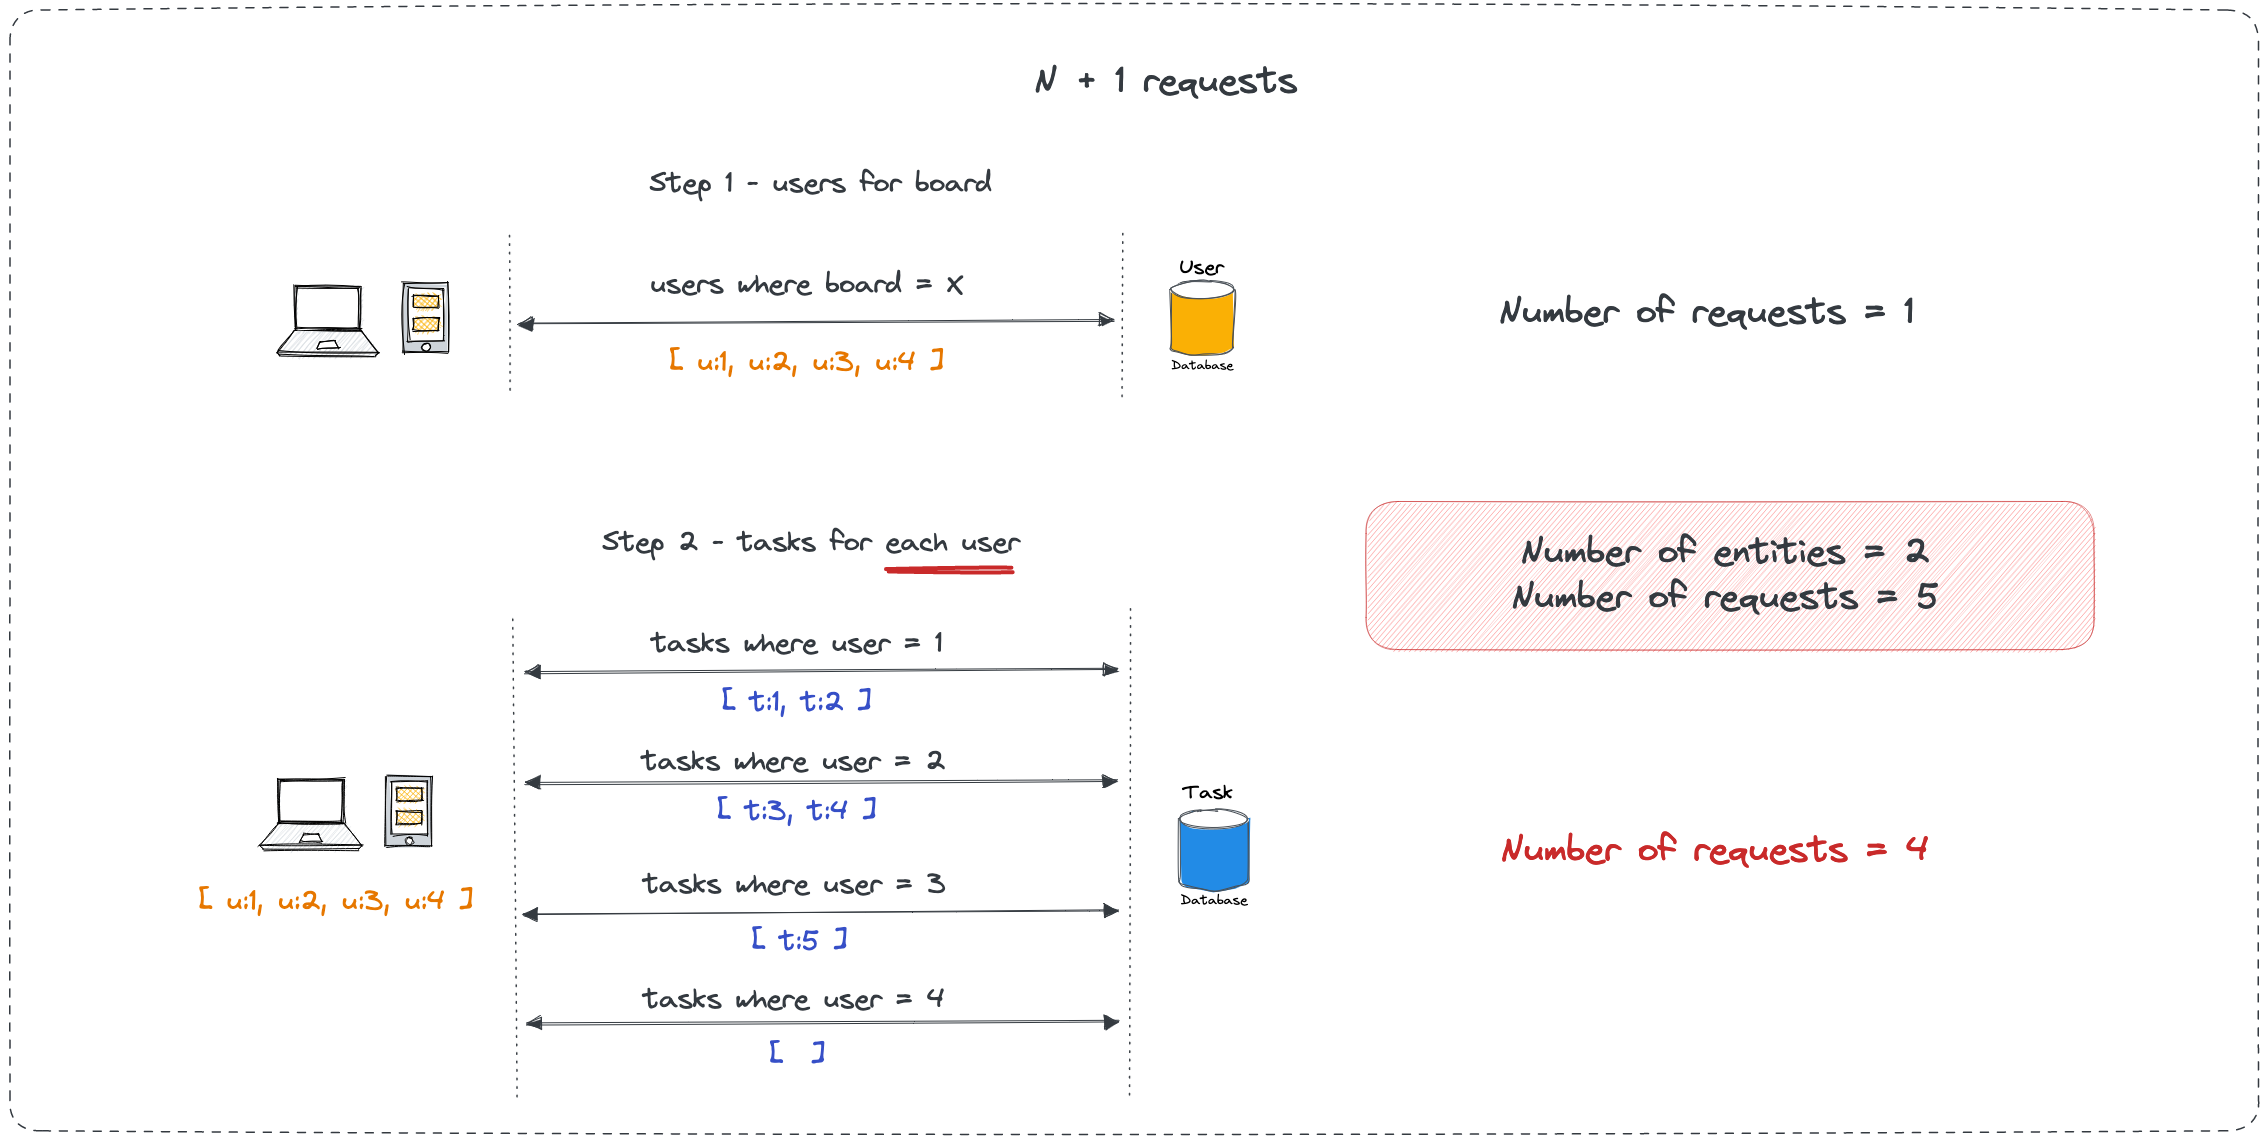
Here's what happens: you write a query that looks innocent, but it triggers individual database calls for every piece of related data.

query GetPostsWithAuthors {
  posts(first: 10) {
    title
    author {
      name
    }
  }
}

Looks innocent, right? Wrong. This query actually generates 11 database queries:

  1. SELECT * FROM posts LIMIT 10 - gets the posts
  2. SELECT * FROM users WHERE id = 1 - author for post 1
  3. SELECT * FROM users WHERE id = 2 - author for post 2
  4. ...and so on for all 10 posts

Saw this bring down our production database during a marketing campaign. Traffic spiked and suddenly the database was getting hit with thousands of individual queries instead of a few optimized ones. Database CPU at 100%, everything crashed.

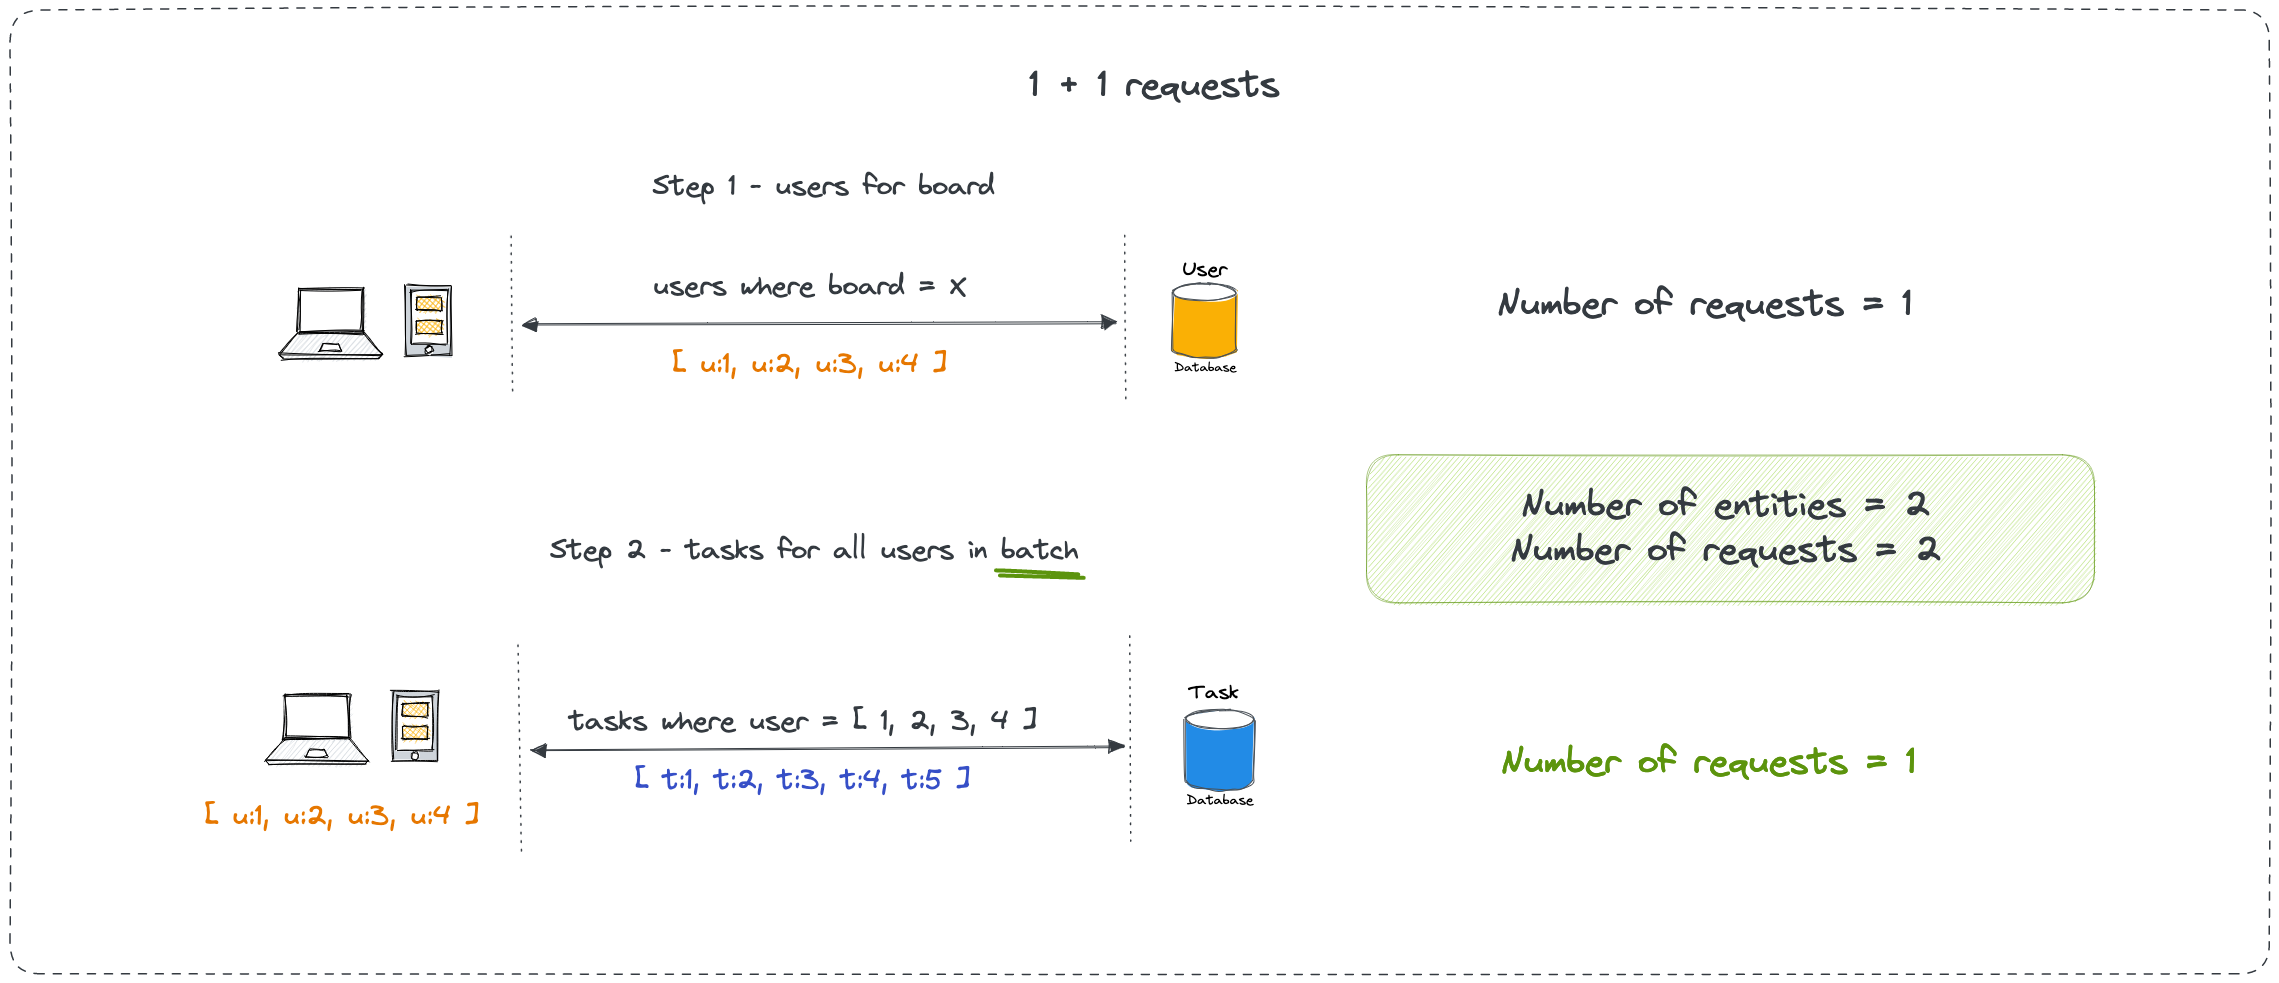
DataLoader Fixes This By Batching Queries

DataLoader batches individual loads that happen during a single tick of the event loop. Instead of 10 separate user queries, it waits a few milliseconds and batches them into one query. Facebook built this to solve their own N+1 problems at scale.

import DataLoader from 'dataloader';

// This function gets called with an array of IDs
const batchLoadUsers = async (userIds) => {
  const users = await db.query('SELECT * FROM users WHERE id IN (?)', [userIds]);
  
  // CRITICAL: Return users in the same order as the input IDs
  return userIds.map(id => users.find(user => user.id === id) || null);
};

// Create the loader
const userLoader = new DataLoader(batchLoadUsers);

// Use it in resolvers
const resolvers = {
  Post: {
    author: (post) => userLoader.load(post.author_id),
  },
};

Now that query that was hitting the database 11 times only hits it 2 times: once for posts, once for all the authors.

The key thing is creating the DataLoader in your GraphQL context so it's scoped to the request:

const server = new ApolloServer({
  context: () => ({
    userLoader: new DataLoader(batchLoadUsers),
  }),
});

Don't create global DataLoaders. Made that mistake once - users started seeing other people's data because the cache wasn't clearing between requests.

Query Complexity Analysis Prevents Abuse

Without limits, clients can write queries that eat massive resources. Seen queries that try to fetch every user with all their posts and all comments - millions of records. GitHub hit this problem and now has strict query complexity limits.

import { costAnalysis } from 'graphql-query-complexity';

const server = new ApolloServer({
  typeDefs,
  resolvers,
  validationRules: [
    costAnalysis({
      maximumCost: 1000,
      scalarCost: 1,
      objectCost: 2,
      listFactor: 10, // Lists are expensive
    }),
  ],
});

This blocks queries before they run if they're too expensive. A simple query might cost 10 points, but a nested query with lists can easily cost thousands.

Memory Leaks From Subscriptions

GraphQL subscriptions are great until they start leaking memory. The problem is event listeners that never get cleaned up when clients disconnect.

// This will leak memory
const resolvers = {
  Subscription: {
    messageAdded: {
      subscribe: () => pubsub.asyncIterator(['MESSAGE_ADDED']),
    },
  },
};

You need to handle cleanup manually:

const resolvers = {
  Subscription: {
    messageAdded: {
      subscribe: () => {
        const iterator = pubsub.asyncIterator(['MESSAGE_ADDED']);
        
        // Clean up when the client disconnects
        iterator.return = () => {
          // Remove any event listeners here
          return { done: true, value: undefined };
        };
        
        return iterator;
      },
    },
  },
};

Debugged a Node process that was eating 8GB of RAM because subscription listeners never got cleaned up. Took 6 hours to figure out.

Monitor What Actually Matters

Regular HTTP monitoring doesn't work with GraphQL because everything goes through /graphql and returns 200 OK even when things break. GraphQL execution is like a tree of resolvers running concurrently, each potentially hitting your database at the same time.

const server = new ApolloServer({
  plugins: [{
    requestDidStart() {
      const start = Date.now();
      
      return {
        willSendResponse(requestContext) {
          const duration = Date.now() - start;
          
          if (duration > 2000) {
            console.warn('Slow GraphQL query:', {
              duration,
              operation: requestContext.request.operationName,
              query: requestContext.request.query?.substring(0, 200),
            });
          }
        },
        
        didEncounterErrors(requestContext) {
          console.error('GraphQL errors:', {
            operation: requestContext.request.operationName,
            errors: requestContext.errors.map(e => e.message),
            path: requestContext.errors[0]?.path,
          });
        },
      };
    },
  }],
});

Track query execution times, not just HTTP response times. GraphQL can return partial results with errors, so a 200 response doesn't mean everything worked.

The most useful metrics I've found are:

  • P99 query execution time (catch the worst queries)
  • Error rate by operation name (identify problematic queries)
  • Database connection pool utilization (prevent exhaustion)
  • Memory usage over time (catch leaks early)

For production monitoring, Apollo Studio works if you can afford it, or Sentry for error tracking. The key is tracking resolver-level performance, not just HTTP response times.

Connection Pools and Caching

Database Connection Problems with GraphQL

GraphQL Architecture Overview

DataLoader fixes N+1 queries, but the next problem is connection pool exhaustion. GraphQL resolvers run concurrently - a single query can grab multiple database connections at once. Seen connection pools get exhausted when one GraphQL query spawned 20 concurrent resolvers all trying to grab connections.

The default connection pool size for most databases is around 20 connections. With GraphQL, you can hit that limit with just a few complex queries running at the same time.

// Your connection pool needs to be bigger for GraphQL
const pool = new Pool({
  max: 50, // Way higher than REST APIs need
  min: 10, // Keep some connections warm
  acquireTimeoutMillis: 30000, // GraphQL queries can be slow
  idleTimeoutMillis: 300000,
});

// Always release connections in DataLoader
const userLoader = new DataLoader(async (ids) => {
  const client = await pool.connect();
  try {
    const result = await client.query('SELECT * FROM users WHERE id = ANY($1)', [ids]);
    return ids.map(id => result.rows.find(user => user.id === id));
  } finally {
    client.release(); // Don't forget this or you'll leak connections
  }
});

Debugged a production outage where we kept getting "connection pool exhausted" errors. One resolver wasn't releasing connections - every query ate a connection permanently until we ran out.

Caching GraphQL Responses Is Harder Than REST

REST APIs are easy to cache because each URL maps to specific data. GraphQL uses POST requests with variable query bodies, so traditional HTTP caching doesn't work.

You have a few options:

Persisted Queries let you use GET requests by replacing the query with a hash:

const server = new ApolloServer({
  persistedQueries: {
    cache: new Map(), // Use Redis in production
  },
});

Now instead of POST /graphql with a big query body, you get GET /graphql?query=abc123 which CDNs can cache.

Field-Level Caching lets you cache parts of the response:

type User {
  name: String! @cacheControl(maxAge: 3600)  # Names don't change often
  posts: [Post!]! @cacheControl(maxAge: 60)  # Posts change frequently
}

The problem with field-level caching is it gets complicated fast. What happens when a user updates their name? You need cache invalidation logic.

Apollo Server vs GraphQL Yoga Performance

I've run benchmarks comparing different GraphQL servers. GraphQL Yoga consistently performs better than Apollo Server, especially for simple queries. The GraphQL server benchmarks project has more detailed comparisons.

In my testing, Yoga beats Apollo by around 20%. Results depend on your query patterns, but Yoga's lighter. On my M2 MacBook with 8GB RAM, I get about 2,400 req/sec with Yoga vs Apollo's 2,000. Basic queries only though - complex nested stuff drops both to 500 req/sec.

// GraphQL Yoga is lighter weight
import { createYoga } from 'graphql-yoga';

const yoga = createYoga({
  schema,
  batching: true, // Enable query batching
  multipart: false, // Disable file uploads if you don't need them
});

The performance difference is more pronounced with complex nested queries. Apollo Server has more features, but if you just need a fast GraphQL server, Yoga wins.

Database Indexes for GraphQL

GraphQL queries access data through relationships, so your indexing strategy needs to be different from REST APIs.

-- Index foreign keys used in GraphQL relationships
CREATE INDEX idx_posts_user_id ON posts(user_id);
CREATE INDEX idx_comments_post_id ON comments(post_id);

-- Composite indexes for common GraphQL query patterns
CREATE INDEX idx_posts_user_created ON posts(user_id, created_at DESC);

-- Covering indexes to avoid additional lookups
CREATE INDEX idx_users_covering ON users(id) 
  INCLUDE (name, email, created_at);

Learned this when user profile queries were slow. Had an index on user_id, but GraphQL was also sorting by created_at - needed a composite index on (user_id, created_at).

Node.js Cluster Mode for GraphQL

Node.js is single-threaded, which limits GraphQL performance. Use cluster mode to utilize all your CPU cores:

import cluster from 'cluster';
import { cpus } from 'os';

if (cluster.isPrimary) {
  for (let i = 0; i < cpus().length; i++) {
    cluster.fork();
  }
  
  cluster.on('exit', (worker) => {
    console.log(`Worker ${worker.process.pid} died, restarting...`);
    cluster.fork();
  });
} else {
  startGraphQLServer();
}

This spawns one GraphQL server per CPU core. With 8 cores, you can handle 8x more concurrent requests. PM2 can handle this automatically in production.

Cache Invalidation Is The Hard Part

Caching GraphQL responses is one thing, but invalidating the cache when data changes is where things get tricky.

// When data changes, you need to purge related cached queries
const resolvers = {
  Mutation: {
    updateUser: async (_, { id, input }) => {
      const user = await db.user.update({ where: { id }, data: input });
      
      // This user might be cached in multiple different queries
      await cache.invalidatePattern(`*user:${id}*`);
      await cache.invalidatePattern(`*users*`); // Any query that fetches multiple users
      
      return user;
    },
  },
};

This gets messy fast. When a user updates their profile, that data might be cached in 20 different query combinations. Invalidating everything is expensive, but missing something means stale data. Spent weekends debugging cache invalidation bugs that only showed up with specific query patterns.

Memory Usage Monitoring

GraphQL servers can consume a lot of memory, especially with DataLoader caches and large query results. Monitor memory usage and set limits - use flame graphs to visualize where your GraphQL resolvers consume the most memory:

// Monitor memory usage and log when it gets high
setInterval(() => {
  const memUsage = process.memoryUsage();
  const heapUsedMB = Math.round(memUsage.heapUsed / 1024 / 1024);
  
  if (heapUsedMB > 500) {
    console.warn(`High memory usage: ${heapUsedMB}MB`);
  }
  
  if (heapUsedMB > 1000) {
    console.error(`Critical memory usage: ${heapUsedMB}MB - consider restarting`);
  }
}, 30000);

// Start Node.js with more heap space
// node --max-old-space-size=4096 server.js

Had GraphQL servers crash with OOM errors because query results were bigger than expected. Marketing page query pulled 50,000 records because someone forgot pagination. Set up alerts for memory usage > 1GB.

When you're debugging at 3am, you need quick answers to specific problems. Next section has immediate fixes for common GraphQL performance issues.

Common GraphQL Performance Problems & Solutions

Q

My GraphQL queries are 10x slower than equivalent REST calls. Why?

A

DataLoader Batching VisualizationYou're hitting the N+1 problem. Your innocent-looking query triggers hundreds of database calls instead of a few optimized joins.

Immediate fix: Implement DataLoader for automatic batching:

const userLoader = new DataLoader(async (userIds) => {
  const users = await db.users.findByIds(userIds);
  return userIds.map(id => users.find(user => user.id === id));
});

// In your resolver
author: (post) => userLoader.load(post.authorId)

This turns 100+ individual database queries into 1 batched query.

Q

GraphQL queries work fine in development but timeout in production. What's different?

A

Your dev environment has 100 test records. Production has 100,000 real users with years of data. GraphQL doesn't auto-paginate like REST endpoints, so that innocent user.posts query suddenly pulls 10,000 records per user.

type User {
  posts(first: Int = 10, max: 100): [Post!]!  # Default 10, max 100
}

Enforce this in code too:

const resolvers = {
  User: {
    posts: (user, { first = 10 }) => {
      const limit = Math.min(first, 100); // Don't let them be greedy
      return getPostsByUser(user.id, limit);
    }
  }
};
Q

My server crashes with "JavaScript heap out of memory" on GraphQL queries. How do I fix this?

A

You're loading massive datasets into memory. A single nested query can pull gigabytes of data.

Emergency fix: Increase Node.js memory limit:

node --max-old-space-size=8192 server.js  # 8GB heap

Permanent solution: Implement query depth limiting:

import depthLimit from 'graphql-depth-limit';

const server = new ApolloServer({
  validationRules: [depthLimit(10)], // Block queries deeper than 10 levels
});
Q

How do I find which GraphQL resolver is killing my server performance?

A

Copy this code and run it for a day. You'll know exactly which resolvers are the problem:

const server = new ApolloServer({
  plugins: [{
    requestDidStart() {
      return {
        willSendResponse(requestContext) {
          console.log('Execution time:', requestContext.metrics?.executionTime);
          
          // Log slow resolvers
          if (requestContext.metrics?.executionTime > 5000) {
            console.error('Slow query:', {
              query: requestContext.request.query?.replace(/\s+/g, ' '),
              variables: requestContext.request.variables
            });
          }
        }
      };
    }
  }]
});

Look for resolvers taking >1 second consistently. Those are your optimization targets.

Q

My GraphQL subscriptions cause memory leaks. How do I prevent this?

A

Subscriptions don't automatically clean up event listeners when clients disconnect.

Fix: Implement proper cleanup in subscription resolvers:

const resolvers = {
  Subscription: {
    messageAdded: {
      subscribe: () => {
        const iterator = pubsub.asyncIterator(['MESSAGE_ADDED']);
        
        // Critical cleanup code
        iterator.return = () => {
          pubsub.removeAllListeners('MESSAGE_ADDED');
          return { done: true, value: undefined };
        };
        
        return iterator;
      }
    }
  }
};
Q

Can I cache GraphQL responses like REST API responses?

A

Not directly - GraphQL uses POST requests which aren't cacheable. But you have options:

1. Persisted Queries (enables GET requests):

const server = new ApolloServer({
  persistedQueries: {
    cache: new Map() // Use Redis in production
  }
});

2. Field-level caching:

type User {
  name: String! @cacheControl(maxAge: 3600)  # Cache 1 hour
  email: String! @cacheControl(maxAge: 300)  # Cache 5 minutes
}

3. GraphQL CDN like Stellate for automatic caching.

Q

My database connections are exhausted when GraphQL traffic spikes. Why?

A

GraphQL resolvers execute concurrently and can overwhelm connection pools. Each nested field might grab a separate connection.

Fix: Use connection pooling with DataLoader:

const pool = new Pool({
  max: 50,     // Increase pool size for GraphQL
  min: 10,     // Keep connections warm
  acquireTimeoutMillis: 30000 // Higher timeout
});

const userLoader = new DataLoader(async (ids) => {
  const client = await pool.connect();
  try {
    return await batchLoadUsers(client, ids);
  } finally {
    client.release(); // Always release!
  }
});
Q

How do I prevent malicious queries from crashing my GraphQL server?

A

Assign point values to different field types (scalars=1, objects=2, lists=10x) to calculate total query cost.

Implement query complexity analysis to block expensive queries:

import { costAnalysis } from 'graphql-query-complexity';

const server = new ApolloServer({
  validationRules: [
    costAnalysis({
      maximumCost: 1000,     // Block queries > 1000 points
      scalarCost: 1,         // Simple fields = 1 point  
      objectCost: 2,         // Objects = 2 points
      listFactor: 10,        // Lists multiply cost by 10
    })
  ]
});

Add query timeouts:

const server = new ApolloServer({
  plugins: [{
    requestDidStart() {
      return {
        willSendResponse(requestContext) {
          setTimeout(() => {
            if (!requestContext.response.http.body) {
              throw new Error('Query timeout - exceeded 30 seconds');
            }
          }, 30000);
        }
      };
    }
  }]
});
Q

My GraphQL API gets slower throughout the day but memory usage stays constant. What's wrong?

A

This drove me crazy for weeks. Caches get polluted with stale data. DataLoaders accumulate more keys throughout the day, making lookups slower even though memory stays flat.

Fix: Scope caches to individual requests, not globally:

// WRONG - Global cache grows forever
const globalCache = new DataLoader(batchFunction);

// RIGHT - Per-request cache  
const server = new ApolloServer({
  context: () => ({
    loaders: {
      user: new DataLoader(batchUsers),  // New instance per request
      post: new DataLoader(batchPosts)   
    }
  })
});
Q

How do I monitor GraphQL performance without expensive APM tools?

A

Build custom monitoring with request timing and error tracking:

const server = new ApolloServer({
  plugins: [{
    requestDidStart() {
      const startTime = Date.now();
      
      return {
        didEncounterErrors(requestContext) {
          console.error('GraphQL errors:', {
            query: requestContext.request.query,
            errors: requestContext.errors.map(e => e.message),
            executionTime: Date.now() - startTime
          });
        },
        
        willSendResponse(requestContext) {
          const duration = Date.now() - startTime;
          
          // Log slow queries
          if (duration > 5000) {
            console.warn('Slow GraphQL query:', {
              duration,
              operationName: requestContext.request.operationName,
              query: requestContext.request.query?.substring(0, 200)
            });
          }
          
          // Send to your metrics system
          metrics.timing('graphql.request.duration', duration);
        }
      };
    }
  }]
});
Q

Should I switch from Apollo Server to GraphQL Yoga for better performance?

A

Based on benchmarks, GraphQL Yoga performs 20-40% better than Apollo Server for most workloads:

Server Requests/sec Memory Usage
Apollo 1,978 Higher
Yoga 2,469 (+25%) Lower

Migration is straightforward:

// Apollo Server
const server = new ApolloServer({ schema });

// GraphQL Yoga
import { createYoga } from 'graphql-yoga';
const yoga = createYoga({ 
  schema,
  batching: true,  // Enable performance optimizations
});

The performance gain depends on your specific queries and server load patterns.

Need actual numbers to justify your architecture choices? The next section has real production benchmarks from multiple GraphQL servers under load.

Q

My GraphQL federation gateway is the bottleneck. How do I optimize it?

A

Federation adds network overhead between services. Optimize the gateway layer:

1. Enable query planning cache:

const gateway = new ApolloGateway({
  serviceList: [...services],
  experimental_approximateQueryPlanStoreSizeInBytes: 50 * 1024 * 1024, // 50MB cache
});

2. Use DataLoader in federated services:

// In each service
const server = new ApolloServer({
  schema: buildFederatedSchema([{ typeDefs, resolvers }]),
  context: () => ({
    loaders: createDataLoaders() // Fresh loaders per request
  })
});

3. Monitor inter-service latency - federation performance depends heavily on network between services.

Q

How do I handle file uploads without killing GraphQL performance?

A

File uploads through GraphQL resolvers block the event loop. Use separate upload endpoints:

// WRONG - Blocks GraphQL resolver
const resolvers = {
  Mutation: {
    uploadFile: async (_, { file }) => {
      const { createReadStream } = await file;
      return processLargeFile(createReadStream()); // Blocks server
    }
  }
};

// RIGHT - Separate upload endpoint
app.post('/upload', upload.single('file'), (req, res) => {
  // Handle file upload outside GraphQL
  const fileId = processFileAsync(req.file);
  res.json({ fileId });
});

// GraphQL just references the uploaded file
const resolvers = {
  Mutation: {
    createPost: (_, { input }) => {
      return createPost({ ...input, fileId: input.fileId });
    }
  }
};

GraphQL Server Performance Comparison

Server

Req/sec

Memory (MB)

N+1 Handling

Caching

Learning Curve

Pain Points

Apollo Server

~1,800

250-400

DataLoader required

Built-in cache

Easy

Heavy, lots of magic

GraphQL Yoga

~2,400

180-300

DataLoader required

Manual setup

Medium

Less tooling

Mercurius (Fastify)

~3,200

150-250

Built-in batching

Redis integration

Hard

Fastify ecosystem only

GraphQL Helix

~2,200

160-280

Manual implementation

No built-in

Medium

More boilerplate

Tools That Actually Help With GraphQL Performance

Related Tools & Recommendations

tool
Similar content

GraphQL Production Troubleshooting: Fix Errors & Optimize Performance

Fix memory leaks, query complexity attacks, and N+1 disasters that kill production servers

GraphQL
/tool/graphql/production-troubleshooting
100%
tool
Similar content

GraphQL Overview: Why It Exists, Features & Tools Explained

Get exactly the data you need without 15 API calls and 90% useless JSON

GraphQL
/tool/graphql/overview
86%
integration
Recommended

Claude API Code Execution Integration - Advanced Tools Guide

Build production-ready applications with Claude's code execution and file processing tools

Claude API
/integration/claude-api-nodejs-express/advanced-tools-integration
78%
integration
Recommended

Stop Your APIs From Breaking Every Time You Touch The Database

Prisma + tRPC + TypeScript: No More "It Works In Dev" Surprises

Prisma
/integration/prisma-trpc-typescript/full-stack-architecture
64%
howto
Recommended

Migrating from REST to GraphQL: A Survival Guide from Someone Who's Done It 3 Times (And Lived to Tell About It)

I've done this migration three times now and screwed it up twice. This guide comes from 18 months of production GraphQL migrations - including the failures nobo

rest-api
/howto/migrate-rest-api-to-graphql/complete-migration-guide
53%
integration
Recommended

Redis + Node.js Integration Guide

built on Redis

Redis
/integration/redis-nodejs/nodejs-integration-guide
53%
tool
Similar content

DataLoader: Optimize GraphQL Performance & Fix N+1 Queries

Master DataLoader to eliminate GraphQL N+1 query problems and boost API performance. Learn correct implementation strategies and avoid common pitfalls for effic

GraphQL DataLoader
/tool/dataloader/overview
51%
tool
Recommended

Express.js - The Web Framework Nobody Wants to Replace

It's ugly, old, and everyone still uses it

Express.js
/tool/express/overview
48%
tool
Recommended

Express.js Middleware Patterns - Stop Breaking Things in Production

Middleware is where your app goes to die. Here's how to not fuck it up.

Express.js
/tool/express/middleware-patterns-guide
48%
tool
Similar content

Apollo GraphQL Overview: Server, Client, & Getting Started Guide

Explore Apollo GraphQL's core components: Server, Client, and its ecosystem. This overview covers getting started, navigating the learning curve, and comparing

Apollo GraphQL
/tool/apollo-graphql/overview
45%
tool
Recommended

Prisma - TypeScript ORM That Actually Works

Database ORM that generates types from your schema so you can't accidentally query fields that don't exist

Prisma
/tool/prisma/overview
44%
tool
Recommended

Prisma Cloud - Cloud Security That Actually Catches Real Threats

Prisma Cloud - Palo Alto Networks' comprehensive cloud security platform

Prisma Cloud
/tool/prisma-cloud/overview
44%
tool
Recommended

gRPC - Google's Binary RPC That Actually Works

competes with gRPC

gRPC
/tool/grpc/overview
42%
tool
Recommended

Fix gRPC Production Errors - The 3AM Debugging Guide

competes with gRPC

gRPC
/tool/grpc/production-troubleshooting
42%
integration
Recommended

gRPC Service Mesh Integration

What happens when your gRPC services meet service mesh reality

gRPC
/integration/microservices-grpc/service-mesh-integration
42%
compare
Recommended

Pick the API Testing Tool That Won't Make You Want to Throw Your Laptop

Postman, Insomnia, Thunder Client, or Hoppscotch - Here's What Actually Works

Postman
/compare/postman/insomnia/thunder-client/hoppscotch/api-testing-tools-comparison
42%
review
Recommended

Vite vs Webpack vs Turbopack: Which One Doesn't Suck?

I tested all three on 6 different projects so you don't have to suffer through webpack config hell

Vite
/review/vite-webpack-turbopack/performance-benchmark-review
42%
tool
Similar content

PostgreSQL: Why It Excels & Production Troubleshooting Guide

Explore PostgreSQL's advantages over other databases, dive into real-world production horror stories, solutions for common issues, and expert debugging tips.

PostgreSQL
/tool/postgresql/overview
40%
integration
Similar content

Stripe Next.js Serverless Performance: Optimize & Fix Cold Starts

Cold starts are killing your payments, webhooks are timing out randomly, and your users think your checkout is broken. Here's how to fix the mess.

Stripe
/integration/stripe-nextjs-app-router/serverless-performance-optimization
37%
compare
Recommended

Python vs JavaScript vs Go vs Rust - Production Reality Check

What Actually Happens When You Ship Code With These Languages

javascript
/compare/python-javascript-go-rust/production-reality-check
35%

Recommendations combine user behavior, content similarity, research intelligence, and SEO optimization