The N+1 problem will murder your API performance, and it's sneaky as hell. You won't notice it in dev with 5 test users, but the moment you hit production with real data, your response times go from 50ms to 8 seconds and your database starts sweating.
![]()
Visual diagram showing N+1 queries: 1 query fetches users, then N separate queries fetch posts for each user
Visual: Database query logs showing the same SELECT statement repeated hundreds of times - that's N+1 in action.
What Actually Happens (The Horror Story)
Here's the nightmare: You write a GraphQL query to fetch users and their posts. Looks innocent enough:
query {
  users {
    id
    name
    posts {
      title
      content
    }
  }
}
Your naive resolver executes:
- 1 query to get 100 users
- 100 separate queries to get posts for each user
- Total: 101 database hits for what should be 2 queries max
I learned this the hard way when our e-commerce API went from handling 1,000 concurrent users to choking on 50. Amazon's research showing 100ms of latency costs 1% in sales suddenly felt very personal when our CEO was asking why checkout was broken. Google's Core Web Vitals now penalize slow-loading sites, and Shopify's performance studies show that every 100ms of delay reduces conversion by 7%.
Framework-Specific Pain Points
Apollo Server: Every resolver runs independently, so it'll happily hammer your database. I've seen Apollo make 2,000+ queries for a single page load because someone forgot to batch user lookups. The Apollo docs mention DataLoader, but they don't warn you that sharing DataLoader instances between requests will serve user A's data to user B. Ask me how I know. The Apollo Server performance guide has more details, and Apollo Studio's trace analyzer can help identify N+1 patterns.
Prisma: Their marketing claims "automatic batching" but it's bullshit for anything beyond 2 levels deep. This Stack Overflow thread is full of developers discovering their "optimized" Prisma queries still make hundreds of calls. Prisma 5.0 improved things, but complex joins still break batching. The Prisma performance docs admit this, and their GitHub issues are full of N+1 complaints.
Spring Boot GraphQL: Requires manual DataLoader wiring because Java developers apparently enjoy pain. This tutorial shows the setup, but doesn't mention that CompletableFuture chains will eat your memory if you don't handle exceptions properly. The Spring GraphQL reference covers this, and Baeldung's tutorial shows working examples.
Relay: Facebook's own implementation has documented N+1 issues when using connections with node queries. Even the creators of GraphQL struggle with this shit. Check the Relay GitHub issues and Facebook's engineering blog for more context.
Why GraphQL Makes This Worse Than REST
![]()
GraphQL allows clients to request nested data, potentially triggering N+1 queries at each level
REST APIs force you to think about data relationships upfront. With GraphQL, the frontend developer can request whatever nested data they want, pushing all the performance problems to your resolvers. The GraphQL Foundation's best practices acknowledge this problem.
I've debugged GraphQL APIs where a innocent-looking frontend query like "give me users and their posts and comments" triggered 15,000+ database queries. The client developer had no idea they'd just DDOSed our database. This is why GraphQL query complexity analysis exists - to prevent these disasters.
GraphQL's execution model processes fields independently, so even if you optimize the user resolver, the posts resolver will still make N+1 queries unless you explicitly batch it. It's not automatic, despite what the marketing materials claim. The GraphQL execution specification explains why, and this GraphQL blog post breaks it down.
Production War Stories
Our user dashboard was loading in 12+ seconds because the frontend requested user profiles with their activity feed. Each user had ~20 activities, so for 50 users we were making 1,000+ queries. Adding DataLoader dropped it to 3 queries and 200ms response time.
Another team at my company had a product catalog API that worked fine in staging (100 products) but died in production (50,000+ products). Their category resolver was making individual queries for each product's category instead of batching. NewRelic monitoring revealed they were hitting 100% database CPU because of N+1 queries. Datadog's APM and Honeycomb's query analysis would have caught this too.
The worst case I've seen: A social media feed that made 50,000+ queries to render 20 posts because it was fetching user data, post reactions, comment counts, and media files individually for each item. The page took 45+ seconds to load. Tools like GraphQL Inspector and Apollo Studio's performance monitoring exist specifically to prevent this.
That's why I don't trust "automatic" optimizations. You need to measure, profile, and explicitly batch your queries or production will remind you why performance matters. Google's Site Reliability Engineering book and High Performance MySQL cover the fundamentals of database performance monitoring.
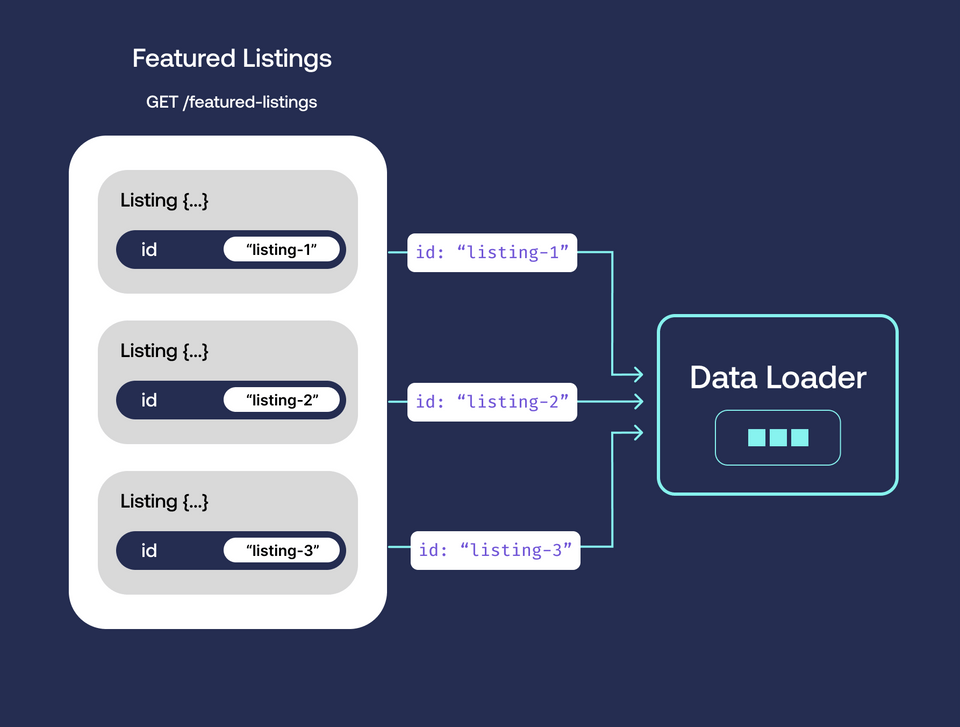
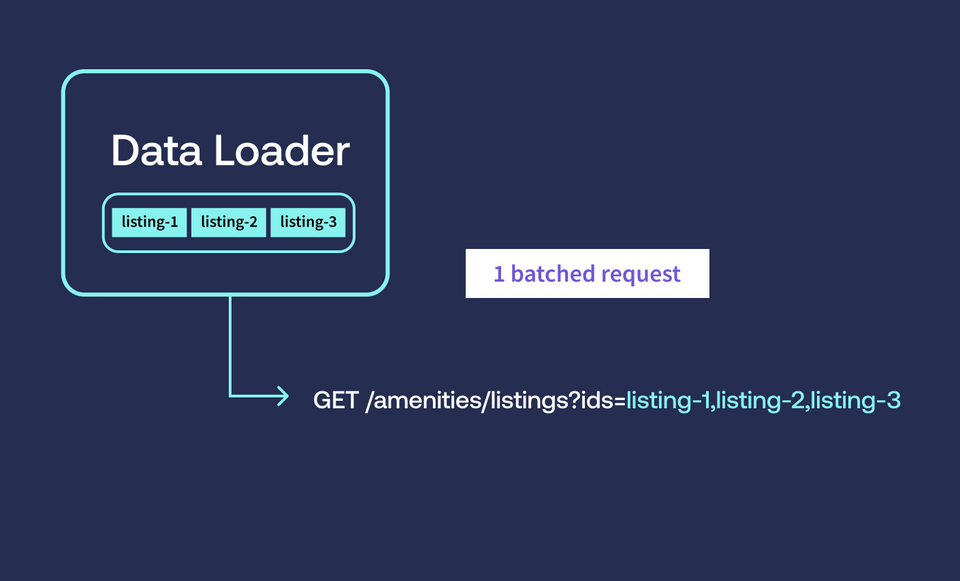
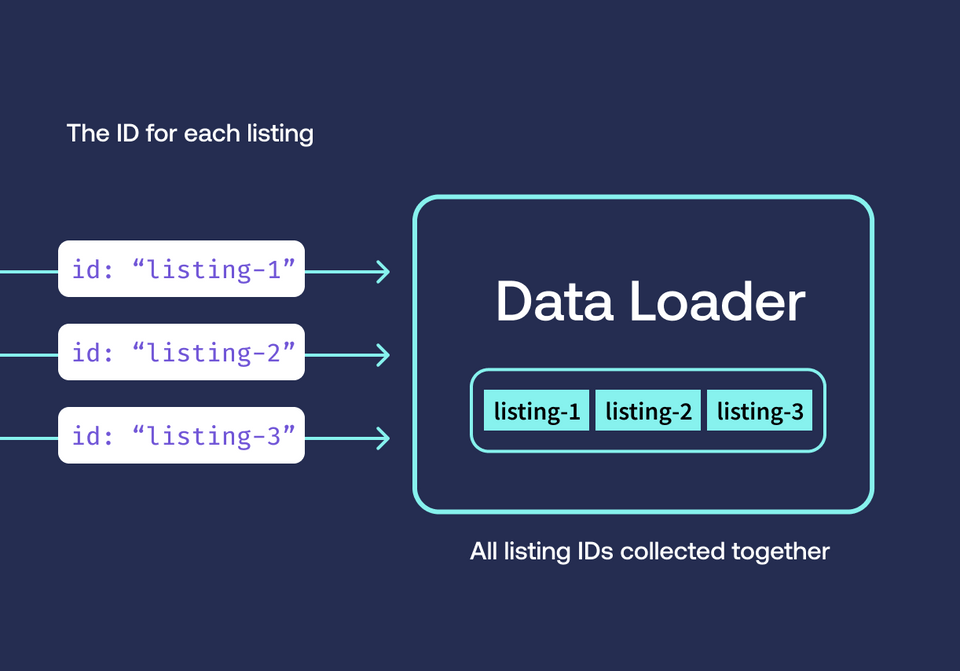
The solution isn't complex - it's DataLoader. But like most tools, DataLoader works great when implemented correctly and fails silently when you mess up the details. Let's dig into how to actually make it work.