
Sentry catches crashes and tells you why your code broke. No more debugging production issues from useless log files or angry user emails from customers saying "your site is broken."
Started in 2008 as an open-source project by some Django developers who got tired of checking log files every 5 minutes. Now it's used by over 130,000 teams including Disney+, Slack, GitHub, and Atlassian - basically anyone who's sick of playing "guess what the fuck crashed now" at 3am while their boss is texting them about downtime.
Error Monitoring That Actually Works
The core thing Sentry does is catch exceptions and crashes across 100+ languages and frameworks. When something breaks, you get the actual stack trace, the commit that caused it, and which users were affected. No more digging through GB of logs to find one useful line.

Error grouping works most of the time, but occasionally it groups completely unrelated shit together - like putting database timeouts in the same bucket as frontend JS errors. I've spent 20 minutes wondering why my Postgres connection issues keep mentioning XMLHttpRequest until I realized Sentry thinks they're the same problem. Fixable through fingerprinting rules but you shouldn't have to debug your monitoring tool.
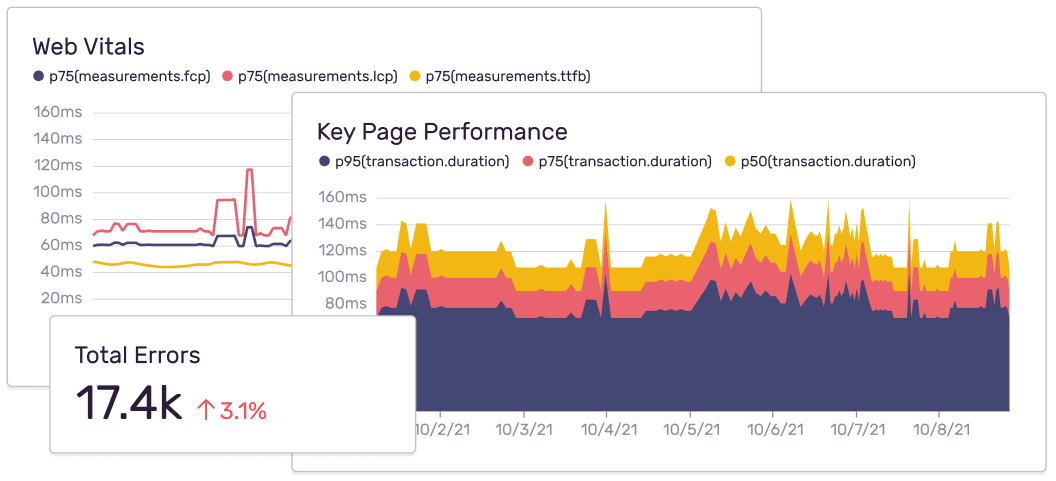
Performance Monitoring (When It Doesn't Slow You Down)
Performance monitoring finds the slow database queries that make your users wait 10 seconds for a page to load. It's basically a profiler that works in production without killing performance (usually adds ~2-5ms overhead per request).
The transaction tracing shows you exactly which API call is taking forever - usually it's that database query you wrote 6 months ago that worked fine with 10 users but shits the bed with 10,000. Nothing like seeing a 30-second SELECT query that you thought was "fast enough" when you wrote it.
Session Replay: Useful for Frontend, Useless for APIs
Session replay records what users actually did when your frontend exploded. You get a video-like playback of mouse movements, clicks, and form inputs (with PII scrubbed automatically).
This is genuinely helpful for frontend bugs where users report "it doesn't work" without any other context. But if your issue is backend logic or API failures, session replay won't help you at all.
Recent Features (Some Actually Useful)
Seer AI Debugging - Available now for $18/month extra. The AI looks at your stack traces and suggests fixes. Great for "Cannot read property 'id' of undefined" errors but completely useless when your race condition only happens on Tuesdays during peak traffic. Don't expect magic - it's still just pattern matching on common bugs.
Logs Integration - Recent logs integration finally correlates log entries with errors automatically, which is nice when it works. Pricing starts at $0.50/GB. Setup can be finicky with custom log formats.
Uptime Monitoring - Added basic uptime checks for $1/alert. It's not as sophisticated as dedicated uptime services, but good enough if you just need "is my site responding."
AI Agent Monitoring - Recently added for tracking LLM applications. Monitors token usage, model latency, and agent workflows. Early days, but useful if you're building AI stuff.
The platform handles billions of events daily and has a 99.9% uptime SLA, which is pretty solid. When Sentry goes down, you really notice it - suddenly you're debugging blind again.
But before you commit to Sentry, you need to understand how it stacks up against alternatives - and more importantly, what it actually costs at scale.