Currently viewing the human version
Switch to AI version

Why Debugging Rust Without rust-lldb Is Like Performing Brain Surgery With a Hammer

You know that feeling when you're staring at ptr, cap, and len fields instead of your actual data? That's the exact pain rust-lldb was built to eliminate. Let me tell you about the worst debugging session of my fucking life - one that could've been avoided if I'd just understood why this tool exists.

Picture this: Saturday morning, production service is down, customers are pissed, and I'm staring at a core dump trying to figure out why our Rust service is segfaulting. I fire up plain LLDB because "how hard could it be?"

Big fucking mistake.

The Rust Debugging Nightmare Without Proper Tools

Here's what a simple Option<String> looks like in plain LLDB:

(lldb) p my_option
(Option<String>) my_option = {
  discriminant = 1
  value = {
    vec = {
      buf = {
        ptr = 0x7f8b8c000abc
        cap = 10
        _phantom = {}
      }
      len = 5
    }
  }
}

Cool, so my string is... where exactly? Oh right, I need to manually dereference that pointer and count bytes while my production system burns money and my phone keeps buzzing with customer complaints. Took me like 2 hours to figure out it was just "hello" - five fucking characters.
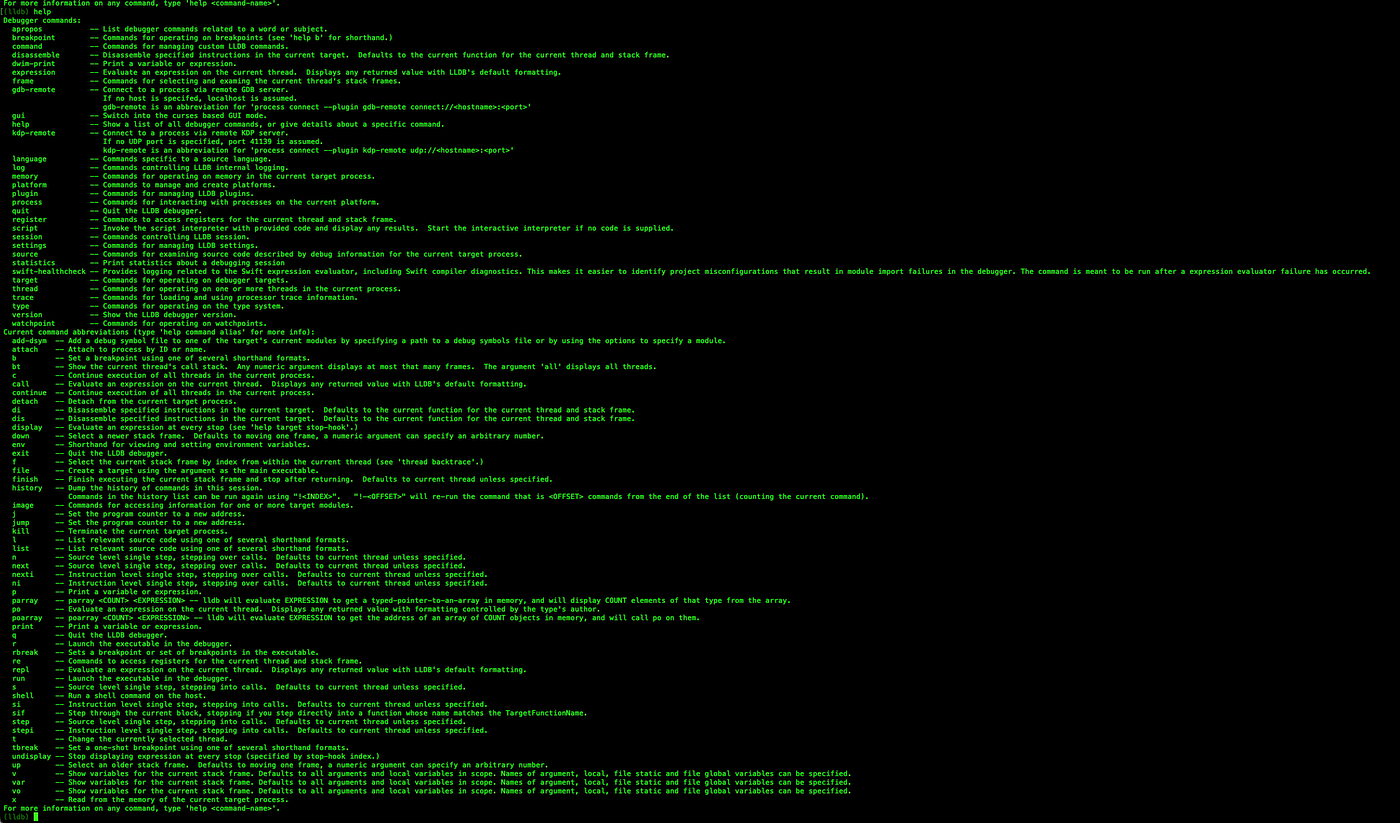
Rust Debugging with LLDB

When rust-lldb Actually Saves Your Ass

Same scenario with rust-lldb:

(lldb) p my_option
(Option<String>) my_option = Some(\"hello\")

That's it. That's the difference between debugging and suffering.

Real Talk: When This Tool Actually Matters

The HashMap From Hell: Ever tried debugging a HashMap<String, Vec<Option<Result<User, DatabaseError>>>> in plain LLDB? It's 47 levels of pointer indirection. Spent forever trying to figure out why user lookups were failing, manually following pointers through memory dumps like some kind of detective. Turns out the HashMap had the right key but the Result was Err(ConnectionTimeout) - only found that when I finally got rust-lldb working.

The async/await Disaster: Async state machines are where plain debuggers go to die. Debugging a hanging HTTP service over the weekend - rust-lldb showed me the exact Future stuck waiting on recv() with a half-parsed JSON payload. Plain LLDB? Showed me a struct called __async_gen_0_state_machine with field names like __field_37_variant_0_async_suspend - basically compiler vomit.

Production Core Dumps: Service crashes sometime after midnight, phone starts buzzing. SSH into the server, core dump is sitting there, manager's already asking for an ETA. rust-lldb shows you panic!(\"index out of bounds: len 5, index 7\") with the actual Vec that caused it. Plain LLDB shows you 0x7fff5fbfe008 and some assembly instructions that might as well be hieroglyphics.
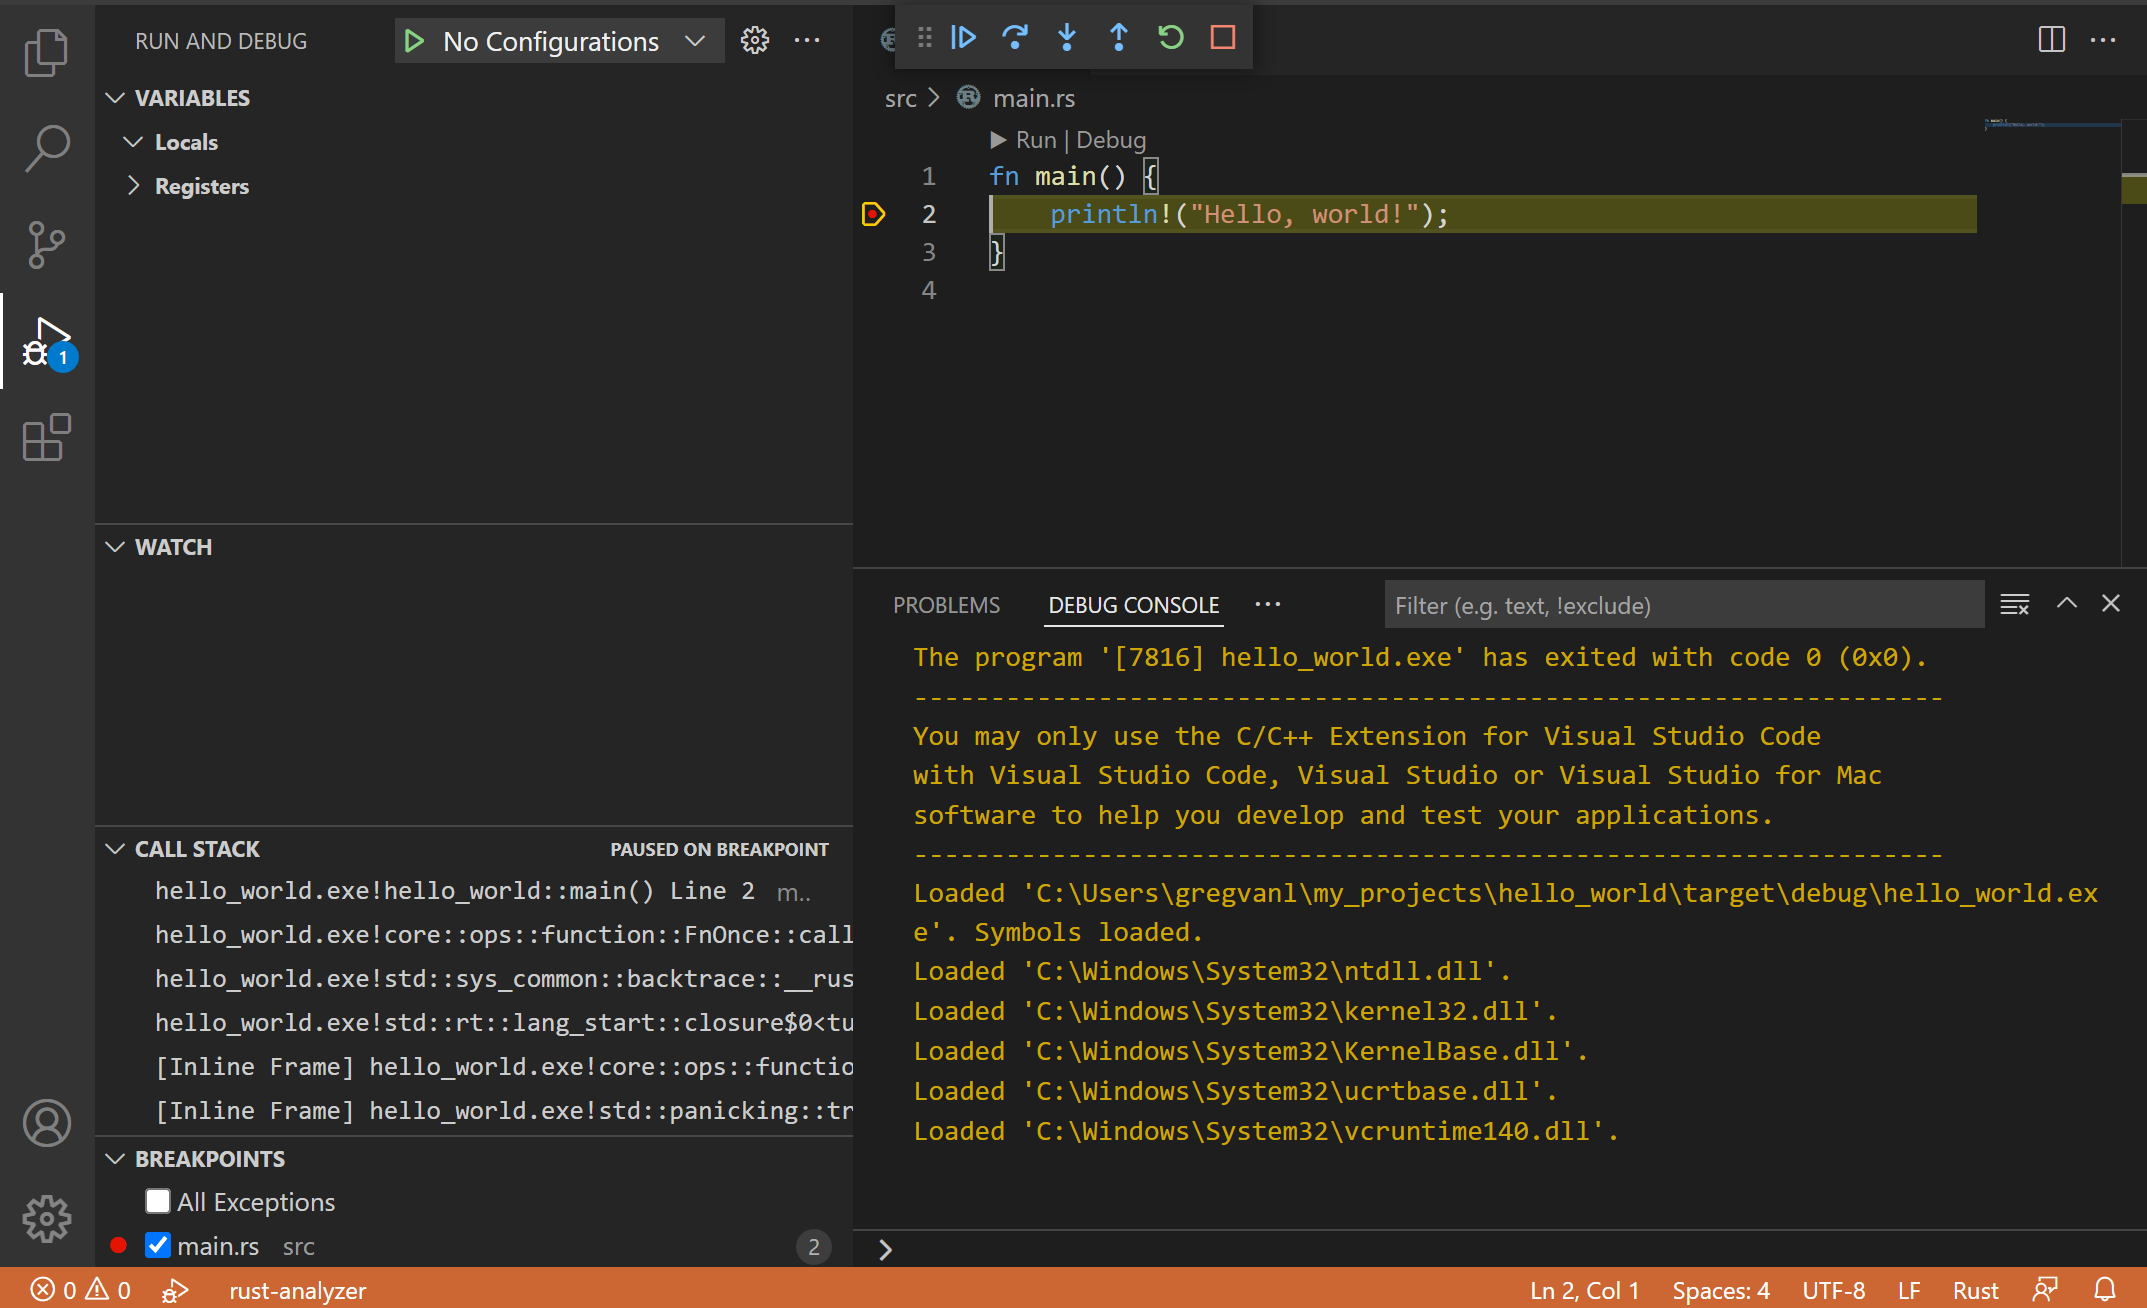
VS Code Rust Debugging Interface

The Platform-Specific Gotchas Nobody Warns You About

macOS Monterey: Broke rust-lldb for months straight. Xcode 13.1 wouldn't load Rust symbols, 13.2 crashed on launch, 13.2.1 finally worked but only if you codesigned your binaries first. Nothing like downgrading your entire development environment while production burns. Check the rust-lang GitHub issues for the current Apple-induced breakage.

Linux DWARF Version Hell: Rust 1.70 changed the DWARF format. If you're using LLDB < 15, rust-lldb just silently fails to load symbols. No error message, no warning, just broken debugging. Learned this one the hard way during a Sunday night incident.

Windows WSL2: rust-lldb through WSL2 fails in creative ways. Debugging works fine for a while, then LLDB just hangs when you inspect a Vec with 100 strings. Restart WSL, works for a bit longer, then crashes with SIGSEGV in the Python pretty printer. Just use rustup-init.exe on Windows proper and save yourself the pain.

When To Give Up and Use println! Instead

Look, rust-lldb is great, but sometimes it's not worth the hassle:

  • Release builds with full optimization: Everything shows up as "optimized out" anyway
  • Embedded targets: Just use RTT and save yourself the pain
  • When the pretty printer uses more memory than your actual program: Yes, this happens with large HashMaps
  • When you need to debug the debugger: Meta-debugging is where madness lies

rust-lldb ships with every Rust installation via rustup because even the compiler team got tired of debugging by reading raw memory dumps. It's not perfect - the Python pretty-printers crash on proc-macro generated types and take LLDB down with them - but it beats manually calculating pointer offsets when you're already hours deep into a production incident.

The Rust debugging documentation covers the basics, but real-world debugging scenarios require understanding the LLDB API and how Rust's memory layout works under the hood. When debugging async code, you're dealing with generated state machines that LLDB struggles to represent. The Rust async book explains why async debugging is fundamentally difficult.

Platform-specific debugging issues are documented in various GitHub issues, particularly around macOS compatibility and Windows WSL2 problems. The LLVM project maintains LLDB, but Rust-specific enhancements come from the Rust compiler team.
Debugging Tools Ranked by How Much They'll Piss You Off

Tool

When It's Great

When It Sucks Ass

Real Performance Cost

Platform Hell Factor

rust-lldb

Shows actual Rust values, works everywhere

Pretty printer crashes and takes LLDB with it

Python overhead = 2-10x slower on large HashMaps

macOS: Xcode breaks it randomly

rust-gdb

Fast, reliable on Linux

Completely broken on macOS since 2019

Minimal overhead

Linux: Works great, Windows: good luck

Plain LLDB

Raw speed, never crashes

Good luck figuring out what your Vec contains

Zero Rust-awareness overhead

Consistent across platforms (consistently bad for Rust)

VS Code + CodeLLDB

Pretty UI, point-and-click debugging

Just rust-lldb underneath with extra failure modes

UI lag + Python overhead

Extension randomly stops working

JetBrains RustRover

Professional debugging UI

$200/year to debug your free language

Heavy IDE + debugging overhead

Windows/Linux only, macOS support is "experimental"

println! debugging

Always works, zero setup

Requires recompile+deploy for every debug line

Can tank performance in hot loops

Universal suffering

The Emergency Debugging Survival Guide: What Actually Works When Production Is Down

So you've read the comparison table above and decided rust-lldb is your least-worst option. Good fucking call. Now here's what you actually need to know when production is down, customers are screaming, and you need to figure out what the hell went wrong before your manager starts asking why the SLA breach notification went out.

The Dumb Shit To Check First (Save Yourself 2 Hours)

Before you spend all night debugging, verify these basics:

## Check if rust-lldb even exists
which rust-lldb

## If that fails, your Rust install is broken
curl --proto '=https' --tlsv1.2 -sSf https://sh.rustup.rs | sh
rustup component add rust-src    # You'll need this for stepping through stdlib

The Build That Actually Works:

## Debug build (quick if lucky, forever if not)
cargo clean && cargo build

## Release build that you can actually debug
cargo build --release --config \"profile.release.debug=true\" --config \"profile.release.opt-level=1\"

That opt-level=1 is the magic sauce. Level 2 and 3 optimize out everything you care about.

Commands You'll Actually Use (Copy-Paste Ready)

Start debugging something:

rust-lldb target/debug/your_binary

The only breakpoint command that works reliably:

(lldb) b main
(lldb) b src/lib.rs:42
(lldb) b \"my_crate::my_function\"

See what the fuck is happening:

(lldb) run
(lldb) bt              # Where am I?
(lldb) fr v            # What variables exist?
(lldb) p my_variable   # What's in this thing?

Continue without losing your mind:

(lldb) n       # Next line (don't step into functions)
(lldb) s       # Step into (prepare for std library hell)
(lldb) c       # Just fucking continue

When Everything Goes Wrong (Nuclear Options)

The pretty printer crashed with "Python exception" spam:

(lldb) settings set target.enable-synthetic-value false

Now you see raw pointers and discriminant values, but at least LLDB stops crashing every 30 seconds.

Symbols are fucked:

(lldb) target symbols add target/debug/deps/*.so

LLDB is completely broken:

cargo clean
rm -rf target/
cargo build

The classic "delete everything and try again."

Command Line Debugging Interface

Still broken? Try rust-gdb:

rust-gdb target/debug/your_binary

Different failure modes = sometimes works when rust-lldb doesn't.

Real Debugging Scenarios (With Actual Error Messages)

Your async service is hanging and eating 100% CPU:

(lldb) thread list
(lldb) thread select 1
(lldb) bt
## Look for \"__async_\" functions in the backtrace
## Usually stuck in a poll() loop or waiting on a broken Future

Segfault in unsafe code:

(lldb) run
## Crashes immediately
(lldb) register read
(lldb) memory read $rip
## Usually it's a null pointer dereference

HashMap is "empty" but should have data:

(lldb) p &my_hashmap
## Get the raw address
(lldb) memory read 0x7fff5fbff000 --size 64
## Check if the memory is actually allocated

What Actually Fails and How to Deal With It

"Symbol not found": Your binary was stripped or optimized. Build with debug symbols or give up.

"No such file or directory": Cargo put your binary in some random subdirectory with a hash. Use find target/ -name \"*your_binary*\" to locate it.

Pretty printer shows garbage: The Python pretty printer is interpreting your memory layout wrong. Use settings set target.enable-synthetic-value false and read raw memory.

LLDB consumes 8GB of RAM: You tried to inspect a large collection. Kill LLDB and add a print statement instead.

Platform-Specific Bullshit

macOS: Code signing is required for debugging some targets:

codesign -s - target/debug/your_binary

Linux: If debugging fails with permission errors:

echo 0 | sudo tee /proc/sys/kernel/yama/ptrace_scope

Windows/WSL2: Just don't. Use native Windows Rust instead:

## In PowerShell
cargo build
rust-lldb.exe target/debug/your_binary.exe

Production Debugging Reality Check

Core dump analysis (when your service crashes):

rust-lldb -c core.dump target/release/your_service
(lldb) bt
(lldb) fr v
## You have maybe 30 seconds before someone asks what happened

Attach to running process (risky but sometimes necessary):

rust-lldb --attach-pid $(pgrep your_service)
## This might crash your service, hope you have a backup instance

Remote debugging (over SSH):

## On target machine
lldb-server platform --listen 0.0.0.0:1234

## On your machine
rust-lldb
(lldb) platform connect connect://target:1234
(lldb) target create /path/to/binary

Works 60% of the time, every time.

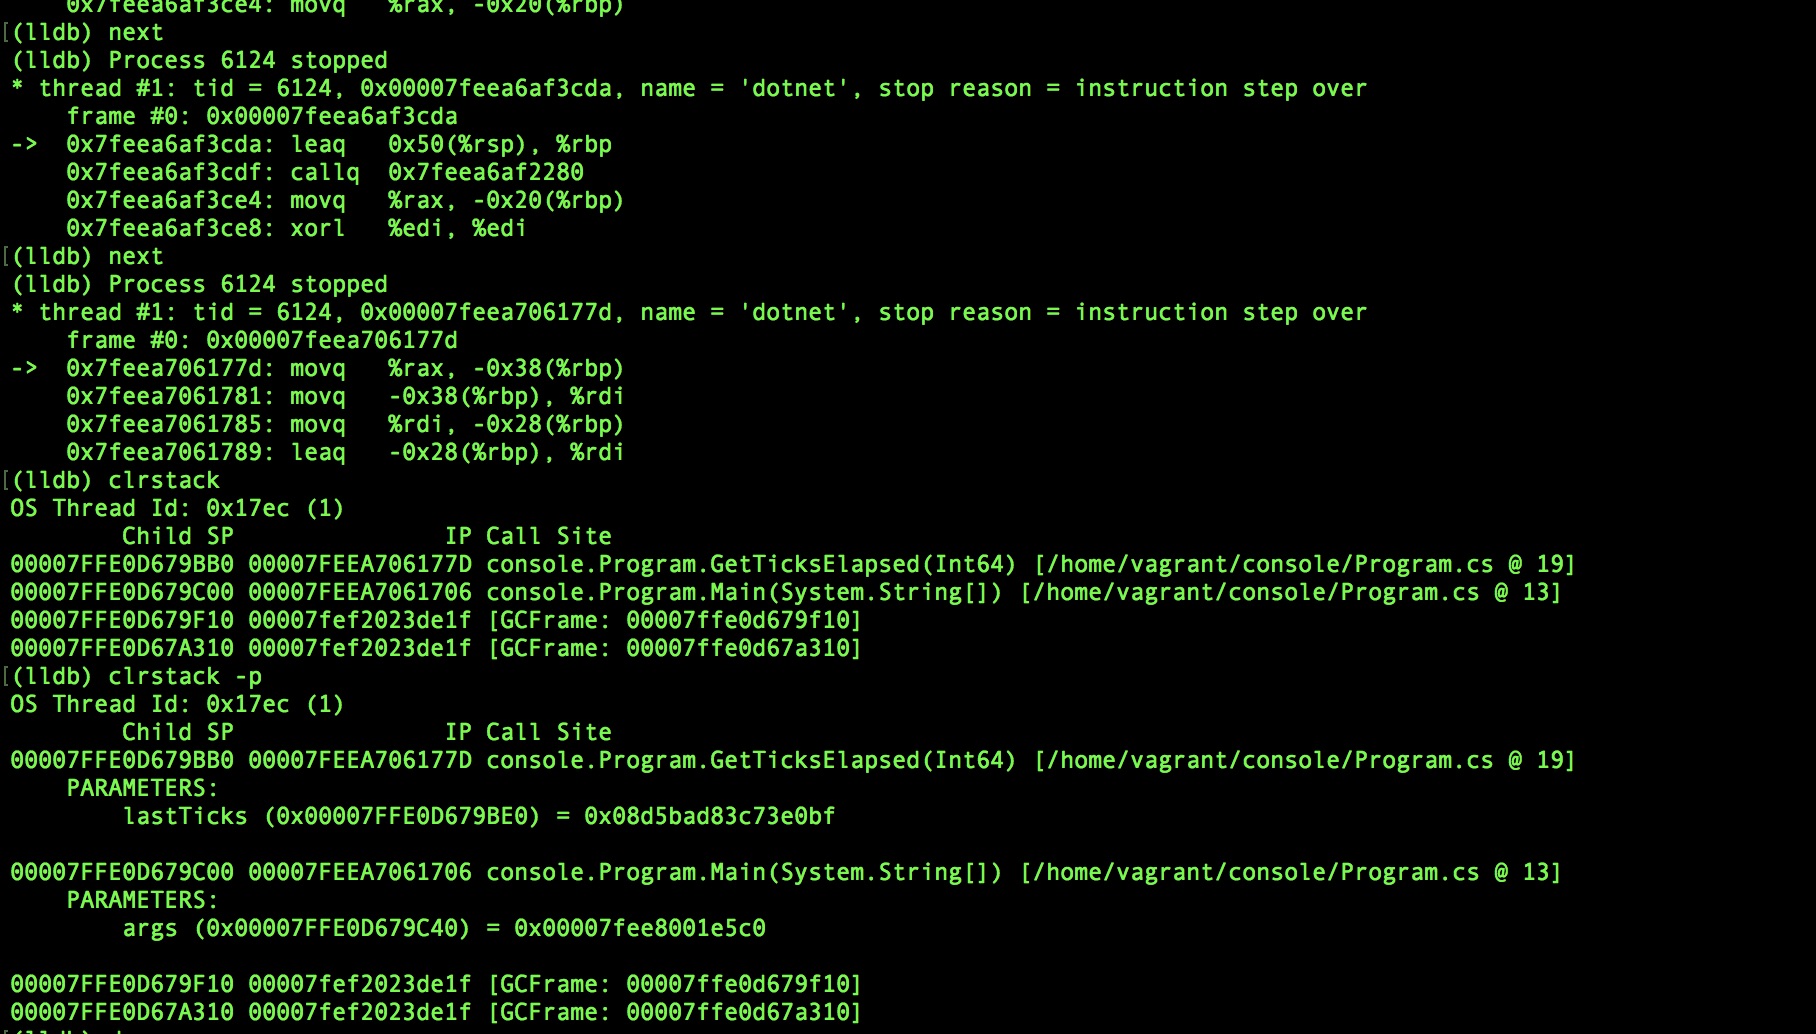
Terminal Debugging Session

Time Estimates Based on Reality

  • Simple panic: 5 minutes to find, 2 hours to understand why it's happening
  • Memory corruption: Half your day minimum, possibly the rest of your career
  • async deadlock: 30 minutes to identify, rest of afternoon to fix, entire evening to test
  • Proc macro issues: Just add print statements, debugging won't help you here

Remember: If you're fighting with the debugger for more than 30 minutes, just add println! statements and redeploy. Sometimes the dumb solution is the only solution that works.

Additional Resources for Production Debugging:

The Rust Performance Book covers profiling techniques that complement debugging. For memory issues, AddressSanitizer often finds problems faster than manual debugging. The Tokio tracing framework provides structured logging that's more reliable than debugger attachment for async services.

When rust-lldb fails completely, rr time-travel debugging on Linux can record execution and replay it deterministically. The VS Code Rust extension provides IDE integration, while JetBrains RustRover offers professional debugging features.

Community resources include the Rust Users Forum debugging section, Stack Overflow rust-lldb questions, and Reddit r/rust debugging discussions. The Rust embedded debugging guide covers embedded-specific debugging challenges.

Questions Real Developers Actually Ask (When Things Break)

Q

Why does rust-lldb show "optimized out" for literally everything?

A

Because you built with --release and the optimizer deleted all your variables "for performance." Even simple stuff like let x = 42; println!("{}", x); becomes <optimized out>. Try this instead:bashcargo build --release --config "profile.release.debug=true" --config "profile.release.opt-level=1"That opt-level=1 is the sweet spot. Level 2 optimizes out local variables, level 3 inlines everything and deletes your stack frames.

Q

How do I debug when the pretty printer crashes and takes LLDB with it?

A

Happens all the goddamn time with custom derives and proc macros. Nuclear option:bash(lldb) settings set target.enable-synthetic-value falseNow you see raw memory layouts, but at least LLDB doesn't crash constantly.

Q

Why does attaching to a running process work on macOS but fail silently on Linux?

A

Linux has security features called "ptrace protections" that block debugging by default. Fix it with:bashecho 0 | sudo tee /proc/sys/kernel/yama/ptrace_scopeOr run as root, which is definitely the secure option for production debugging. (That's sarcasm, don't actually do that.)

Q

Why does rust-lldb consume 4GB of RAM when I inspect my HashMap?

A

The Python pretty printer tries to render every fucking key-value pair in real time. HashMap with 10,000 entries? That's 10,000 Python function calls, each allocating memory for string formatting. Kill LLDB with Ctrl+C and just add println!("{:#?}", &my_map.keys().take(5).collect::<Vec<_>>()) instead.

Q

How do I debug when conditional breakpoints make everything 10x slower?

A

Don't use conditional breakpoints. They're slow as shit because they evaluate Python expressions on every hit. Use regular breakpoints and spam continue manually.

Q

Why can't I set breakpoints in my async functions?

A

Because async functions get transformed into state machines with names like __async_block_0_state_machine_resume. Set breakpoints on the actual line numbers in your source file, not function names.

Q

How do I debug when my test binary is called `my_test-a1b2c3d4e5f6` in `target/debug/deps/`?

A

Cargo adds random hashes to test binaries. Find it with:bashfind target/debug/deps -name "*my_test*" -type f -executableOr just use cargo test --no-run and check the output for the exact path.

Q

Why does rust-lldb work perfectly until I upgrade macOS?

A

Apple breaks LLDB with every major OS update because they hate developers. Monterey update killed rust-lldb for months. Big Sur broke codesigning. Ventura changed how debug symbols load. The solution is always "downgrade Xcode, cross your fingers, sacrifice a goat." Check recent GitHub issues for whatever Apple broke this time.

Q

How do I debug async code when the backtrace is 90% executor internals?

A

You don't. async debugging is fundamentally broken because the real stack is scattered across heap-allocated state machines. Use tracing or println! instead. Seriously.

Q

Why does rust-lldb work on Rust 1.68 but crash on 1.70?

A

Rust 1.70 changed the DWARF debug format. If you're using LLDB < 15, symbols just don't load. Update LLDB or downgrade Rust. There's no middle ground.

Q

How do I debug when WSL2 makes rust-lldb randomly fail?

A

You don't debug in WSL 2. Use native Windows Rust or switch to Linux. WSL2 networking + debugging = guaranteed pain.

Q

Why do my breakpoints work in `fn main()` but not in library code?

A

Your library code might be inlined or optimized away. Also, Cargo might be linking to a different version than you think. Check with:bash(lldb) image listMake sure you're debugging the right binary.

Q

How do I debug when the pretty printer shows my Vec as empty but it has 1000 items?

A

The pretty printer got confused by your type layout. This happens with:

  • Custom allocators
  • Transmuted types
  • Vec inside a union
  • Basically any clever memory tricks

Disable pretty printing and read raw memory instead.

Q

Why does debugging work fine until I add `serde` derives?

A

Proc macros generate code that confuses the debugger. The generated symbols don't map back to your source code cleanly. Use cargo expand to see what code actually exists, then debug that.

Q

How do I debug when rust-lldb eats 100% CPU and never shows a prompt?

A

Kill it with Ctrl+C and restart. This happens when:

  • LLDB gets stuck parsing corrupted debug symbols
  • Python pretty printers enter infinite loops
  • Your binary has circular references in its type system

If it keeps happening, your debug symbols are fucked. Do a clean rebuild.

Q

Why does rust-lldb show different results than println! for the same variable?

A

The debugger might be looking at a different point in time due to optimizations, or the pretty printer is misinterpreting your memory layout. Trust println!

  • it's reading the actual runtime value.

Resources Ranked by How Much They Actually Help vs Waste Your Time

Related Tools & Recommendations

tool
Similar content

rust-gdb - GDB That Actually Understands Rust

Master rust-gdb, the essential debugger for Rust. Learn why it's crucial for complex debugging, installation tips, and how to tackle async code, optimized varia

rust-gdb
/tool/rust-gdb/overview
100%
compare
Similar content

Python vs JavaScript vs Go vs Rust - Production Reality Check

What Actually Happens When You Ship Code With These Languages

/compare/python-javascript-go-rust/production-reality-check
38%
integration
Recommended

Running Claude, Cursor, and VS Code Together Without Losing Your Mind

I got tired of jumping between three different AI tools losing context every damn time

Anthropic Claude
/integration/claude-cursor-vscode/claude-cursor-vscode-architecture
31%
review
Recommended

Cursor Enterprise Security Assessment - What CTOs Actually Need to Know

Real Security Analysis: Code in the Cloud, Risk on Your Network

Cursor
/review/cursor-vs-vscode/enterprise-security-review
31%
compare
Recommended

VS Code vs IntelliJ - 진짜 써본 후기

새벽 3시에 빌드 터져서 멘붕 온 적 있나?

Visual Studio Code
/ko:compare/vscode/intellij/developer-showdown
31%
tool
Popular choice

jQuery - The Library That Won't Die

Explore jQuery's enduring legacy, its impact on web development, and the key changes in jQuery 4.0. Understand its relevance for new projects in 2025.

jQuery
/tool/jquery/overview
31%
tool
Popular choice

Hoppscotch - Open Source API Development Ecosystem

Fast API testing that won't crash every 20 minutes or eat half your RAM sending a GET request.

Hoppscotch
/tool/hoppscotch/overview
29%
tool
Popular choice

Stop Jira from Sucking: Performance Troubleshooting That Works

Frustrated with slow Jira Software? Learn step-by-step performance troubleshooting techniques to identify and fix common issues, optimize your instance, and boo

Jira Software
/tool/jira-software/performance-troubleshooting
28%
tool
Recommended

rust-analyzer - Finally, a Rust Language Server That Doesn't Suck

After years of RLS making Rust development painful, rust-analyzer actually delivers the IDE experience Rust developers deserve.

rust-analyzer
/tool/rust-analyzer/overview
28%
tool
Popular choice

Northflank - Deploy Stuff Without Kubernetes Nightmares

Discover Northflank, the deployment platform designed to simplify app hosting and development. Learn how it streamlines deployments, avoids Kubernetes complexit

Northflank
/tool/northflank/overview
27%
tool
Popular choice

LM Studio MCP Integration - Connect Your Local AI to Real Tools

Turn your offline model into an actual assistant that can do shit

LM Studio
/tool/lm-studio/mcp-integration
26%
tool
Similar content

Rocket Broke? Here's How to Fix It

Debugging Rocket when you're ready to throw your laptop out the window.

Rocket
/undefined/troubleshooting-guide
25%
tool
Popular choice

CUDA Development Toolkit 13.0 - Still Breaking Builds Since 2007

NVIDIA's parallel programming platform that makes GPU computing possible but not painless

CUDA Development Toolkit
/tool/cuda/overview
24%
news
Popular choice

Taco Bell's AI Drive-Through Crashes on Day One

CTO: "AI Cannot Work Everywhere" (No Shit, Sherlock)

Samsung Galaxy Devices
/news/2025-08-31/taco-bell-ai-failures
23%
news
Popular choice

AI Agent Market Projected to Reach $42.7 Billion by 2030

North America leads explosive growth with 41.5% CAGR as enterprises embrace autonomous digital workers

OpenAI/ChatGPT
/news/2025-09-05/ai-agent-market-forecast
22%
troubleshoot
Recommended

Conflictos de Dependencias Python - Soluciones Reales

depends on Python

Python
/es:troubleshoot/python-dependency-conflicts/common-errors-solutions
21%
compare
Recommended

mojo vs python mobile showdown: why both suck for mobile but python sucks harder

depends on Mojo

Mojo
/brainrot:compare/mojo/python/performance-showdown
21%
news
Popular choice

Builder.ai's $1.5B AI Fraud Exposed: "AI" Was 700 Human Engineers

Microsoft-backed startup collapses after investigators discover the "revolutionary AI" was just outsourced developers in India

OpenAI ChatGPT/GPT Models
/news/2025-09-01/builder-ai-collapse
21%
news
Popular choice

Docker Compose 2.39.2 and Buildx 0.27.0 Released with Major Updates

Latest versions bring improved multi-platform builds and security fixes for containerized applications

Docker
/news/2025-09-05/docker-compose-buildx-updates
21%
news
Popular choice

Anthropic Catches Hackers Using Claude for Cybercrime - August 31, 2025

"Vibe Hacking" and AI-Generated Ransomware Are Actually Happening Now

Samsung Galaxy Devices
/news/2025-08-31/ai-weaponization-security-alert
21%

Recommendations combine user behavior, content similarity, research intelligence, and SEO optimization