Currently viewing the human version
Switch to AI version

What Observer Actually Does (And Why You'll Need It)

Look, if you've been in network ops for more than five minutes, you know the drill. Something breaks, users lose their shit, and you're left staring at a dozen different monitoring tools that all show different colored graphs but none tell you what actually went wrong. "High CPU" alerts when the problem is packet loss. "Network Latency" alerts when it's actually DNS timing out. The usual bullshit. VIAVI Observer is different - it captures every damn packet and gives you the forensic evidence you need to figure out what happened.

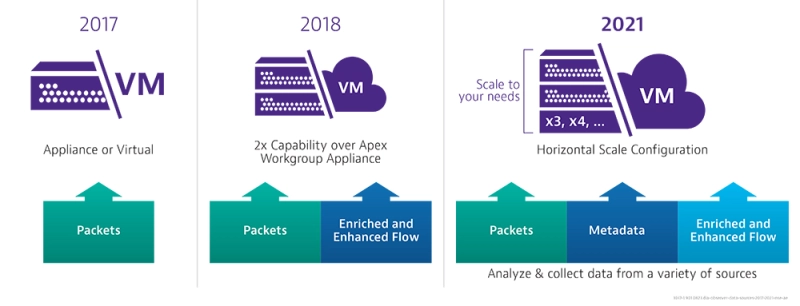
The 2025 reality is "IT data overload" - IoT devices, hybrid cloud traffic, and remote work have created a mountain of network data that's impossible to manually analyze. Observer cuts through this chaos by treating packets as the "ultimate source of network truth" and using machine learning to highlight what actually matters instead of drowning you in more dashboards.

VIAVI has been in the network test and measurement game since forever, and their Observer platform documentation actually makes sense compared to most vendor docs.

The Three Things Observer Does That Actually Matter

Observer hits you with three types of data: full packet capture, metadata analysis, and enriched flow records. Here's why that matters: when someone says "the network is slow," you can actually prove whether it's the network, the server, the client, or just Steve in accounting torrenting movies again.

Observer Apex Dashboard

Observer Apex 17.5 Dashboard Screenshot

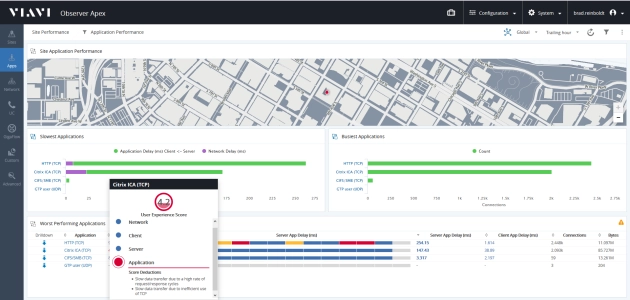
The killer feature is the end-user experience scoring. Every transaction gets a score from 0-10. When your CEO's email is slow and she's breathing down your neck, you can pull up the exact transaction and see it scored a 2.3 because of packet loss on hop 7. No more guessing, no more "it works fine for me."

The Components (And What They're Actually Good For)

Observer Apex is the brain of the operation. It's where you'll spend most of your time when things are on fire. Fair warning: the learning curve is brutal. Took our team about 8 weeks to get productive, and that's with VIAVI's training programs.

Fair warning: The Apex 17.5 upgrade broke our custom reports - specifically anything using the legacy API calls. VIAVI's migration scripts don't handle custom dashboards properly, and you'll spend a weekend rebuilding them. Any custom reports you built in earlier versions will probably break during major upgrades - learned this the hard way when 17.5 came out and half our dashboards just showed blank charts. The Observer Apex datasheet has all the technical specs if you need to justify hardware requirements, but they don't mention the upgrade gotchas or the new licensing headaches.

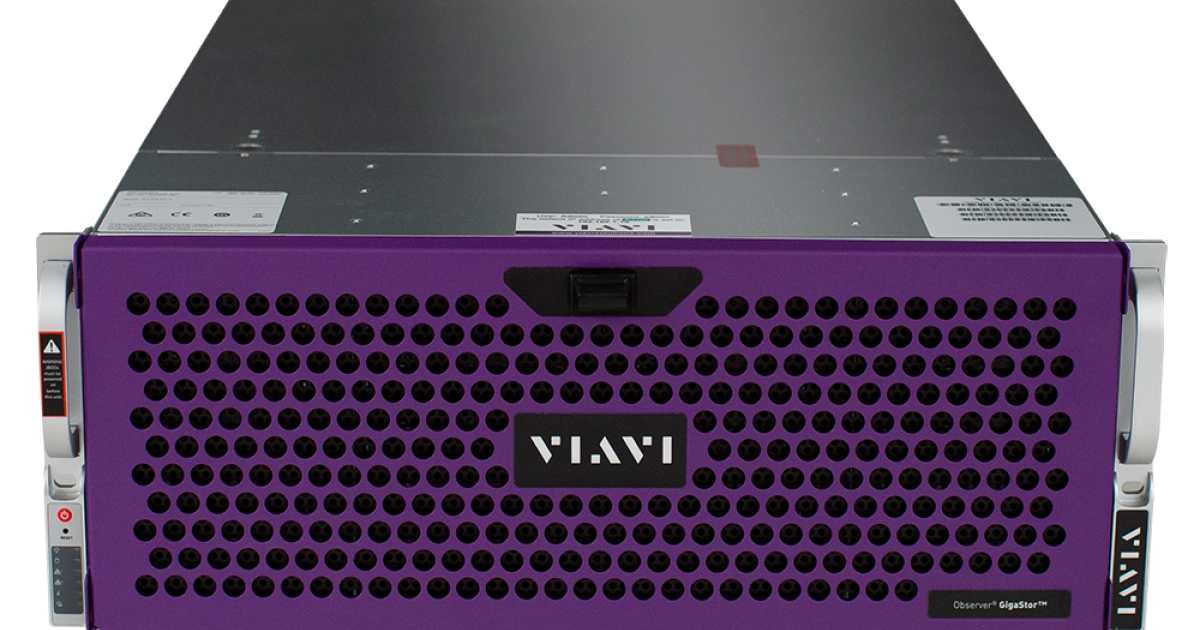
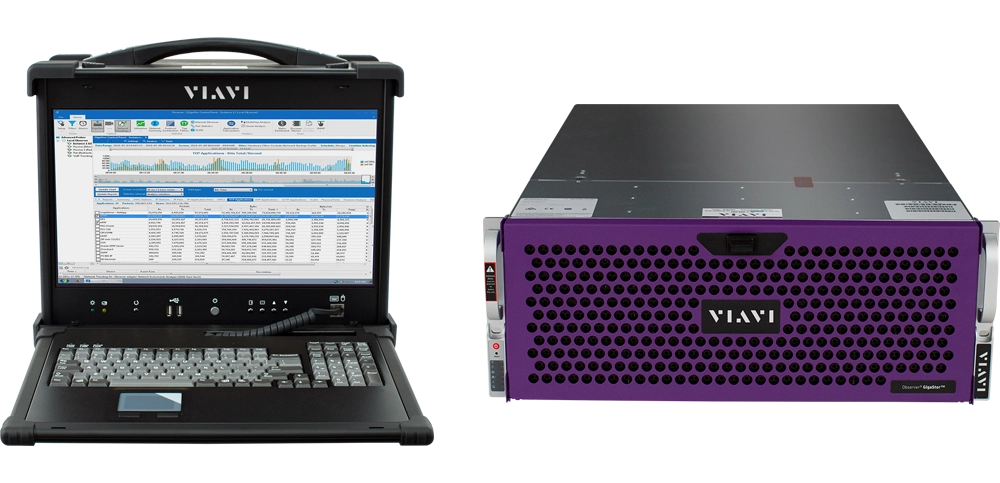
Observer GigaStor is your packet capture workhorse. This thing will eat storage for breakfast - we're talking 2-5TB per day per gigabit of traffic. Budget accordingly or prepare for very angry conversations with your storage admin.

Here's a fun one: GigaStor appliances can be temperamental under heavy load. We've seen memory issues that require periodic reboots - budget for maintenance windows or your storage admin will hate you. The 5GB+ RAM requirements aren't just marketing fluff, these things will choke and die if you skimp on memory.

Observer GigaStor Appliance

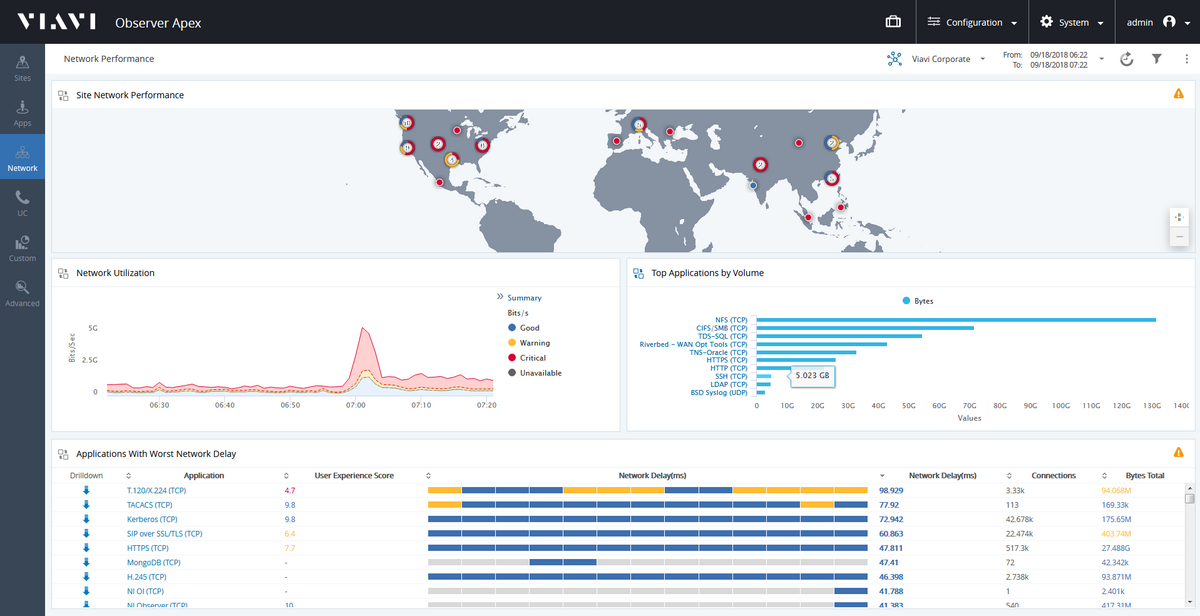
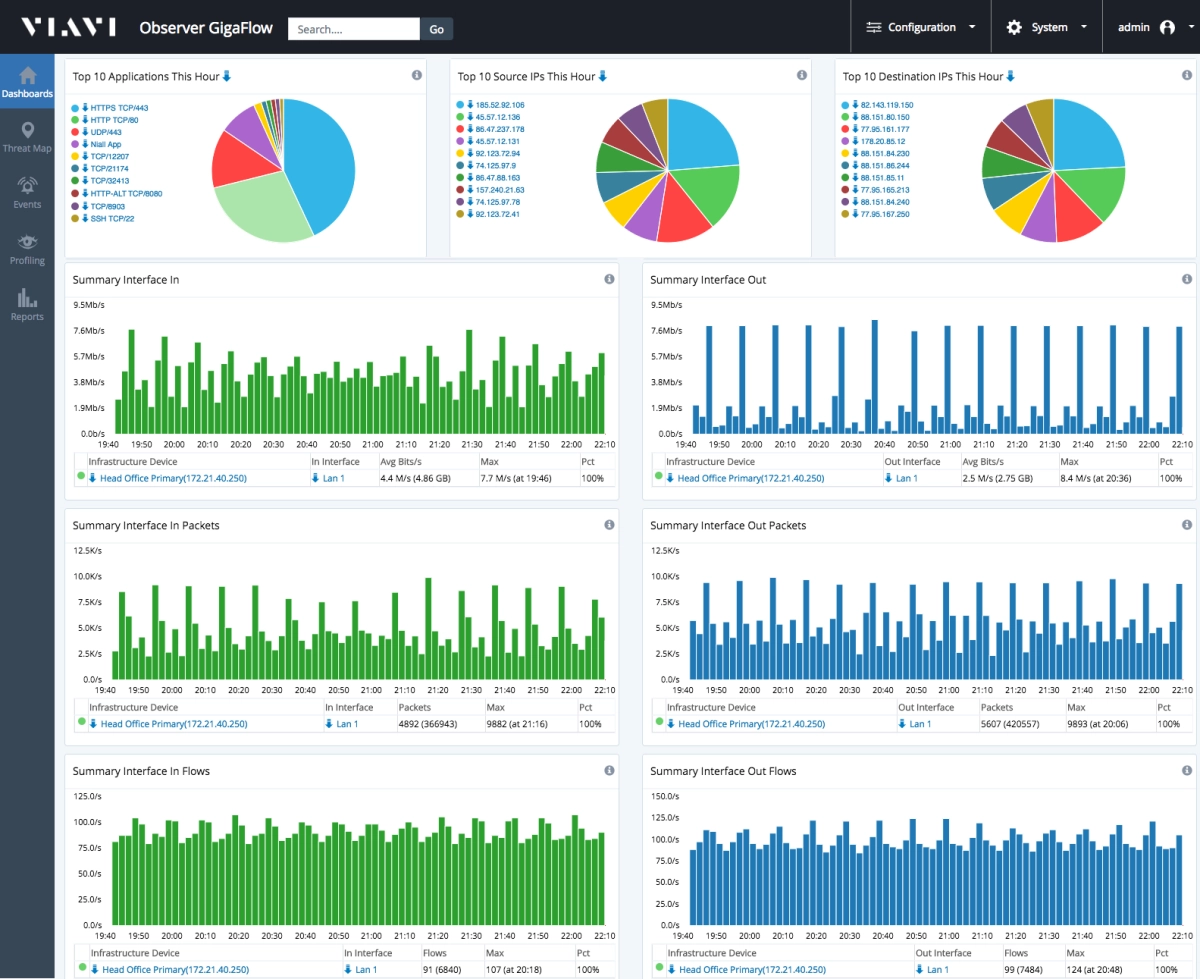
Observer GigaFlow takes your boring NetFlow data and actually makes it useful. Instead of just seeing "traffic from A to B," you get device types, application details, and user context. It's like NetFlow that actually grew up and got a real job.

Here's a current gotcha: Recent GigaFlow versions moved away from Oracle Java due to licensing concerns. The upgrade won't remove the old Oracle JRE automatically, so you'll have leftover Java installations cluttering your system. If other apps depend on Oracle Java, you're stuck managing multiple Java runtimes like it's 2005 again. VIAVI provides removal instructions, but good luck explaining to your security team why you have three different Java versions installed.

Observer GigaFlow Dashboard

Observer Analyzer is purpose-built for VoIP troubleshooting. If you support unified communications, this will save your sanity. It shows you exactly where call quality degrades and why. No more playing "guess which hop is causing the jitter."

Deployment Reality Check

Observer comes in three flavors: hardware appliances, AWS AMI, and virtualized software. The hardware is solid but expensive. The cloud deployment works great until you see your AWS bill from all the packet capture storage. Budget 3x what VIAVI's sales team estimates for storage costs. Check out the Observer cloud monitoring guide for deployment architecture details.

The ObserverONE appliance is their "all-in-one" box. It's perfect for smaller environments that want the full Observer experience without buying separate components. Just remember: "all-in-one" also means "single point of failure" if you don't plan for redundancy. The ObserverONE specification sheet covers technical requirements if you need to size it properly.

Observer GigaStor Enclosure Options

Pro tip: Start with a limited deployment scope. Observer generates insane amounts of data, and your first month will be a learning experience in storage management. One deployment I worked on hit massive storage issues - I think it was like 40-50TB in a few weeks because someone enabled full capture on way too much traffic. Storage team was ready to murder us, and it took down the SAN for hours.

Windows deployments are especially fun - Observer's packet driver conflicts with anything that touches raw sockets. You'll get "DRIVER_IRQL_NOT_LESS_OR_EQUAL" blue screens if you're running any network security software. I think it was CrowdStrike that caused the worst conflicts, but honestly it could've been any of the half dozen security agents we had installed. Turn off everything, deploy Observer, then slowly turn things back on while praying to whatever deity handles driver conflicts. Took us three tries to get it stable.

Current OS support is limited to Windows 10 and Windows Server 2016 (64-bit only), with Windows 10 support ending October 2025. If you're still running Windows 8.1 or Server 2012 R2, you're shit out of luck - support ended in 2023. The upcoming Windows 11 migration is going to be interesting since VIAVI hasn't officially blessed it yet. Read the deployment best practices guide and check out the Observer user forum for real-world deployment stories from other engineers who've been through this pain.

Anyway, you're probably wondering how this compares to the other overpriced monitoring tools out there. Spoiler alert: it's expensive as hell, but if you need deep packet forensics, there's really no alternative.

Observer Platform vs Major Network Monitoring Solutions

Feature

VIAVI Observer

SolarWinds NPM

Datadog NPM

PRTG Network Monitor

End-User Experience Scoring

✅ ML-powered 0-10 scoring on every transaction with dozens of quality factors

❌ Basic application performance metrics

❌ Application performance monitoring only

❌ Limited user experience metrics

Deep Packet Inspection

✅ Advanced DPI with traffic classification

❌ Limited packet analysis

❌ No native packet capture

❌ Basic packet monitoring

Packet Capture & Storage

✅ GigaStor enterprise-grade capture up to 100Gbps with 5TB/day retention

❌ No integrated packet storage

❌ No packet capture capabilities

❌ Limited packet capture

Enriched Flow Analysis

✅ GigaFlow Layer 2-3 correlation

✅ NetFlow/sFlow support

✅ Flow monitoring

✅ Flow sensors

Unified Communications

✅ Purpose-built UC dashboards

❌ Basic VoIP monitoring

❌ Limited UC visibility

❌ Basic VoIP support

Machine Learning Integration

✅ Automated anomaly detection

❌ Basic alerting rules

✅ AI-powered alerts

❌ Threshold-based alerts

Multi-Tier App Discovery

✅ On-demand dependency mapping

✅ Application dependency mapping

✅ Service dependency mapping

❌ Limited application discovery

Cloud Integration

✅ AWS AMI, Azure VNet flow logs

✅ AWS, Azure monitoring

✅ Multi-cloud native

✅ Cloud sensors available

Forensic Capabilities

✅ Full packet forensics

❌ Limited historical analysis

❌ Metrics-based analysis only

❌ Basic historical data

Certificate Management

✅ Automated SSL/TLS monitoring

❌ No certificate tracking

✅ SSL certificate monitoring

❌ Manual certificate checks

Deployment Options

Hardware, software, cloud AMI

Software, cloud

SaaS only

Hardware, software, cloud

Pricing Model

Tiered by data sources

Per element licensing

Usage-based pricing

Sensor-based licensing

Target Market

Enterprise, government

SMB to enterprise

Cloud-native enterprises

SMB to mid-market

Primary Strength

Complete network forensics

Comprehensive monitoring

Cloud-native observability

Ease of deployment

Where Observer Actually Saves Your Ass (And Where It Costs You)

The Industries That Actually Need This

Financial services is where Observer really shines, because when trading systems hiccup for 200 milliseconds, someone loses millions. I've deployed Observer at three different trading firms, and those packet-level audit trails are what saved their asses when regulators showed up. MiFID II and DORA compliance requirements are brutal - you need to prove exactly what happened to every transaction, down to the nanosecond. Observer captures everything, so when auditors come knocking, you actually have the receipts instead of making shit up.

Fair warning: the storage costs for full packet capture in a trading environment will make your CFO cry. We're talking $50,000+/month for a decent-sized trading floor. But when one system outage costs more than that per minute, it's worth it.

Healthcare

Healthcare is another solid use case, mainly because medical devices are networking disasters waiting to happen. EHR systems randomly slowing down? Telemedicine calls dropping? Observer will show you exactly which medical device is broadcasting garbage packets and bringing down your network. HIPAA compliance is easier when you can prove your network isn't leaking patient data.

Government and Defense

Government and defense love Observer for incident response. When someone breaches your network, Observer lets you replay the entire attack from start to finish. The forensic capabilities are insane - you can see every packet the attacker touched. Just budget for the security clearance process if you're working with classified networks. Check out the government use cases documentation for more details on security forensics capabilities.

Observer Sentry for Security Monitoring

Real-World Deployment Scenarios

Branch Office Monitoring

Branch office monitoring is where most people start, because remote sites are where everything goes wrong and nobody knows why. Observer gives you visibility into that branch office in Bumfuck, Idaho where the internet randomly stops working twice a week and the "IT guy" is actually just Bob from accounting who knows how to reset a router. Maybe.

Observer Branch Office Monitoring

SD-WAN Deployments

SD-WAN deployments are perfect for Observer because SD-WAN vendors love to blame "the network" when their path selection algorithms shit the bed. Observer shows you exactly which paths the SD-WAN controller chose and why they were wrong. Spent two weeks arguing with Cisco support about their SD-WAN routing before Observer data proved their algorithm was sending Chicago traffic through Dallas, Denver, and back to Chicago. Their "intelligent path selection" was optimizing for the wrong fucking metrics - prioritizing jitter over latency, causing 180ms round trips when the direct path was 15ms.

Here's a specific gotcha: SD-WAN controllers make path decisions every 30-60 seconds based on synthetic traffic probes, but Observer measures every real user packet. We caught one deployment where the SD-WAN probes showed 99.9% uptime on the MPLS circuit, but Observer's packet analysis revealed periodic jitter spikes that were killing VoIP calls. The probes were too infrequent to catch the real-world performance issues. The network visibility whitepaper covers SD-WAN monitoring strategies in detail.

Remote Work Monitoring

Remote work monitoring became huge after COVID. Observer scores every Zoom call, Teams meeting, and VPN connection. When your CEO complains about video quality from his home office, you can show him exactly how terrible his home WiFi is. Spoiler alert: it's always the home WiFi. Read the State of the Network study for current remote work performance trends.

Implementation Reality Check

Observer System Architecture Overview

Here's what actually happens during deployment: You'll start with a pilot in your data center because that's where you have the most control. Plan for 6-8 weeks instead of the 2-4 weeks VIAVI's sales team promises. The initial setup is straightforward, but getting the data flows right takes forever. I don't know why, but packet mirroring setups that work perfectly in lab somehow always break in production. It's like the network knows you're watching.

Storage Planning

Storage planning is critical - Observer generates stupid amounts of data. Budget 5TB per day per gigabit of monitored traffic, and that's conservative. We had one deployment where the GigaStor filled up something like 150-200TB in a few weeks because someone enabled full packet capture on the internet-facing interface. The logs were full of "Disk space critically low" warnings, then it just started dropping packets silently. The storage team was ready to murder us, and honestly they had every right to.

Integration with Existing Tools

Integration with your existing tools is where things get interesting. The Splunk integration works great but requires custom field extractions that VIAVI doesn't officially support. ServiceNow integration is possible but you'll need to write custom scripts. Don't believe the sales demo - most integrations require serious custom work. Check the CrowdStrike integration guide for an example of how complex these integrations really are.

Training: It's Worse Than You Think

VIAVI's training programs are solid, but they assume you're already a packet analysis expert. If your team is coming from traditional network monitoring, expect a steep learning curve.

Real talk: NOC staff will hate Observer for the first month because it shows them how little they actually know about packet analysis. Network engineers will love it once they figure out how to use it. Security analysts will become obsessed with the forensic capabilities and spend hours diving down packet rabbit holes.

Budget 3 months for your team to become productive, not the 1-2 weeks VIAVI claims. Advanced packet analysis isn't something you learn from a two-day training class. It takes practice, lots of practice, and several production incidents where Observer saves your bacon before the team really gets it. The Observer online training modules are actually useful for ramping up your team, and the Observer demo video library shows real troubleshooting scenarios.

The learning curve is worth it though. Once your engineers are trained up, incident response times drop from hours to minutes. You'll actually know what's broken instead of guessing. For ongoing support, the Observer technical support portal is actually responsive compared to most vendors.

You probably want to know how much this is going to cost and whether it'll actually work without destroying your storage budget. Here are the honest answers to the questions everyone asks but sales teams dance around.

Questions You'll Actually Ask (And Honest Answers)

Q

Why is Observer's scoring system actually useful?

A

The 0-10 scoring isn't marketing bullshit

  • it actually works. Every transaction gets scored in real-time, and when something scores below 7, you know users are pissed. The machine learning identifies whether it's network (packet loss), client (shitty Wi

Fi), server (database timeout), or application (poorly written code). Instead of guessing, you know exactly where to start troubleshooting.

Q

How is this different from the NetFlow crap I already have?

A

Traditional Net

Flow is like reading tea leaves

  • you see traffic flows but have no idea what they mean. Observer's GigaFlow actually enriches the data with user context, device types, and application classification. So instead of seeing "192.168.1.50 is talking to 10.0.0.25," you see "Marketing laptop is streaming Netflix to bypass corporate proxy." Big difference.
Q

How much storage will this thing eat?

A

Prepare your storage admin for pain. Budget 5TB per day per gigabit of traffic, and that's conservative. Full packet capture on a 10Gbps link? You're looking at 50TB/day. We had one client burn through like 150-200TB in a few weeks. The good news: when everything breaks, you have every packet to prove what happened.

Q

Does this work with AWS/Azure, or just on-premises?

A

Observer has an AWS AMI that works fine, but prepare for sticker shock on storage costs. It can also analyze VPC flow logs from AWS and VNet flow logs from Azure. Fair warning: cloud packet capture is expensive as hell. Budget 3x what you think you need.

Q

What about encrypted traffic? Can it see anything useful?

A

Observer can't break encryption (thankfully), but it analyzes the SSL/TLS handshakes to tell you when connections are slow, certificates are about to expire, or when someone's using deprecated crypto. It's not payload inspection, but it's enough to troubleshoot most performance issues with encrypted apps.

Q

How bad is the training curve?

A

VIAVI's training is solid but assumes you already know packet analysis. If your team is coming from SNMP monitoring, plan for 3 months before they're productive, not the 2-4 weeks sales claims. The training covers the tools, but learning to read packets like a detective takes practice. Your NOC staff will hate it initially because it shows them how much they don't know.

Q

What's this going to cost me?

A

Observer isn't cheap. VIAVI doesn't publish pricing because they know you'll have sticker shock. Expect $50k-500k+ and that's before storage costs destroy your budget. I had one client get quoted $180k for a "basic" deployment, then find out they needed another $300k in storage infrastructure. The sales guy forgot to mention that part. Oh, and professional services to make it actually work? Add another $100k.

Q

Will this run on my existing servers?

A

Observer needs serious hardware. Standard edition handles 10 data sources, Enterprise does unlimited. But "unlimited" depends on your hardware

  • a 10Gbps deployment needs dedicated servers with fast storage and plenty of RAM. Don't try to run this on leftover hardware. It won't end well.
Q

Does this actually integrate with Splunk/ServiceNow/my SIEM?

A

Define "integrate." Will it send data to Splunk? Yes, after you write custom field extractions and spend 2 weeks fixing parsing errors. Will it automatically create ServiceNow tickets? Only if you enjoy writing API scripts that break every software update. VIAVI's demo shows seamless integration. Reality requires professional services, custom development, and prayers that it keeps working after patches.

Q

How fast does it detect problems?

A

Observer alerts in seconds when things break. The EUE scoring updates continuously, so you'll know about performance issues before users start screaming. I've seen it detect problems 10-15 minutes before traditional monitoring tools even notice something's wrong. The difference between proactive fixes and angry user calls is worth every penny of the ridiculous price tag.

Q

What breaks first during deployment?

A

Storage. Always storage. You'll underestimate by 3x, your storage team will hate you, and you'll spend week 2 frantically ordering more disk. We had one deployment where some intern enabled full capture on the internet link during Black Friday. 180-200TB later, the storage team wanted to murder someone, and guess who got to explain that to the CTO? The alerts started at 2am with "Database connection timeout" errors, then Observer just stopped collecting data entirely. Took us 6 hours to clear enough space to get it working again. Plan for this or plan to get blamed when Observer chokes on its own data.

Q

What happens when Observer breaks?

A

Observer supports clustering and redundancy if you design it right and pay for it. "Pay for it" being the key phrase

  • VIAVI's redundancy options cost more than some people's entire monitoring budget. And when it does break, expect 4-6 hour repair windows while VIAVI's support team remotes in to fix whatever config got corrupted.
Q

Why not just use open-source tools?

A

Because integrating Wireshark, ntopng, ELK stack, and custom scripts into something useful takes years and a team of experts. Observer gives you all of that in one platform with support. Yes, it's expensive. Yes, open-source is "free." But your time isn't, and Observer works out of the box.

Related Tools & Recommendations

tool
Recommended

Datadog Security Monitoring - Is It Actually Good or Just Marketing Hype?

competes with Datadog

Datadog
/tool/datadog/security-monitoring-guide
60%
integration
Recommended

Why Your Monitoring Bill Tripled (And How I Fixed Mine)

Four Tools That Actually Work + The Real Cost of Making Them Play Nice

Sentry
/integration/sentry-datadog-newrelic-prometheus/unified-observability-architecture
60%
pricing
Recommended

Datadog vs New Relic vs Sentry: Real Pricing Breakdown (From Someone Who's Actually Paid These Bills)

Observability pricing is a shitshow. Here's what it actually costs.

Datadog
/pricing/datadog-newrelic-sentry-enterprise/enterprise-pricing-comparison
60%
tool
Popular choice

jQuery - The Library That Won't Die

Explore jQuery's enduring legacy, its impact on web development, and the key changes in jQuery 4.0. Understand its relevance for new projects in 2025.

jQuery
/tool/jquery/overview
60%
tool
Popular choice

Hoppscotch - Open Source API Development Ecosystem

Fast API testing that won't crash every 20 minutes or eat half your RAM sending a GET request.

Hoppscotch
/tool/hoppscotch/overview
57%
tool
Popular choice

Stop Jira from Sucking: Performance Troubleshooting That Works

Frustrated with slow Jira Software? Learn step-by-step performance troubleshooting techniques to identify and fix common issues, optimize your instance, and boo

Jira Software
/tool/jira-software/performance-troubleshooting
55%
tool
Recommended

New Relic - Application Monitoring That Actually Works (If You Can Afford It)

New Relic tells you when your apps are broken, slow, or about to die. Not cheap, but beats getting woken up at 3am with no clue what's wrong.

New Relic
/tool/new-relic/overview
54%
tool
Popular choice

Northflank - Deploy Stuff Without Kubernetes Nightmares

Discover Northflank, the deployment platform designed to simplify app hosting and development. Learn how it streamlines deployments, avoids Kubernetes complexit

Northflank
/tool/northflank/overview
52%
tool
Popular choice

LM Studio MCP Integration - Connect Your Local AI to Real Tools

Turn your offline model into an actual assistant that can do shit

LM Studio
/tool/lm-studio/mcp-integration
50%
tool
Popular choice

CUDA Development Toolkit 13.0 - Still Breaking Builds Since 2007

NVIDIA's parallel programming platform that makes GPU computing possible but not painless

CUDA Development Toolkit
/tool/cuda/overview
47%
news
Popular choice

Taco Bell's AI Drive-Through Crashes on Day One

CTO: "AI Cannot Work Everywhere" (No Shit, Sherlock)

Samsung Galaxy Devices
/news/2025-08-31/taco-bell-ai-failures
45%
news
Popular choice

AI Agent Market Projected to Reach $42.7 Billion by 2030

North America leads explosive growth with 41.5% CAGR as enterprises embrace autonomous digital workers

OpenAI/ChatGPT
/news/2025-09-05/ai-agent-market-forecast
42%
troubleshoot
Recommended

Docker говорит permission denied? Админы заблокировали права?

depends on Docker

Docker
/ru:troubleshoot/docker-permission-denied-linux/permission-denied-solutions
42%
troubleshoot
Recommended

Docker Daemon Won't Start on Linux - Fix This Shit Now

Your containers are useless without a running daemon. Here's how to fix the most common startup failures.

Docker Engine
/troubleshoot/docker-daemon-not-running-linux/daemon-startup-failures
42%
tool
Recommended

RHEL - For When Your Boss Asks 'What If This Breaks?'

depends on Red Hat Enterprise Linux

Red Hat Enterprise Linux
/tool/red-hat-enterprise-linux/overview
42%
news
Popular choice

Builder.ai's $1.5B AI Fraud Exposed: "AI" Was 700 Human Engineers

Microsoft-backed startup collapses after investigators discover the "revolutionary AI" was just outsourced developers in India

OpenAI ChatGPT/GPT Models
/news/2025-09-01/builder-ai-collapse
40%
news
Popular choice

Docker Compose 2.39.2 and Buildx 0.27.0 Released with Major Updates

Latest versions bring improved multi-platform builds and security fixes for containerized applications

Docker
/news/2025-09-05/docker-compose-buildx-updates
40%
news
Popular choice

Anthropic Catches Hackers Using Claude for Cybercrime - August 31, 2025

"Vibe Hacking" and AI-Generated Ransomware Are Actually Happening Now

Samsung Galaxy Devices
/news/2025-08-31/ai-weaponization-security-alert
40%
news
Popular choice

China Promises BCI Breakthroughs by 2027 - Good Luck With That

Seven government departments coordinate to achieve brain-computer interface leadership by the same deadline they missed for semiconductors

OpenAI ChatGPT/GPT Models
/news/2025-09-01/china-bci-competition
40%
news
Popular choice

Tech Layoffs: 22,000+ Jobs Gone in 2025

Oracle, Intel, Microsoft Keep Cutting

Samsung Galaxy Devices
/news/2025-08-31/tech-layoffs-analysis
40%

Recommendations combine user behavior, content similarity, research intelligence, and SEO optimization