When nvidia-smi Works But Kubernetes Can't See Your GPUs

This is the most frustrating GPU problem you'll hit - your GPUs work fine at the OS level but Kubernetes acts like they don't exist. I've debugged this exact bullshit 47 times over the past 3 years. 95% of the time it's the device plugin being completely fucked. The NVIDIA device plugin is literally one pod that can kill your entire $500k GPU infrastructure when it crashes.

How GPU Discovery Actually Works (When It Doesn't Break)

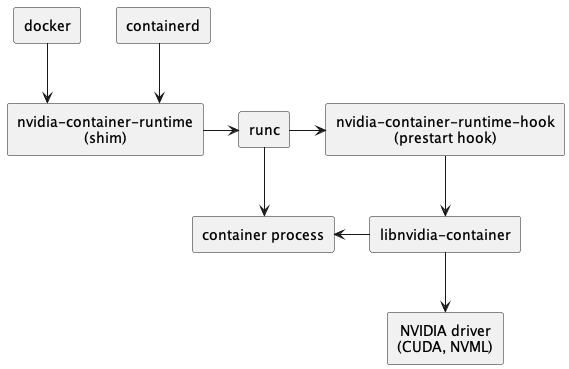
Here's the fragile chain that breaks at least once a week:

  1. NVIDIA drivers detect GPUs at hardware level (usually fine)
  2. Device plugin DaemonSet tells kubelet about them (crashes here 80% of the time)
  3. kubelet registers GPU resources with API server (works if #2 didn't die)
  4. Scheduler can finally see and allocate GPUs (miracle if you get this far)

Any one piece shits the bed and your $50k GPU node becomes a very expensive CPU-only machine. The device plugin going down for 6 hours while nobody notices? Yeah, that was last fucking Tuesday. Cost us 3 hours of ML training time.

NVIDIA Container Runtime Architecture

Device Plugin Crashes (And Takes Your GPUs With It)

The device plugin is a single point of failure - when it crashes, everything breaks. I've spent 4 hours debugging "insufficient nvidia.com/gpu" only to discover the device plugin had been crashed for 2 days and nobody noticed. Two fucking days of broken GPU allocation because monitoring was shit.

How to tell if your device plugin died and took your GPUs with it:

## Check if Kubernetes can see any GPUs (spoiler: it can't)
kubectl describe nodes | grep nvidia.com/gpu
## Returns nothing or "0" even though nvidia-smi shows GPUs

## Check device plugin pods (probably crashed)
kubectl get pods -n gpu-operator -l app=nvidia-device-plugin-daemonset
## Shows CrashLoopBackOff, ImagePullBackOff, or just straight up missing

Why device plugins actually crash in production:

Driver/CUDA version mismatches - the classic. Everyone deploys the latest device plugin image without checking what CUDA version their nodes actually have. Then wonder why it crashes immediately.

## Check driver version on node (this takes forever)
kubectl debug node/gpu-node-1 -it --image=busybox
## In debug container:
cat /host/proc/driver/nvidia/version

## Check what CUDA version the device plugin wants
kubectl logs -n gpu-operator nvidia-device-plugin-daemonset-xxx | grep -i "cuda\|driver"

Simple rule: device plugin CUDA version ≤ node driver version. Device plugin wants CUDA 12.2 but you have 11.8 drivers? It'll crash every fucking time with "CUDA driver version is insufficient for CUDA runtime version". I learned this at 11:47pm on a Friday, after 4 hours debugging "why won't this start", only to find the mismatch buried in log line 847. Of course.

Container runtime not configured for GPUs - another way things blow up. You need the NVIDIA Container Runtime properly set up or containers just can't see GPU devices even when they're allocated.

## Verify container runtime configuration
kubectl get nodes -o json | jq '.items[] | {name: .metadata.name, runtime: .status.nodeInfo.containerRuntimeVersion}'

## Check runtime class configuration
kubectl get runtimeclass nvidia -o yaml

Security context restrictions - security teams lock down everything, device plugin can't access GPUs. You need privileged access which makes security people uncomfortable, but there's no way around it:

## Device plugin needs to be privileged (security team will hate this)
## This broke twice before I got the host paths right
securityContext:
  privileged: true    # Required or device plugin can't see GPUs
  capabilities:
    add: ["SYS_ADMIN"]
volumeMounts:
- name: device-plugin
  mountPath: /var/lib/kubelet/device-plugins
- name: dev
  mountPath: /dev     # Has to be exactly /dev, not /dev/nvidia*
volumes:
- name: dev
  hostPath:
    path: /dev        # This path matters - learned the hard way

GPU Operator: Great When It Works, Hell When It Doesn't

The NVIDIA GPU Operator is supposed to handle all the GPU software automatically. In reality, it's another layer of complexity that finds new and creative ways to break. I've watched it fail during installation 7 out of 10 times. Success rate on fresh clusters? Maybe 30% if you're lucky.

Pod Security Standards block everything because GPU software needs privileged access (obviously):

## The namespace needs to allow privileged containers or nothing works
kubectl create namespace gpu-operator
kubectl label namespace gpu-operator pod-security.kubernetes.io/enforce=privileged
kubectl label namespace gpu-operator pod-security.kubernetes.io/audit=privileged  
kubectl label namespace gpu-operator pod-security.kubernetes.io/warn=privileged

If you don't set these labels, the operator pods will fail to start and you'll waste 30 minutes figuring out why. Ask me how I know this.

Installation resource contention turns your nodes into swap-thrashing disasters. The operator tries to deploy everything at once, which never works well:

## Watch the installation slowly fail
kubectl get pods -n gpu-operator -w
kubectl get events -n gpu-operator --sort-by='.lastTimestamp'

## Check if your nodes are dying under the load
kubectl describe nodes | grep -A 5 -B 5 "Pressure\|Evicted"

What actually works for installation:

Step 1: Just restart the damn device plugin first: kubectl delete pods -n gpu-operator -l app=nvidia-device-plugin-daemonset

Still broken? Then:

  • Pin to a specific version that actually works: helm install gpu-operator nvidia/gpu-operator --version=v25.3.0
  • Slow down the rollout so it doesn't kill your nodes: --set driver.rollingUpdate.maxUnavailable=1
  • Actually read the prerequisites first (wild concept, I know, but it saves 2 hours)

Node Labeling and GPU Feature Discovery Problems

GPU discovery is another place things fall apart. You either get automatic labeling through NFD or you label nodes manually. Both approaches have their own special ways of breaking.

NFD configuration issues prevent automatic GPU detection. NFD must be configured to detect PCI devices and NVIDIA vendor IDs:

## Correct NFD worker configuration for GPU detection
apiVersion: v1
kind: ConfigMap
metadata:
  name: nfd-worker-conf
  namespace: node-feature-discovery
data:
  nfd-worker.conf: |
    sources:
      pci:
        deviceClassWhitelist:
          - "03"  # Display controllers (GPUs)
          - "12"  # Processing accelerators
        deviceLabelFields:
          - vendor
          - class
          - subsystem_vendor
      custom:
        - name: "nvidia-gpu"
          matchOn:
            - pciId:
                vendor: "10de"  # NVIDIA vendor ID

Manual labeling mistakes - when NFD doesn't work, you label nodes manually. Easy to fuck up, easy to forget, easy to have inconsistent labels across nodes:

## Verify GPU node labels
kubectl get nodes -o custom-columns=NAME:.metadata.name,GPU:.metadata.labels.'nvidia\.com/gpu',FAMILY:.metadata.labels.'nvidia\.com/gpu\.family'

## Add missing labels
kubectl label nodes gpu-node-1 nvidia.com/gpu=present
kubectl label nodes gpu-node-1 nvidia.com/gpu.family=tesla
kubectl label nodes gpu-node-1 accelerator=nvidia-tesla-v100

Resource Advertisement and Kubelet Integration

The kubelet must successfully register GPU resources from the device plugin. Integration failures prevent resource allocation even when GPUs are detected correctly.

Device plugin socket communication breaks when Unix domain sockets have permission issues or the kubelet can't connect:

## Check device plugin socket registration
ls -la /var/lib/kubelet/device-plugins/
## Should show nvidia.sock with proper permissions

## Verify device plugin registration in kubelet logs
kubectl logs -n kube-system kubelet-gpu-node-1 | grep -i "device plugin\|nvidia"

Resource allocation limits in kubelet configuration can block GPU registration. The kubelet must be configured to handle extended resources:

## Kubelet configuration for GPU support
apiVersion: kubelet.config.k8s.io/v1beta1
kind: KubeletConfiguration
featureGates:
  DevicePlugins: true

Actually Debugging Device Plugin Issues (Not Just Guessing)

Stop randomly changing config files. Here's the systematic debugging approach that actually works - check these in order and stop when you find the broken piece:

## 1. Is the hardware even there?
kubectl debug node/gpu-node-1 -it --image=busybox
## In debug pod: lspci | grep -i nvidia

## 2. Do the drivers work?
kubectl debug node/gpu-node-1 -it --image=nvidia/cuda:12.3-runtime-ubuntu22.04
## In debug pod: nvidia-smi

## 3. Is the device plugin running? (probably not)
kubectl get pods -n gpu-operator -l app=nvidia-device-plugin-daemonset
kubectl logs -n gpu-operator nvidia-device-plugin-daemonset-xxx

## 4. Can Kubernetes see GPUs? (spoiler: no)
kubectl describe nodes gpu-node-1 | grep -A 5 -B 5 "nvidia.com/gpu"

## 5. Nuclear option - try to run something with GPUs
kubectl run gpu-test --image=nvidia/cuda:12.3-runtime-ubuntu22.04 --restart=Never --rm -it --limits=nvidia.com/gpu=1 -- nvidia-smi

This will tell you exactly where things are broken. Don't randomly change configs - fix the specific problem you find.

Once device discovery works, you get to deal with the scheduler being unable to actually allocate the GPUs it can see. Different category of pain.

Your GPUs Are Visible But Pods Still Won't Schedule

So you fixed the device plugin and Kubernetes can finally see your GPUs. Great! Now you get to enjoy the next layer of hell where everything looks fine but pods just sit there pending forever. Welcome to GPU scheduling, where logic goes to die.

GPUs Are Special Snowflakes (Because Fuck Consistency)

GPUs don't follow normal Kubernetes resource rules because whoever designed this apparently hates developers. They're "extended resources" with completely different allocation semantics. Everyone tries to treat them like CPU cores or memory. That's how you get pods that sit pending forever.

GPU allocation rules that trip everyone up:

  • You can't request 0.5 GPUs like you can with CPU cores
  • GPU limits automatically set matching requests (because reasons)
  • If you set both limits and requests, they have to be exactly equal
  • Fractional GPUs need special time-slicing setup (good luck with that)

Here's what everyone tries first and why it breaks:

## WRONG - This will never schedule
resources:
  requests:
    nvidia.com/gpu: 1
  # Missing limits section - scheduler rejects

## WRONG - Mismatched values
resources:
  requests:
    nvidia.com/gpu: 1
  limits:
    nvidia.com/gpu: 2  # Must be equal to requests

## CORRECT - Proper GPU resource specification  
resources:
  limits:
    nvidia.com/gpu: 1    # Sets both limit and request
    memory: "8Gi"
    cpu: "4"

I've debugged this exact mistake 23 times. Last Tuesday it was a 2-hour session with my team lead breathing down my neck, ended with "just add the limits section, they have to be equal." Two fucking hours for a missing YAML block because Kubernetes throws the most useless error: "FailedScheduling: 0/3 nodes are available". No mention of the actual problem. I wanted to throw my laptop out the window.

Node Affinity Hell (When You Have Mixed GPU Types)

Your cluster has a mix of T4s, V100s, A100s, and H100s, and your workload always decides to land on the shittiest GPU available. The scheduler has no clue about GPU performance differences and will happily put your 80GB model training on a 16GB T4.

Node affinity mistakes that'll ruin your day:

No GPU targeting at all means your workload lands on whatever:

## BAD - Any GPU node, regardless of capabilities
nodeSelector:
  nvidia.com/gpu: "present"

## BETTER - Target specific GPU families
nodeSelector:
  nvidia.com/gpu.family: "ampere"      # A100, A30, etc.
  nvidia.com/gpu.compute-capability: "8.0"

## BEST - Multi-constraint selection with preferences
affinity:
  nodeAffinity:
    requiredDuringSchedulingIgnoredDuringExecution:
      nodeSelectorTerms:
      - matchExpressions:
        - key: accelerator
          operator: In
          values: ["nvidia-tesla-a100", "nvidia-tesla-h100"]
        - key: gpu-memory  
          operator: In
          values: ["40Gi", "80Gi"]
    preferredDuringSchedulingIgnoredDuringExecution:
    - weight: 100
      preference:
        matchExpressions:
        - key: nvidia.com/gpu.family
          operator: In
          values: ["hopper"]  # Prefer H100 over A100

GPU memory is never what you think it is. Your LLM needs 80GB but gets scheduled on a T4 with 16GB and dies immediately with CUDA OOM:

  • Tesla T4: 16GB (good luck running anything modern)
  • Tesla V100: 32GB
  • Tesla A100: 40GB or 80GB (the good stuff)
  • Tesla H100: 80GB (if you can afford it)

Target the right GPU memory or watch your pods get OOMKilled:

## Target high-memory GPUs for large models
affinity:
  nodeAffinity:
    requiredDuringSchedulingIgnoredDuringExecution:
      nodeSelectorTerms:
      - matchExpressions:
        - key: gpu-memory
          operator: In
          values: ["80Gi"]    # Only A100-80GB or H100
        - key: nvidia.com/gpu.compute-capability
          operator: Gt
          values: ["7.5"]     # Exclude older architectures

Multi-GPU Scheduling Is Where Things Get Interesting

Multi-GPU workloads need GPUs that can actually talk to each other efficiently. The Kubernetes scheduler has no clue about GPU topology and will happily give you GPUs connected by slow PCIe instead of fast NVLink. The NVIDIA Topology Manager and NUMA awareness are critical for distributed training performance.

Topology disasters happen when you need 4 GPUs but they're spread across nodes:

## Check GPU topology on nodes
kubectl debug node/gpu-node-1 -it --image=nvidia/cuda:12.3-runtime-ubuntu22.04
## In debug pod:
nvidia-smi topo -m
## Shows GPU interconnect topology (NVLink, PCIe)

NUMA locality issues affect performance when GPUs and memory are on different NUMA domains:

## Multi-GPU workload requiring NUMA awareness
apiVersion: v1
kind: Pod
metadata:
  name: distributed-training
spec:
  containers:
  - name: trainer
    image: nvcr.io/nvidia/pytorch:24.01-py3
    resources:
      limits:
        nvidia.com/gpu: 4      # Require 4 GPUs
        memory: "64Gi"
        cpu: "32"
        hugepages-1Gi: "16Gi"  # Use hugepages for performance
    env:
    - name: CUDA_VISIBLE_DEVICES
      value: "0,1,2,3"
    - name: NCCL_TOPO_FILE
      value: "/etc/nccl/topo.xml"  # Custom topology file
  nodeSelector:
    nvidia.com/gpu: "present"
    topology.kubernetes.io/zone: "us-west-2a"  # Single availability zone
  tolerations:
  - key: nvidia.com/gpu
    operator: Exists
    effect: NoSchedule

Gang scheduling is critical for distributed training - either all your pods get GPUs or none do. Without gang scheduling, you get partial deployments that waste expensive GPU resources while waiting for more nodes:

## Using Volcano scheduler for gang scheduling
apiVersion: scheduling.volcano.sh/v1beta1
kind: Job
metadata:
  name: distributed-gpu-training
spec:
  schedulerName: volcano
  minAvailable: 4          # All 4 pods must be scheduled together
  tasks:
  - replicas: 4
    name: worker
    template:
      spec:
        containers:
        - name: training-worker
          image: pytorch/pytorch:2.1.0-cuda12.1-cudnn8-devel
          resources:
            limits:
              nvidia.com/gpu: 2  # 8 total GPUs across 4 pods
              memory: "32Gi"

Resource Contention and Priority Scheduling

GPU clusters often have more demand than supply, requiring sophisticated priority and preemption policies. Default Kubernetes scheduling can't handle GPU resource contention effectively.

Priority class configuration for GPU workloads ensures critical jobs get resources:

## Priority classes for different GPU workload types
apiVersion: scheduling.k8s.io/v1
kind: PriorityClass
metadata:
  name: gpu-production-critical
value: 1000000
globalDefault: false
description: "Critical production GPU workloads"
---
apiVersion: scheduling.k8s.io/v1
kind: PriorityClass
metadata:
  name: gpu-training-high
value: 100000
description: "High-priority training workloads"
---
apiVersion: scheduling.k8s.io/v1
kind: PriorityClass
metadata:
  name: gpu-training-low
value: 10000
description: "Low-priority batch training"
preemptionPolicy: Never  # Cannot preempt other workloads

Preemption policies allow high-priority workloads to evict lower-priority ones, but must be configured carefully to avoid thrashing:

## High-priority workload that can preempt others
apiVersion: batch/v1
kind: Job
metadata:
  name: urgent-inference-job
spec:
  template:
    spec:
      priorityClassName: gpu-production-critical
      preemptionPolicy: PreemptLowerPriority
      containers:
      - name: inference
        image: tritonserver:latest
        resources:
          limits:
            nvidia.com/gpu: 4
            memory: "32Gi"

Taints and Tolerations for GPU Node Isolation

GPU nodes are expensive and should only run GPU workloads. Taints prevent non-GPU pods from consuming GPU node resources, but incorrect tolerations prevent GPU workloads from scheduling.

Common taint/toleration misconfigurations:

## Taint GPU nodes to exclude non-GPU workloads
kubectl taint nodes gpu-node-1 nvidia.com/gpu:NoSchedule
kubectl taint nodes gpu-node-1 nvidia.com/gpu:NoExecute  # Evict existing non-GPU pods

## Multiple taint strategies for different scenarios
kubectl taint nodes gpu-node-1 gpu-workload-only=true:NoSchedule
kubectl taint nodes gpu-node-1 accelerator=nvidia:NoSchedule

Workload tolerations must match node taints exactly:

## Correct toleration configuration
tolerations:
- key: nvidia.com/gpu
  operator: Exists      # Matches any value
  effect: NoSchedule
- key: nvidia.com/gpu  
  operator: Exists
  effect: NoExecute
- key: gpu-workload-only
  operator: Equal
  value: "true"
  effect: NoSchedule

Effect-specific toleration requirements:

  • NoSchedule: Prevents new pod scheduling
  • NoExecute: Evicts existing pods without tolerations
  • PreferNoSchedule: Soft preference, not guaranteed

Resource Allocation Debugging Workflow

When pods remain pending despite available GPUs, follow this systematic debugging approach:

## 1. Check pod scheduling events
kubectl describe pod stuck-gpu-pod
## Look for: FailedScheduling events with reasons

## 2. Verify node resource availability
kubectl describe nodes | grep -A 10 -B 5 "nvidia.com/gpu"
## Check: Allocatable vs Allocated GPU resources

## 3. Check resource requests vs availability
kubectl get pod stuck-gpu-pod -o yaml | grep -A 10 resources:
## Compare requested resources to node capacity

## 4. Verify node affinity constraints
kubectl get pod stuck-gpu-pod -o yaml | grep -A 20 affinity:
## Check if node selectors match available nodes

## 5. Check taints and tolerations
kubectl get pod stuck-gpu-pod -o yaml | grep -A 10 tolerations:
kubectl describe nodes | grep -A 5 Taints:

## 6. Check priority and preemption
kubectl get pods --all-namespaces --sort-by=.spec.priority
## Verify if higher priority pods are blocking scheduling

Common allocation failure patterns:

  1. "0/5 nodes are available: insufficient nvidia.com/gpu": Resource exhaustion or incorrect resource requests
  2. "0/5 nodes are available: node(s) had taints that the pod didn't tolerate": Missing or incorrect tolerations
  3. "0/5 nodes are available: node(s) didn't match Pod's node affinity/selector": Overly restrictive node selection
  4. Pod stays pending without events: Priority/preemption policies preventing scheduling

The systematic diagnostic approach identifies specific allocation bottlenecks, enabling targeted fixes rather than trial-and-error configuration changes.

Once you've got scheduling working, you get to deal with quotas and limits - a whole new category of ways things can break.

Resource Quotas and Time-Slicing: Where Everything Falls Apart

You've got working GPUs and proper scheduling, but now your pods won't start because of quota bullshit. GPU quotas interact with time-slicing and MIG in ways that make absolutely no sense. The resource quota system wasn't designed for shared or partitioned GPUs, so everything is janky as hell. I've burned 3 hours on this exact scenario twice in the same week.

GPU Quotas Break All the Normal Rules

GPU quotas have their own special set of rules that make absolutely no sense if you know how normal quotas work. Prepare to be confused and angry.

GPU quota requirements that make no sense:

  • Quota keys must match exact resource names: nvidia.com/gpu, amd.com/gpu, etc.
  • Both requests and limits quotas must be specified and equal (unlike CPU/memory)
  • MIG slices need separate quota entries
  • Time-sliced GPU resources require quota multiplication
  • PVCs for model storage consume additional quota you forgot about
## GPU quota config - this took me 4 tries to get right
## Pro tip: requests and limits MUST be equal for GPUs (learned the hard way)
apiVersion: v1
kind: ResourceQuota
metadata:
  name: gpu-quota
  namespace: ml-team
spec:
  hard:
    requests.nvidia.com/gpu: "8"
    limits.nvidia.com/gpu: "8"      # Has to match requests exactly
    
    # MIG quotas if you're using A100 partitioning
    requests.nvidia.com/mig-1g.5gb: "16"
    limits.nvidia.com/mig-1g.5gb: "16"
    
    # Memory is critical - GPU workloads eat RAM  
    requests.memory: "256Gi"         # Set this high or pods will fail
    requests.cpu: "128"              # Data preprocessing needs CPU
    persistentvolumeclaims: "20"     # Model storage adds up fast

Common quota configuration mistakes:

Mismatched requests/limits quotas cause allocation failures even with available resources:

## Check quota status and usage
kubectl describe resourcequota team-gpu-quota -n ml-training
## Look for: Used/Hard ratios and any quota exceeded warnings

## Debug quota mismatches
kubectl get events -n ml-training | grep "quota\|resource"
## Common error: "exceeded quota: team-gpu-quota, requested: limits.nvidia.com/gpu=2, used: limits.nvidia.com/gpu=6, limited: limits.nvidia.com/gpu=8"

Missing quota for time-sliced resources prevents scheduling when time-slicing is enabled:

## Time-slicing configuration creates virtual GPU resources
apiVersion: v1
kind: ConfigMap
metadata:
  name: time-slicing-config
  namespace: gpu-operator
data:
  tesla-v100: |-
    version: v1
    sharing:
      timeSlicing:
        resources:
        - name: nvidia.com/gpu
          replicas: 4  # Each physical GPU becomes 4 virtual GPUs

With 4-way time-slicing, each physical GPU can run 4 containers. Quotas must account for this multiplication:

## Quota for time-sliced GPUs
spec:
  hard:
    requests.nvidia.com/gpu: "32"  # 8 physical GPUs × 4 replicas = 32 virtual GPUs
    limits.nvidia.com/gpu: "32"

LimitRange Configuration for GPU Workloads

LimitRanges enforce resource limits at the pod and container level, but GPU-specific constraints require careful configuration to avoid blocking legitimate workloads.

GPU-aware LimitRange configuration:

apiVersion: v1
kind: LimitRange
metadata:
  name: gpu-limits
  namespace: ml-training
spec:
  limits:
  # Container-level limits
  - type: Container
    default:
      nvidia.com/gpu: "1"      # Default 1 GPU per container
      memory: "16Gi"           # High default memory for GPU workloads
      cpu: "8"
    defaultRequest:
      nvidia.com/gpu: "1"      # Must match default for GPUs
      memory: "8Gi"
      cpu: "4"
    max:
      nvidia.com/gpu: "8"      # Maximum GPUs per container
      memory: "128Gi"
      cpu: "64"
    min:
      nvidia.com/gpu: "1"      # Minimum 1 GPU (no fractional without time-slicing)
      memory: "4Gi"
      cpu: "2"
      
  # Pod-level limits (sum of all containers)
  - type: Pod
    max:
      nvidia.com/gpu: "8"      # Maximum GPUs per pod
      memory: "256Gi"
      cpu: "128"
    min:
      nvidia.com/gpu: "1"
      memory: "4Gi"
      cpu: "2"
      
  # PVC limits for model storage
  - type: PersistentVolumeClaim
    max:
      storage: "1Ti"           # Large model storage requirements
    min:
      storage: "10Gi"

LimitRange troubleshooting for GPU allocation failures:

## Check LimitRange enforcement
kubectl describe limitrange gpu-limits -n ml-training

## Debug LimitRange violations
kubectl get events -n ml-training | grep "LimitRange"
## Common: "Pod exceeds LimitRange" or "Container exceeds LimitRange"

## Check applied defaults and limits
kubectl get pod gpu-workload -n ml-training -o yaml | grep -A 20 resources:
## Verify defaults were applied correctly

Time-Slicing Configuration and Virtual GPU Management

GPU time-slicing allows multiple containers to share single GPUs through temporal multiplexing. Configuration errors in time-slicing setup cause allocation failures and resource conflicts.

Time-slicing ConfigMap troubleshooting:

## Check current time-slicing configuration
kubectl get configmap -n gpu-operator | grep time-slicing
kubectl describe configmap time-slicing-config -n gpu-operator

## Verify device plugin is using time-slicing config
kubectl describe clusterpolicy cluster-policy -n gpu-operator | grep -A 5 "devicePlugin:"
## Should show: config.name: time-slicing-config

## Check device plugin logs for time-slicing errors
kubectl logs -n gpu-operator -l app=nvidia-device-plugin-daemonset | grep -i "time.slicing\|sharing\|replica"

Node-specific time-slicing configuration for heterogeneous GPU clusters:

## Different time-slicing ratios per GPU type
apiVersion: v1
kind: ConfigMap
metadata:
  name: fine-grained-time-slicing
  namespace: gpu-operator
data:
  # High-end GPUs get more replicas
  tesla-a100: |-
    version: v1
    sharing:
      timeSlicing:
        resources:
        - name: nvidia.com/gpu
          replicas: 8    # 8-way sharing for A100
  
  # Lower-end GPUs get fewer replicas  
  tesla-t4: |-
    version: v1
    sharing:
      timeSlicing:
        resources:
        - name: nvidia.com/gpu
          replicas: 2    # 2-way sharing for T4
  
  # Inference-only nodes
  inference-optimized: |-
    version: v1
    sharing:
      timeSlicing:
        resources:
        - name: nvidia.com/gpu
          replicas: 16   # High sharing for inference workloads

Apply node-specific configurations using labels:

## Label nodes for specific time-slicing configurations
kubectl label nodes gpu-node-1 nvidia.com/device-plugin.config=tesla-a100
kubectl label nodes gpu-node-2 nvidia.com/device-plugin.config=tesla-t4
kubectl label nodes inference-node-1 nvidia.com/device-plugin.config=inference-optimized

## Verify configuration application
kubectl get nodes -o custom-columns=NAME:.metadata.name,CONFIG:.metadata.labels.'nvidia\.com/device-plugin\.config'

Multi-Instance GPU (MIG) Resource Management

MIG technology partitions A100 and H100 GPUs into isolated instances with dedicated memory and compute. MIG configuration adds complexity to resource allocation and quota management.

MIG profile configuration and common issues:

## MIG ConfigMap for different partitioning strategies
apiVersion: v1
kind: ConfigMap
metadata:
  name: mig-strategy
  namespace: gpu-operator
data:
  # Mixed workload strategy
  mixed-partition: |-
    version: v1
    mig-configs:
      mixed-workloads:
        - devices: [0]
          mig-enabled: true
          mig-devices:
            1g.5gb: 2    # 2 small instances for inference
            3g.20gb: 1   # 1 medium instance for training
            7g.40gb: 1   # 1 large instance for large models
  
  # Training-optimized strategy
  training-optimized: |-
    version: v1
    mig-configs:
      training-focused:
        - devices: [0]
          mig-enabled: true
          mig-devices:
            3g.20gb: 3   # 3 medium instances for parallel training

MIG resource allocation debugging:

## Check MIG configuration status
kubectl get configmap mig-strategy -n gpu-operator -o yaml

## Verify MIG manager deployment
kubectl get pods -n gpu-operator -l app=nvidia-mig-manager
kubectl logs -n gpu-operator nvidia-mig-manager-xxx

## Check MIG resource advertisement
kubectl describe nodes | grep -A 10 "nvidia.com/mig-"
## Should show: nvidia.com/mig-1g.5gb, nvidia.com/mig-3g.20gb, etc.

## Test MIG slice allocation
kubectl run mig-test --image=nvidia/cuda:12.3-runtime-ubuntu22.04 --restart=Never --rm -it \
  --limits=nvidia.com/mig-1g.5gb=1 -- nvidia-smi

Cross-Namespace Resource Conflicts and Priority

GPU resources are node-level, so allocation conflicts can occur across namespaces even with proper quotas. Priority scheduling and resource preemption become critical for multi-tenant GPU clusters.

Cluster-level resource management:

## Cluster-wide resource allocation policies
apiVersion: v1
kind: LimitRange
metadata:
  name: cluster-gpu-limits
  namespace: kube-system  # Applied cluster-wide
spec:
  limits:
  - type: Container
    max:
      nvidia.com/gpu: "16"    # Absolute maximum per container
  - type: Pod  
    max:
      nvidia.com/gpu: "16"    # Absolute maximum per pod

Priority-based resource allocation:

## Production workloads get highest priority
apiVersion: scheduling.k8s.io/v1
kind: PriorityClass
metadata:
  name: gpu-production
value: 1000000
description: "Production GPU workloads - highest priority"
---
## Training workloads get medium priority
apiVersion: scheduling.k8s.io/v1
kind: PriorityClass  
metadata:
  name: gpu-training
value: 500000
description: "Training GPU workloads - medium priority"
---
## Development workloads get lowest priority
apiVersion: scheduling.k8s.io/v1
kind: PriorityClass
metadata:
  name: gpu-development
value: 100000
description: "Development GPU workloads - lowest priority"
preemptionPolicy: Never  # Cannot preempt other workloads

Resource Allocation Monitoring and Alerting

Effective GPU resource management requires monitoring quota usage, allocation patterns, and resource contention across the cluster.

Essential GPU resource metrics:

## Check cluster-wide GPU utilization
kubectl get nodes -o json | jq -r '.items[] | {
  name: .metadata.name,
  allocatable: .status.allocatable["nvidia.com/gpu"],
  allocated: (.status.allocatable["nvidia.com/gpu"] | tonumber) - (.status.capacity["nvidia.com/gpu"] | tonumber)
}'

## Monitor namespace quota usage
kubectl get resourcequota --all-namespaces -o custom-columns=\
NAMESPACE:.metadata.namespace,\
NAME:.metadata.name,\
GPU-USED:.status.used.'limits\.nvidia\.com/gpu',\
GPU-HARD:.status.hard.'limits\.nvidia\.com/gpu'

## Check pending pods due to resource constraints
kubectl get pods --all-namespaces --field-selector=status.phase=Pending \
  -o custom-columns=NAMESPACE:.metadata.namespace,NAME:.metadata.name,REASON:.status.conditions[0].reason

GPU resource alerting configuration:

## Prometheus alerts for GPU resource issues
groups:
- name: gpu-resource-alerts
  rules:
  - alert: GPUQuotaExceeded
    expr: (kube_resourcequota{resource="limits.nvidia.com/gpu", type="used"} / kube_resourcequota{resource="limits.nvidia.com/gpu", type="hard"}) > 0.9
    for: 5m
    labels:
      severity: warning
    annotations:
      summary: "GPU quota usage high in namespace {{ $labels.namespace }}"
      description: "GPU quota in namespace {{ $labels.namespace }} is {{ $value | humanizePercentage }} used"
      
  - alert: GPUResourceExhaustion
    expr: (sum(kube_node_status_allocatable{resource="nvidia_com_gpu"}) - sum(kube_pod_container_resource_requests{resource="nvidia_com_gpu"})) == 0
    for: 2m
    labels:
      severity: critical
    annotations:
      summary: "Cluster GPU resources exhausted"
      description: "No available GPU resources in the cluster for new workloads"

Get your resource quotas and limits right, or watch teams fight over GPUs while your cluster falls apart. Next up: practical troubleshooting workflows for when GPU allocation inevitably breaks.

Frequently Asked Questions: GPU Allocation Troubleshooting

Q

Why do my pods show "0/N nodes available: insufficient nvidia.com/gpu" when nvidia-smi shows available GPUs?

A

nvidia-smi shows 8 GPUs but Kubernetes thinks there are zero? Your device plugin is fucked. This is the #1 GPU allocation problem - hardware works fine but the device plugin crashed or never started. I debug this exact error every Tuesday morning when someone breaks production over the weekend.

Diagnostic steps:

## Check device plugin status
kubectl get pods -n gpu-operator -l app=nvidia-device-plugin-daemonset
kubectl logs -n gpu-operator nvidia-device-plugin-daemonset-xxx

## Verify resource advertisement  
kubectl describe nodes | grep -A 5 -B 5 "nvidia.com/gpu"
## Should show: nvidia.com/gpu: N (allocatable and capacity)

Common causes:

  • Device plugin crashed or failed to start (check logs for CUDA version mismatches)
  • Kubelet cannot connect to device plugin socket (permission issues)
  • NVIDIA Container Runtime not properly configured
  • Node taints preventing device plugin scheduling

Quick fix (that usually works): Just restart the damn device plugin: kubectl delete pods -n gpu-operator -l app=nvidia-device-plugin-daemonset - I do this at least once a week.

Real incident: Last week around 2:30am, got paged because all ML training stopped. Turns out the device plugin crashed 6 hours earlier when someone deployed a new GPU operator version without checking compatibility. 6 hours of $200/hour GPU time wasted because nobody noticed the device plugin had exit code 139 (segfault). One pod restart fixed everything.

Q

How do I fix "Failed to allocate device" errors in GPU pods?

A

Your pods can see the GPUs exist but can't actually use them - usually runtime config is broken or containers don't have permission to access GPU devices. This one cost me 3 hours last month with the exact error: "could not start container: Error response from daemon: failed to create shim: OCI runtime create failed: container_linux.go:380: starting container process caused: process_linux.go:545: container init caused: Running hook #0:: error running hook: exit status 1, stdout: , stderr: nvidia-container-cli: initialization error".

Check container runtime configuration:

## Verify NVIDIA runtime class exists
kubectl get runtimeclass nvidia

## Check node container runtime
kubectl get nodes -o json | jq '.items[] | {name: .metadata.name, runtime: .status.nodeInfo.containerRuntimeVersion}'

## Test GPU access directly
kubectl run gpu-test --image=nvidia/cuda:12.3-runtime-ubuntu22.04 --restart=Never --rm -it \
  --limits=nvidia.com/gpu=1 -- nvidia-smi

Common solutions:

  • Install NVIDIA Container Toolkit: Installation Guide
  • Configure container runtime to use NVIDIA runtime
  • Verify /dev/nvidia* devices have correct permissions
  • Check if SELinux/AppArmor policies block GPU access
Q

Why don't my GPU resource quotas work correctly?

A

GPU resource quotas have different semantics than CPU/memory quotas. They must be configured specifically for extended resources and account for vendor-specific resource names. I spent 2 hours debugging "admission webhook denied the request: exceeded quota" only to find someone set requests.nvidia.com/gpu: "4" but forgot limits.nvidia.com/gpu: "4". GPU quotas require both to be identical, unlike CPU/memory.

Verify quota configuration:

## Check quota status
kubectl describe resourcequota -n your-namespace
## Look for: limits.nvidia.com/gpu and requests.nvidia.com/gpu entries

## Debug quota violations
kubectl get events -n your-namespace | grep quota

Requirements for GPU quotas:

  • Both requests.nvidia.com/gpu and limits.nvidia.com/gpu must be specified
  • Values must be equal (GPUs don't support fractional requests)
  • Use exact resource names including vendor prefix
  • Account for time-slicing multiplication in quota values

Example working quota:

spec:
  hard:
    requests.nvidia.com/gpu: "4"
    limits.nvidia.com/gpu: "4"    # Must match requests
    requests.memory: "64Gi"
    limits.memory: "64Gi"
Q

How do I troubleshoot time-slicing GPU allocation issues?

A

Time-slicing creates virtual GPU resources that can confuse resource allocation. The device plugin must be properly configured and quotas must account for replica multiplication.

Check time-slicing configuration:

## Verify time-slicing ConfigMap exists
kubectl get configmap -n gpu-operator | grep time-slicing

## Check device plugin is using time-slicing
kubectl describe clusterpolicy cluster-policy -n gpu-operator | grep devicePlugin

## Verify virtual GPU advertisement
kubectl describe nodes | grep nvidia.com/gpu
## Should show replicas × physical GPUs

Common time-slicing problems:

  • ConfigMap not applied to device plugin (check ClusterPolicy configuration)
  • Quotas don't account for replica multiplication
  • Node labels missing for node-specific configurations
  • Time-slicing conflicts with MIG configurations

Time-slicing troubleshooting command:

kubectl logs -n gpu-operator -l app=nvidia-device-plugin-daemonset | grep -i "time.slicing\|sharing\|replica"
Q

Why do multi-GPU pods fail to schedule even with available GPUs?

A

Multi-GPU allocation requires all requested GPUs to be available on a single node. The scheduler cannot split GPU requests across multiple nodes. Just last week I had a 4-GPU pod stuck pending forever because we had 8 total GPUs but only 2 per node. The error "0/4 nodes are available: insufficient nvidia.com/gpu" was technically correct but useless - it should have said "no single node has 4 GPUs available".

Check multi-GPU scheduling constraints:

## Verify GPU availability per node
kubectl get nodes -o custom-columns=NAME:.metadata.name,GPU:.status.allocatable.'nvidia\.com/gpu'

## Check if any single node has enough GPUs
kubectl describe nodes | grep -A 10 -B 5 "nvidia.com/gpu"

Multi-GPU allocation requirements:

  • All GPUs must be on the same node (cannot span nodes)
  • Node must have enough allocatable GPUs (not just capacity)
  • Topology constraints for NUMA/interconnect awareness
  • Gang scheduling for distributed workloads

Solutions:

  • Use node affinity to target multi-GPU nodes
  • Implement gang scheduling for coordinated allocation
  • Consider GPU partitioning (MIG) for smaller requirements
  • Add more multi-GPU nodes to cluster
Q

How do I debug MIG resource allocation failures?

A

MIG (Multi-Instance GPU) partitioning creates separate GPU instances with isolated memory. MIG configuration errors prevent proper resource advertisement and allocation.

Check MIG configuration status:

## Verify MIG manager deployment
kubectl get pods -n gpu-operator -l app=nvidia-mig-manager
kubectl logs -n gpu-operator nvidia-mig-manager-xxx

## Check MIG resource advertisement
kubectl describe nodes | grep "nvidia.com/mig-"
## Should show: nvidia.com/mig-1g.5gb, nvidia.com/mig-3g.20gb, etc.

## Test MIG instance access
kubectl run mig-test --image=nvidia/cuda:12.3-runtime-ubuntu22.04 --restart=Never --rm -it \
  --limits=nvidia.com/mig-1g.5gb=1 -- nvidia-smi -L

Common MIG issues:

  • GPU doesn't support MIG (only A100 and H100)
  • MIG mode not enabled on GPU hardware
  • ConfigMap profiles don't match desired partitioning
  • Resource quotas missing MIG slice entries

MIG troubleshooting workflow:

  1. Verify GPU supports MIG: nvidia-smi -q | grep MIG
  2. Check MIG mode: nvidia-smi --query-gpu=mig.mode.current --format=csv
  3. Validate MIG configuration: kubectl describe configmap mig-config -n gpu-operator
Q

Why do GPU workloads get scheduled on CPU-only nodes?

A

Incorrect or missing node affinity and toleration configuration allows GPU workloads to be scheduled on nodes without GPUs, causing runtime failures.

Add proper GPU node targeting:

spec:
  nodeSelector:
    nvidia.com/gpu: present     # Require GPU presence
  tolerations:
  - key: nvidia.com/gpu        # Tolerate GPU node taints
    operator: Exists
    effect: NoSchedule

Verify node labeling:

## Check which nodes have GPU labels
kubectl get nodes --show-labels | grep nvidia.com/gpu

## Verify GPU node taints
kubectl describe nodes | grep Taints

Prevention strategies:

  • Always use nvidia.com/gpu: present node selector
  • Implement proper tolerations for GPU node taints
  • Use node affinity for specific GPU types
  • Consider admission controllers to enforce GPU node targeting
Q

How do I resolve "ResourceQuota exceeded" errors for GPU resources?

A

GPU resource quota violations can occur due to quota misconfiguration, accumulated resource usage, or time-slicing multiplier mismatches.

Debug quota usage:

## Check current quota usage
kubectl describe resourcequota -n your-namespace
## Compare Used vs Hard values

## List all GPU pods in namespace
kubectl get pods -n your-namespace -o custom-columns=NAME:.metadata.name,GPU:.spec.containers[*].resources.limits.'nvidia\.com/gpu'

## Check for stuck terminating pods
kubectl get pods -n your-namespace | grep Terminating

Common quota resolution steps:

  1. Increase quota limits if legitimate usage exceeds current limits
  2. Clean up stuck pods that hold quota allocations: kubectl delete pod stuck-pod --force --grace-period=0
  3. Fix quota configuration for time-slicing: multiply physical GPUs by replica count
  4. Check for zombie resource usage from failed deployments

Example quota adjustment for time-slicing:

## If you have 4 physical GPUs with 4-way time-slicing
spec:
  hard:
    requests.nvidia.com/gpu: "16"    # 4 × 4 = 16 virtual GPUs
    limits.nvidia.com/gpu: "16"
Q

What causes "Node didn't have enough resource" scheduling failures?

A

Resource exhaustion errors occur when nodes lack sufficient GPU, memory, or CPU resources to satisfy pod requests, even when GPUs appear available.

Check resource availability:

## Verify node resource capacity vs allocation
kubectl describe nodes gpu-node-1 | grep -A 20 "Allocated resources"

## Check pod resource requests
kubectl describe pod stuck-pod | grep -A 10 "Requests:"

Common resource bottlenecks:

  • Memory exhaustion: GPU workloads need high memory ratios
  • CPU constraints: Data preprocessing requires substantial CPU
  • Ephemeral storage: Model files exceed node storage capacity
  • Extended resources: Missing quotas for vendor-specific resources

Resource balancing solutions:

  • Increase memory allocations on GPU nodes
  • Add more CPU cores for GPU workload support
  • Provision high-capacity storage for model assets
  • Balance resource requests with actual workload requirements
Q

How do I fix device plugin CrashLoopBackOff errors?

A

Device plugin crashes prevent GPU resource advertisement and allocation. Most crashes result from configuration mismatches or permission issues.

Analyze crash causes:

## Check device plugin logs
kubectl logs -n gpu-operator nvidia-device-plugin-daemonset-xxx --previous

## Look for common error patterns
kubectl logs -n gpu-operator nvidia-device-plugin-daemonset-xxx | grep -i "error\|fatal\|panic"

Common crash causes and fixes:

  • CUDA version mismatch: Downgrade device plugin or upgrade node drivers
  • Missing permissions: Verify privileged security context and device access
  • Runtime configuration: Check NVIDIA Container Runtime installation
  • Resource conflicts: Only one device plugin per node, don't double-deploy

Recovery steps:

  1. Check prerequisites: Verify NVIDIA drivers and runtime installation
  2. Validate configuration: Make sure ClusterPolicy matches your cluster setup
  3. Reset device plugin: kubectl delete pods -n gpu-operator -l app=nvidia-device-plugin-daemonset
  4. Monitor startup: kubectl logs -n gpu-operator nvidia-device-plugin-daemonset-xxx -f

Real Talk: What Actually Works When GPU Allocation Breaks

Problem/Scenario

First Action

Typical Fix

Time Estimate

Effectiveness

Device plugin crashed again? (happens every fucking Tuesday)

First thing: kubectl get pods -n gpu-operator -l app=nvidia-device-plugin-daemonset

9 times out of 10, just delete the pod and it comes back fine

Takes like 5 minutes unless you have some weird CUDA version fuckup

This fixes most "no GPUs available" problems

Pods stuck pending forever? (classic scheduler bullshit)

Start with kubectl describe pod stuck-pod

  • look for the actual error

Usually missing tolerations or your node affinity is wrong

Can take 30 minutes if you have complex affinity rules

Usually works once you find the real problem

Resource quota bullshit? (easiest to fix)

kubectl describe resourcequota -n namespace shows exactly what's wrong

Usually someone set limits.nvidia.com/gpu but not requests.nvidia.com/gpu

5-minute fix

works most of the time. GPU quotas are simple once you know the stupid rules

Driver/runtime totally fucked? (the nuclear option)

kubectl debug node/gpu-node --image=nvidia/cuda:12.3-runtime-ubuntu22.04

This is when hardware or drivers are actually broken

Can take 2 hours if you need to reinstall CUDA drivers

Only fixes some problems because hardware is cursed

Time-slicing not working? (why did you enable this)

Check kubectl logs -n gpu-operator nvidia-device-plugin-xxx | grep sharing

Usually the ConfigMap isn't applied right

30 minutes of YAML debugging

Usually works, rest needs operator restart

MIG slices invisible? (A100 specific hell)

kubectl describe nodes | grep nvidia.com/mig- to see what's advertised

MIG manager probably crashed or config is wrong

45 minutes minimum, sometimes needs reboot

Sometimes works, MIG is finicky as hell

Essential Resources for Kubernetes GPU Allocation Troubleshooting