I've deployed Tabby for three different companies over the past year or so. One was a mid-size fintech with strict compliance requirements, one was a defense contractor that couldn't send code to the cloud, and one was a healthcare startup that needed HIPAA compliance. Here's what actually happens when you try to run this thing in production.
Hardware Requirements That Actually Work
The official docs say you need "8GB GPU memory minimum." That's bullshit. Here's what you actually need based on painful experience:
For 7B models (CodeLlama-7B, DeepSeek-Coder-7B):
- GPU: RTX 4070 Ti or better (around 16GB VRAM minimum, not the 8GB they claim)
- RAM: 32GB system RAM, not 16GB - the model weights plus OS overhead eat memory
- CPU: 8 cores minimum for indexing large codebases without timing out
- Storage: NVMe SSD with 500GB+ free space for model files and git repo caches
For 1B models (StarCoder-1B):
- GPU: RTX 3060 with 12GB VRAM works fine
- RAM: 16GB system RAM is actually sufficient here
- The suggestions are mediocre but it won't crash every few hours

I learned the hard way that running a 7B model on an RTX 3070 (8GB VRAM) crashes with CUDA out of memory errors every couple hours. The Docker container just dies, takes your IDE completions with it, and your developers start filing tickets about "the AI being down again."
This is why proper GPU monitoring is essential, along with understanding CUDA memory management and Docker resource limits. Many teams underestimate the importance of proper cooling and power delivery for production GPU workloads.
The Kubernetes Deployment Hell
The official Kubernetes deployment looks simple until you actually try it. Here's what the YAML doesn't tell you:
Resource limits are too low. The default config requests 4GB RAM and 2 CPU cores. That's enough to start the container, not enough to actually serve completions under load. Bump it to 16GB RAM minimum, 8 CPU cores, or watch it get OOMKilled during peak hours.
resources:
  requests:
    memory: "16Gi"  # Not 4Gi
    cpu: "8"        # Not 2
    nvidia.com/gpu: 1
  limits:
    memory: "24Gi"  # Leave headroom
    cpu: "12"
    nvidia.com/gpu: 1
Persistent volumes need way more space. They allocate 20GB for model storage. A 7B model is 14GB compressed, but Tabby downloads multiple models, keeps git repo caches, stores indexed code, and logs everything. I hit the 20GB limit within a week. Use 100GB minimum.
The ingress configuration assumes you're running vanilla nginx. If you're using Istio, Traefik, or any other service mesh, you'll need custom annotations for WebSocket support (the chat interface needs this) and longer timeouts for model loading.
Authentication Nightmares
Enterprise means SSO integration. Tabby supports LDAP as of v0.24.0, but the setup is painful.
LDAP binding fails with cryptic errors. The logs just say "authentication failed" without telling you if it's a connection issue, wrong DN, or certificate problem. Enable debug logging (RUST_LOG=debug) to see what's actually happening.
Group membership doesn't work like you think. If your LDAP uses nested groups (most enterprises do), Tabby won't find users who are in subgroups. You need to configure the search filter manually, and it's different for Active Directory vs OpenLDAP.
Certificate validation breaks in Docker. If your LDAP server uses internal Certs, mount your CA bundle into the container at /etc/ssl/certs/ or LDAPS connections will fail with SSL errors.
Enterprise LDAP integration often requires custom certificate authorities, DNS configuration, and network policies. Consider HashiCorp Vault for secret management, and implement RBAC policies for proper access control. Many organizations also need audit logging for compliance requirements.
Memory Leaks That Kill Production
The biggest operational issue: Tabby leaks memory over time. Not badly, but enough to matter in production.
Indexing jobs don't clean up. When Tabby indexes your git repos (it re-indexes every few hours to stay current), the memory usage spikes and doesn't fully return to baseline. After a week of normal operation, I've seen containers using 28GB when they started with 8GB.
The fix is ugly but works: Set up a cron job to restart the Tabby pods every 24 hours during low usage periods (like middle of the night). Kubernetes rolling restarts work fine - your developers won't notice a 30-second interruption when they're not working, but they will notice when the whole thing crashes during standup because it ran out of memory.
Network and Proxy Hell
Most enterprises have complex network setups. Tabby needs to make outbound HTTP requests to download models from HuggingFace, but many corporate networks block this.
Model pre-loading for air-gapped environments. Download models on a machine with internet access, then transfer them:
## On internet-connected machine
docker run -v $(pwd)/models:/data tabbyml/tabby download --model CodeLlama-7B-Instruct

## Transfer the ./models directory to your production environment
## Then run with --model /data/CodeLlama-7B-Instruct
Proxy configuration is inconsistent. Set these environment variables if you're behind a corporate proxy:
HTTP_PROXY=http://proxy.company.com:8080
HTTPS_PROXY=http://proxy.company.com:8080
NO_PROXY=localhost,127.0.0.1,.company.com
But even with correct proxy settings, HuggingFace model downloads sometimes hang. The Docker healthcheck doesn't catch this - the container stays "healthy" while model loading is stuck. You need custom monitoring to detect when model loading takes longer than 10 minutes.
Monitoring and Alerting That Actually Helps
The built-in health endpoints (/health) are useless. They return 200 OK even when model loading is stuck or memory usage is through the roof.
Custom monitoring endpoints I've built:
- Memory usage over time (catch the leaks before they kill the container)
- Model loading status and duration
- Active completion requests (queue up during model loading)
- Git repository sync status (indexing can get stuck on large repos)
Prometheus metrics that matter:
tabby_memory_usage_bytes- Track the memory leaktabby_model_load_duration_seconds- Catch stuck downloadstabby_completion_requests_total- Usage patternstabby_git_sync_last_success_timestamp- Indexing health
The Shit That Actually Breaks in Production
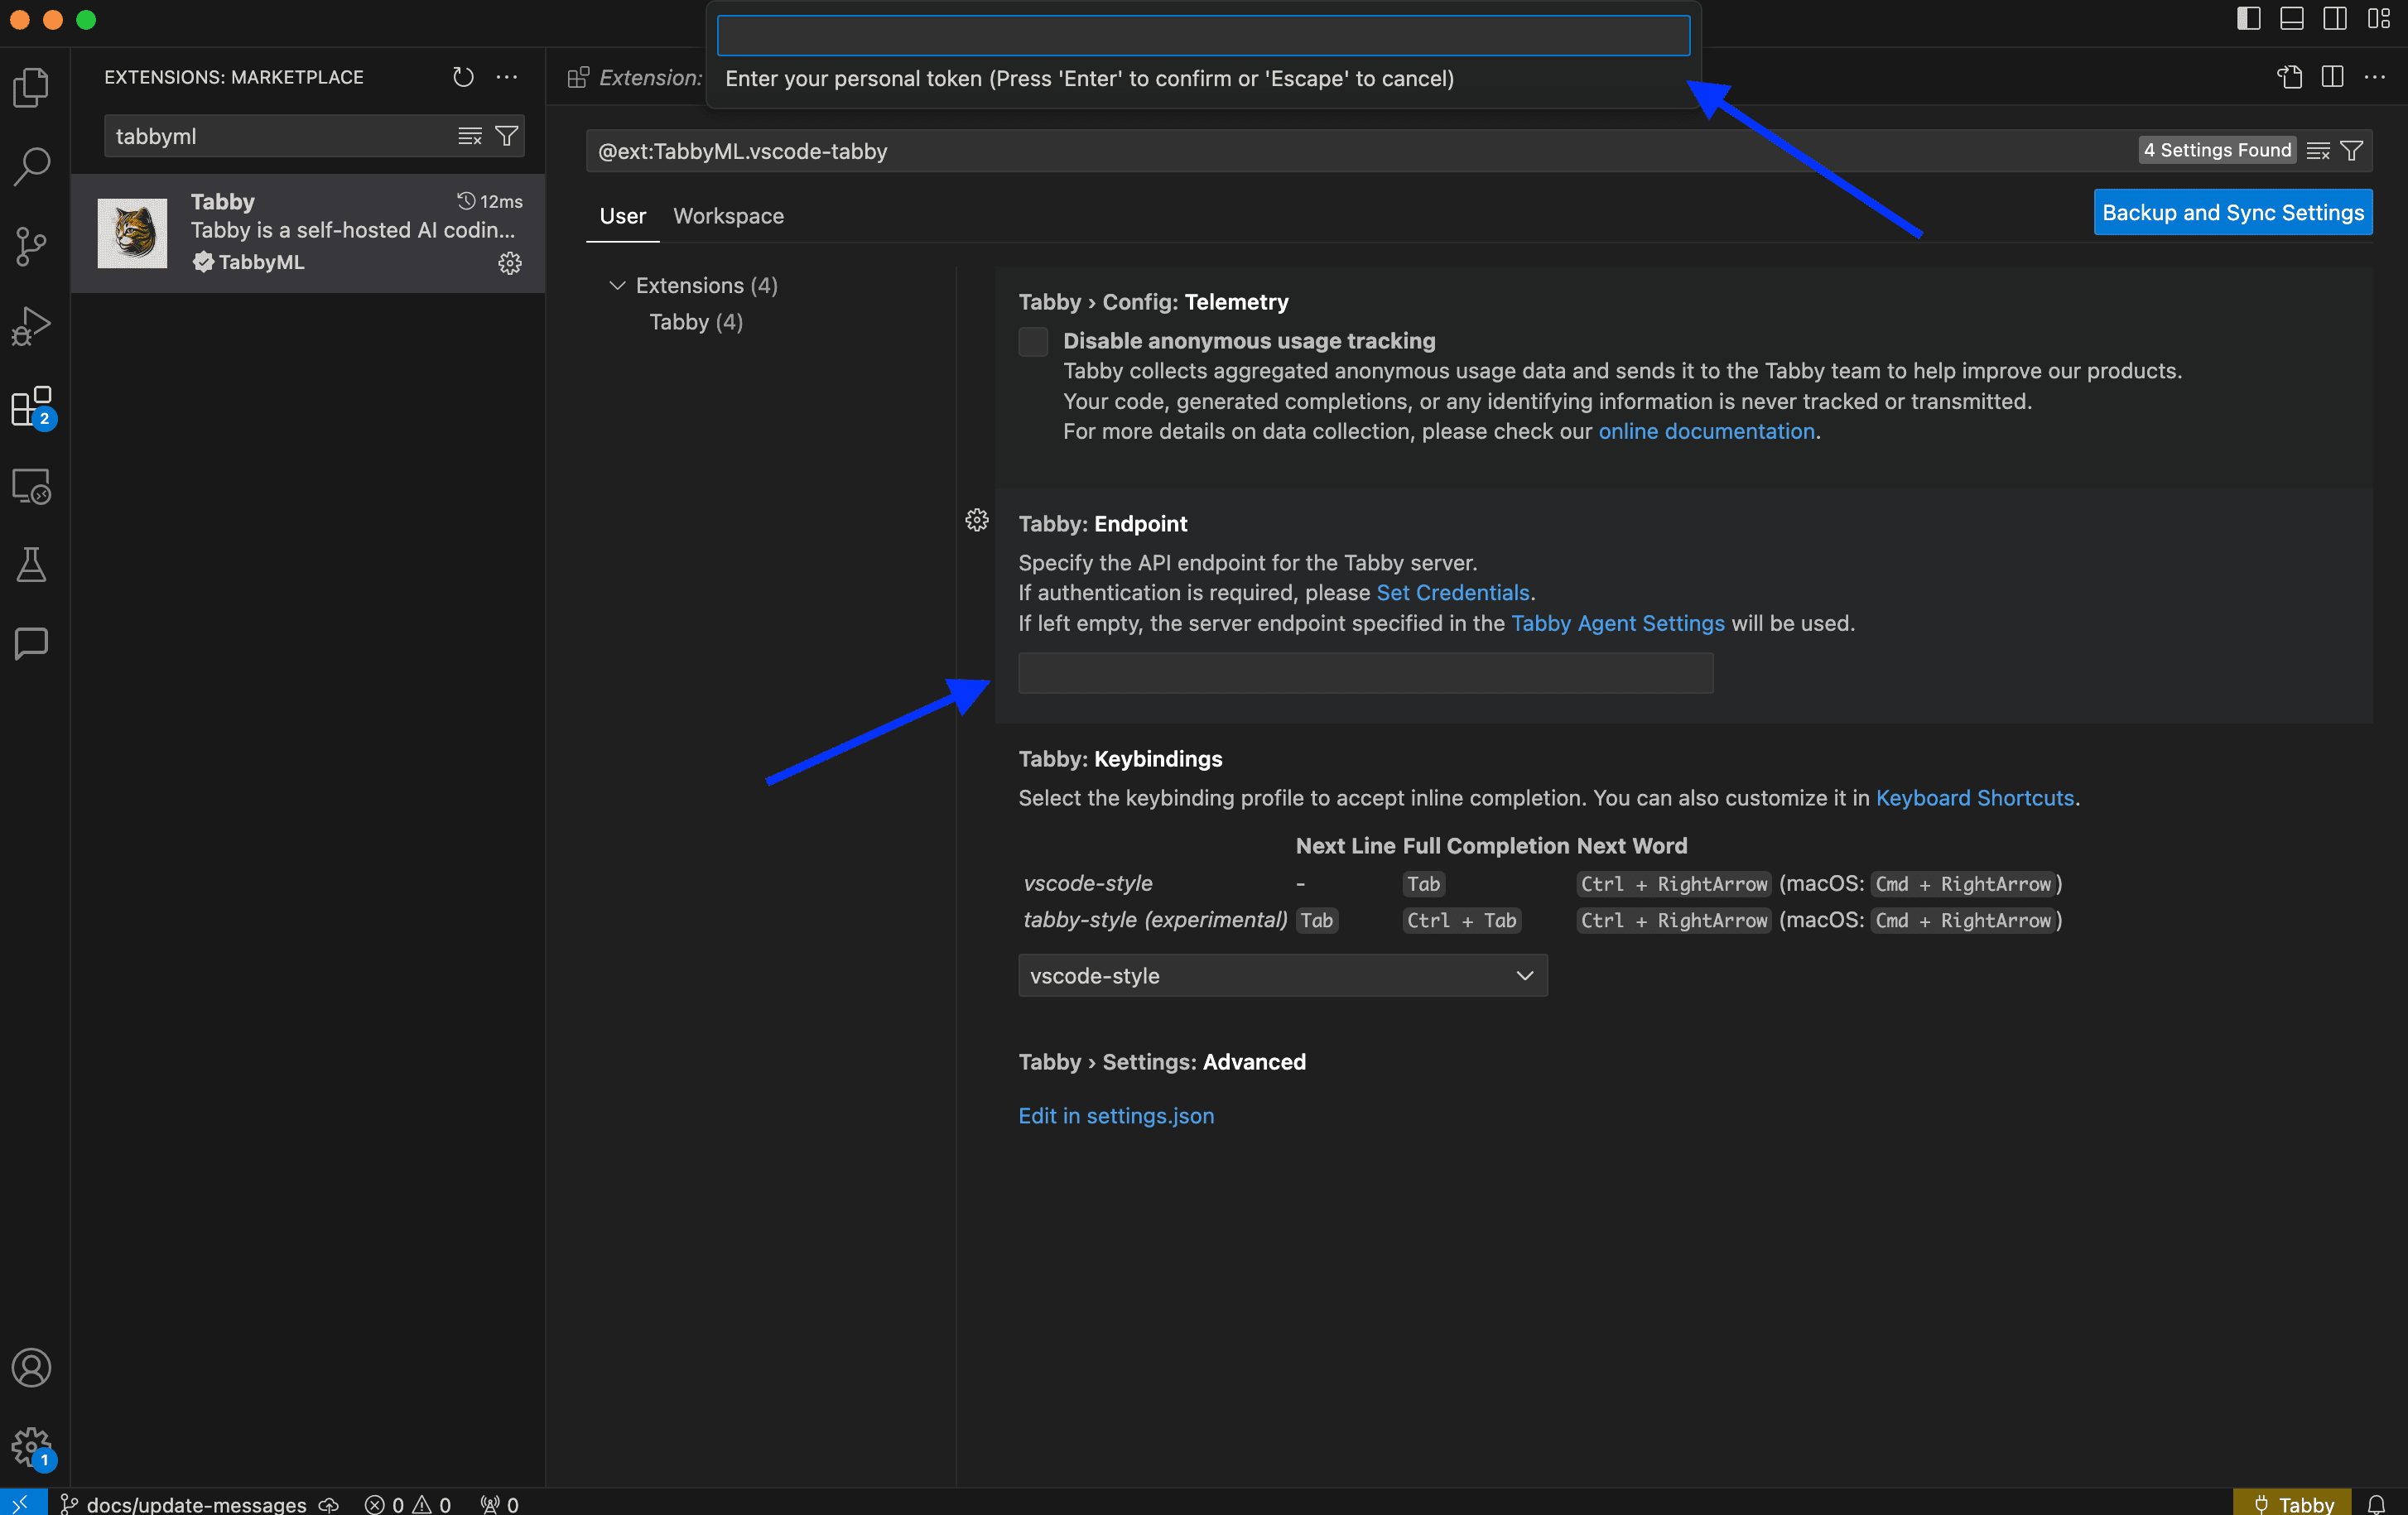
IDE extensions randomly stop working. The VS Code extension loses connection to the Tabby server and shows "Not connected" in the status bar. Restarting VS Code fixes it, but your developers shouldn't need to restart their IDE twice a day.
This happens when the Tabby server is restarted (normal maintenance) but the extension doesn't retry the connection properly. Enable auto-reconnect in the extension settings, but it's not foolproof.
Git repository indexing gets stuck on large repos. If you have a monorepo with 500k+ lines of code, the initial indexing takes hours and sometimes times out. The container stays running but completions are garbage because it doesn't have code context.
Split large repos into multiple smaller indexes, or increase the indexing timeout to 4+ hours for the initial run. Subsequent incremental updates are much faster.
CUDA version mismatches crash silently. Your container starts fine, loads the model, then crashes with cryptic CUDA errors when someone requests a completion. This happens when your Kubernetes nodes have different NVIDIA driver versions.
Use nvidia-smi to check driver compatibility, and pin your Tabby deployment to nodes with consistent GPU drivers. NodeSelectors work for this:
nodeSelector:
  nvidia.com/gpu.driver-version: "535.86.10"
The hardest lesson learned: enterprise deployment isn't about getting it working once, it's about keeping it working when real developers use it for real work. The next section covers the specific production issues you'll hit and how to actually fix them.