The Setup Reality Check

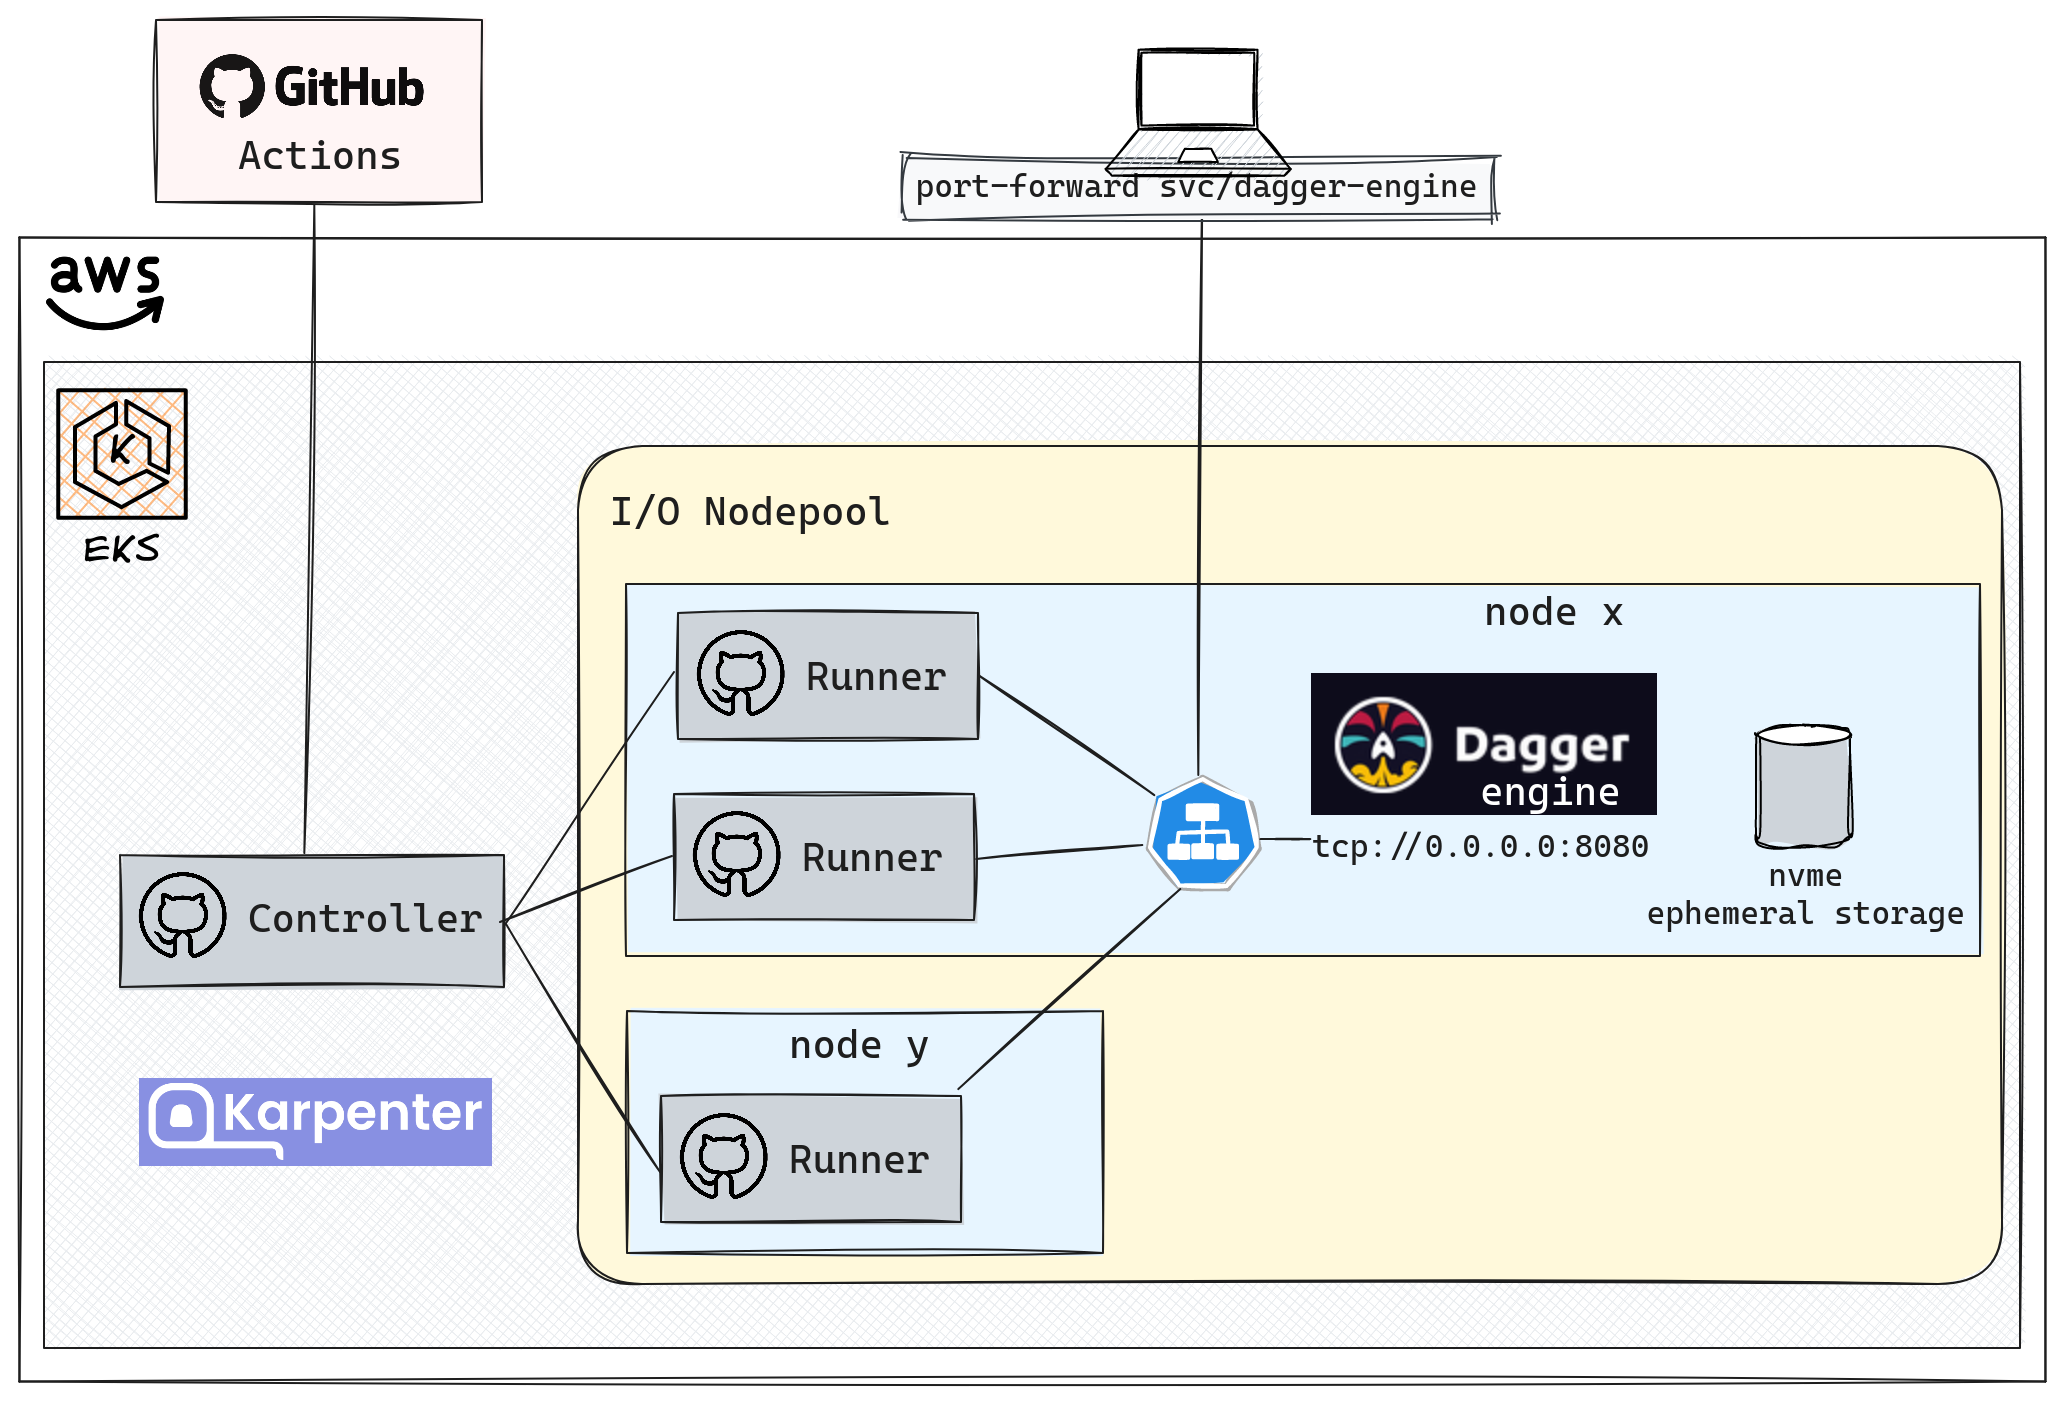
Before you jump on the Dagger bandwagon, let's talk about what you're actually getting into. Dagger isn't just a CLI tool you install and use. It's a client-server architecture where the Dagger Engine runs as a persistent daemon that manages all your builds. On my MacBook Pro M1, this daemon consistently eats 3-4GB of RAM even when idle. Nobody mentions this in the getting started guides.

Dagger Architecture

The installation process looks straightforward, but here's what actually breaks: Docker Desktop needs to be running, BuildKit needs to be enabled, and if you're on Windows with WSL2, prepare for permission hell. I spent 4 hours on Windows debugging why dagger version kept returning Error: engine start timeout even though Docker was running fine. The issue? Docker Desktop WSL2 integration wasn't properly sharing the Docker socket with Dagger, and the error message was completely useless.

The Go SDK Experience

Dagger Go SDK Example

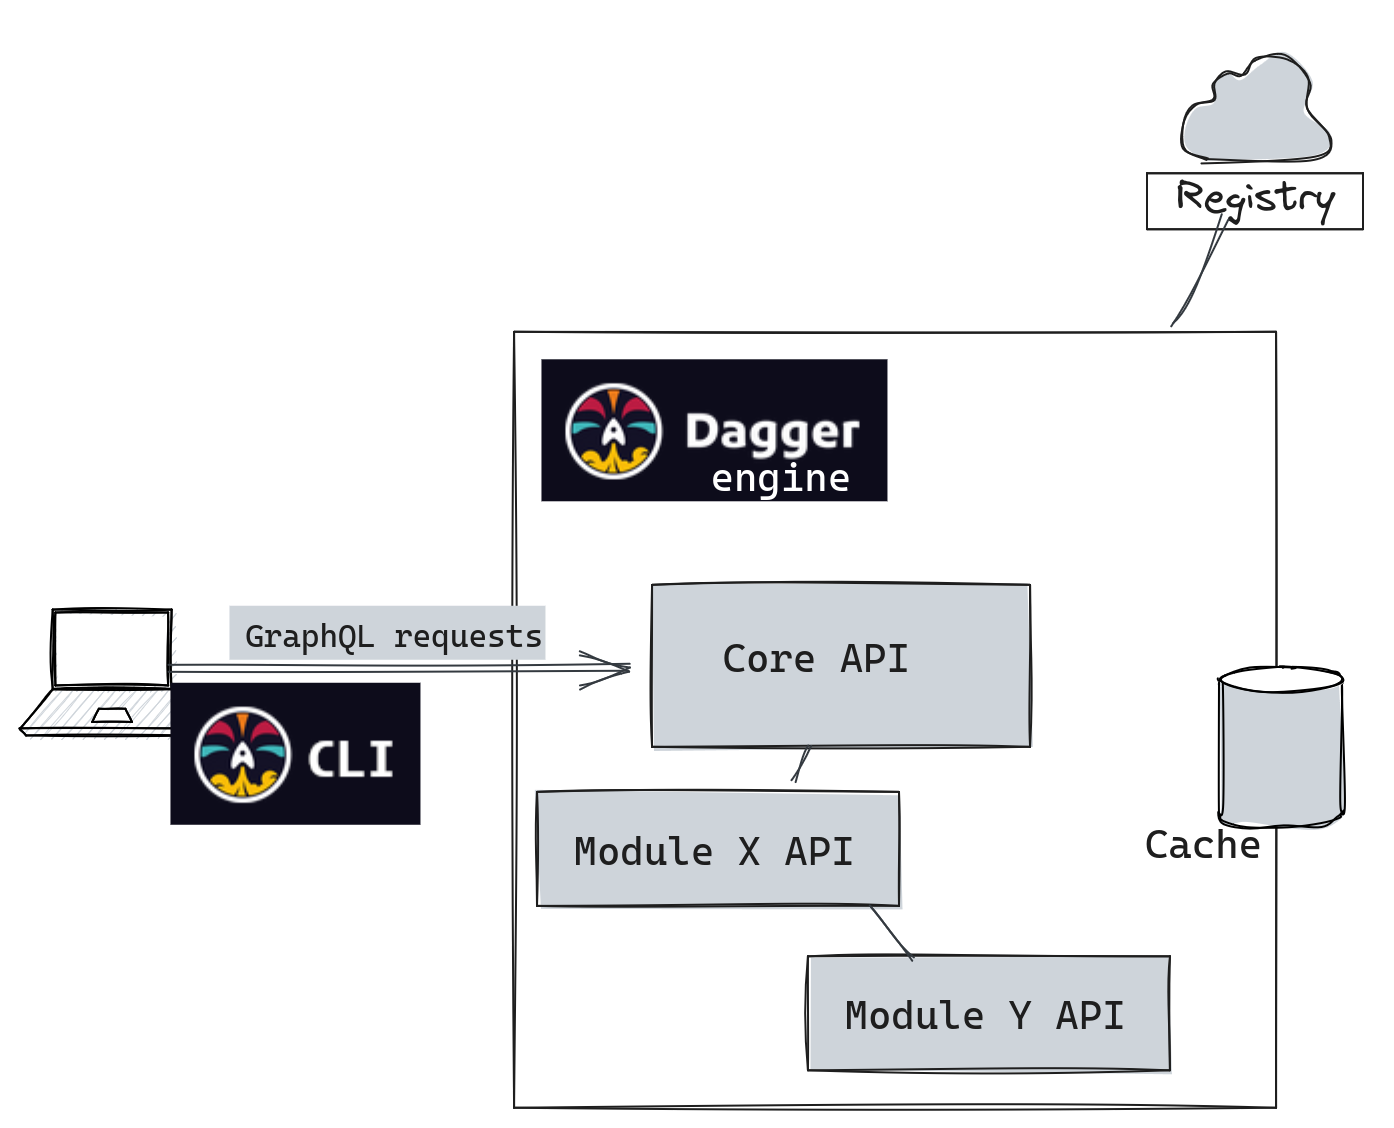
I tested primarily with the Go SDK since that's supposedly the most mature. The fluent API looks clean in examples:

func (m *MyModule) BuildApp(source *dagger.Directory) *dagger.Container {
    return dag.Container().
        From("golang:1.22-alpine").
        WithMountedDirectory("/src", source).
        WithWorkdir("/src").
        WithExec([]string{"go", "build", "-o", "app", "."})
}

Reality check: this simple build took 8 minutes the first time because Dagger pulls every damn image layer through its own registry cache. The BuildKit caching is powerful once it's warmed up, but cold starts are brutal. Your first few runs will be slower than your existing setup.

What Actually Works Well

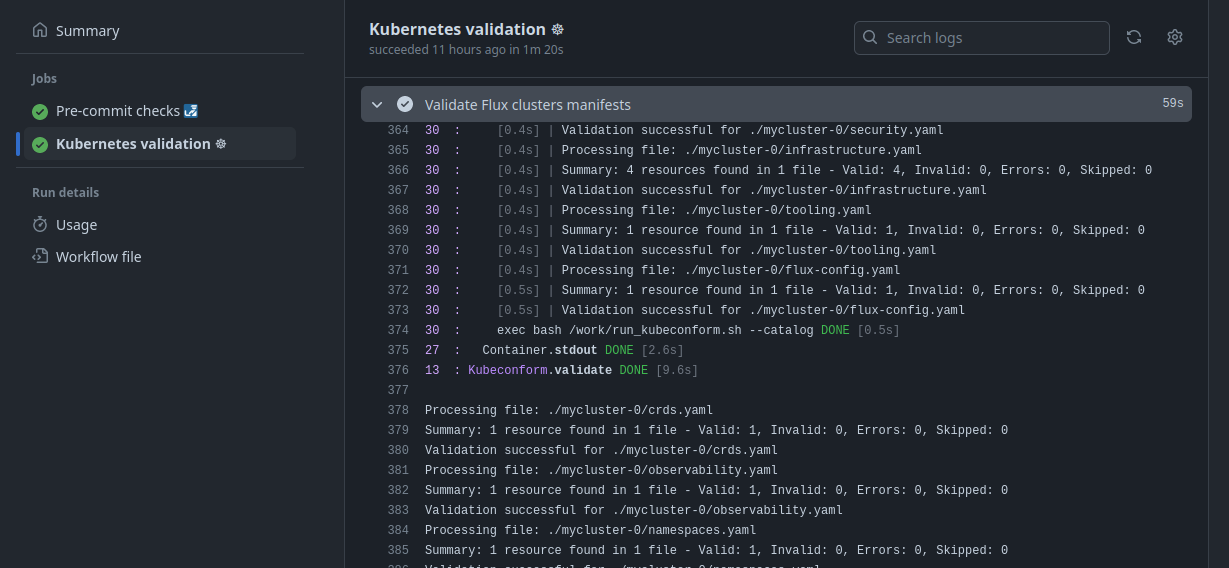
The debugging experience is genuinely better. When your build fails, you can run dagger call build-app --source=. terminal and get dropped into the exact container where the failure happened. This is documented but the real value is debugging complex dependency issues. I found three separate problems in our Node.js build that were hidden by the GitHub Actions runner environment.

The local/remote parity thing isn't marketing bullshit - it actually works. Same container, same filesystem state, same environment variables. When something fails locally, it fails the exact same way in CI. This eliminated about 80% of the "works on my machine" incidents we were seeing. The container-first approach means your development environment matches production exactly.

The Ecosystem Reality

The Daggerverse has maybe 100 modules total, and half of them look like weekend projects that haven't been updated since 2023. Compare that to the thousands of GitHub Actions or Jenkins plugins available. Want to deploy to AWS? You're writing your own module. Need Kubernetes integration? Hope you like writing CUE configuration files and debugging YAML hell in a different language.

Most modules are one-person side projects with spotty maintenance. The official modules are solid but limited. If you're doing anything beyond basic build/test/deploy workflows, you'll be implementing it yourself.

Module development means writing functions in Go, Python, or TypeScript and exposing them as pipeline steps. Each module is supposedly reusable across projects, but the ecosystem is tiny compared to mature CI/CD platforms.

Dagger vs The Competition: Reality Check

Aspect

Dagger

Jenkins

GitHub Actions

GitLab CI

Pipeline Definition

makes you write actual code (verbose but powerful)

uses Groovy (may God have mercy on your soul)

uses YAML (fine until you need logic)

also uses YAML (but with better features than GitHub)

Local Execution

actually works locally

  • like, you run the exact same thing.

Hahaha no.

Push and pray, baby.

Push and pray, baby.

First-time Setup

takes 20+ minutes and you'll spend half a day figuring out why Docker won't cooperate.

is multiple days of plugin dependency hell.

works immediately (it's their one superpower).

is pretty straightforward.

Debugging

drops you into an interactive shell where shit broke

  • this is legitimately amazing.

logs are hot garbage

  • good luck finding what actually failed.

logs are readable but limited.

logs are decent.

Caching

When Dagger's cache works, it's fucking magical. When it breaks (which is weekly), you'll want to throw your laptop.

caching is manual hell.

has limited caching but it's predictable.

cache is OK.

Memory Usage

eats 3-8GB just sitting there doing nothing.

will consume whatever Java heap you give it (1-4GB typical).

run on their cloud so not your problem.

run on their cloud so not your problem.

Learning Curve

assumes you know containers well

  • steep learning curve.
  • Groovy is like learning two terrible things at once.

you can be productive in a weekend.

is similar.

Community

has maybe 100 modules, half abandoned.

has thousands of plugins (with mysterious dependency conflicts).

marketplace is huge.

has solid built-ins.

Lock-in

containers are portable (theoretically).

workflows are Jenkins-only hell.

only works on GitHub.

only works on GitLab.

Performance Reality: It's Complicated

After seeing how Dagger actually works in practice, let's get real about the performance claims. Yes, it can be faster. No, it's not automatically faster. After testing on our team's various projects, here's what actually matters.

The Caching Is Both Amazing and Infuriating

Dagger Kubernetes Cache Architecture

Dagger's BuildKit caching is legitimately the best I've used. When it works, it's magical. Our Go builds went from 6 minutes to 30 seconds on subsequent runs because every go mod download and go build step gets cached individually.

CI/CD Pipeline Flow

But here's the catch: cache invalidation is poorly documented and debugging cache misses will drive you insane. We had a Node.js project where our builds went from 90 seconds back to 12 minutes after someone added a single dev dependency to package.json. Turns out Dagger was invalidating the entire npm install cache because the file timestamp changed, even though 99% of the dependencies were identical. The cache debugging tools just showed "cache miss" without explaining why, and I spent 2 days comparing mount paths and dependency graphs before realizing it was just a Docker layer cache invalidation cascade.

Cold Start Reality Check

First-time builds are brutally slow. That 30-second cached build? The first run took 12 minutes because Dagger has to:

  1. Pull the Dagger Engine image (400MB+)
  2. Download all your base images through Dagger's registry proxy
  3. Build every layer from scratch
  4. Warm up the BuildKit cache

Our CI runner budget actually went up the first month because cold builds were slower than our GitHub Actions setup. It evened out after the cache warmed up, but don't expect immediate savings.

BuildKit caches everything - base images, individual RUN commands, you name it. Each pipeline step gets a cache key, and if nothing changed, it skips the expensive stuff.

What Actually Gets Faster

The real performance wins come from local development, not CI/CD. Being able to run the exact same pipeline locally that runs in CI is huge for debugging. Instead of pushing commits to test changes, I can run dagger call build locally and get results in under a minute once cached.

For our team's workflow:

  • Local testing: 3-5x faster than push-and-wait-for-CI
  • Debugging build issues: 10x faster because I can reproduce locally
  • Cross-platform builds: Actually faster than our previous setup because Dagger handles the orchestration

The Memory and Disk Problem

Nobody talks about the resource requirements. The Dagger Engine consumes massive amounts of disk space for caching. After 2 weeks of regular use, our cache directory was 15GB. On CI runners with limited disk, this becomes a real constraint.

The documentation mentions you can configure cache limits, but the defaults are aggressive. The cache storage configuration options are limited compared to Docker's cache management features. We had to add dagger engine stop to our CI cleanup scripts to prevent runners from running out of space, along with regular cache pruning.

When Dagger Is Actually Slower

Some workflows are genuinely slower with Dagger:

  • Single-shot builds (like one-off deployments)
  • Projects with frequently changing dependencies
  • Builds that don't benefit from layer caching (like copying large file trees)

Our Jekyll site builds saw zero improvement because most of the time is copying 2GB of images, not installing gems. Dagger's overhead made them slightly slower, and the container startup time ate any potential gains.

Parallel Execution Reality

The DAG parallelization works well, but you have to structure your pipeline to take advantage of it. The Go API makes it easy to accidentally create dependency chains that prevent parallelization.

This runs tests and builds in parallel:

func (m *MyModule) CiPipeline(source *dagger.Directory) error {
    // These run in parallel
    testResults := m.Test(source)
    buildArtifact := m.Build(source)
    
    // This waits for both
    return m.Deploy(buildArtifact, testResults)
}

But this doesn't:

func (m *MyModule) BadPipeline(source *dagger.Directory) error {
    testResults := m.Test(source)
    if testResults != nil {
        return testResults
    }
    return m.Build(source) // Waits for tests unnecessarily
}

The difference in execution time can be 2-3x for our larger projects.

Dagger runs pipeline steps as a DAG, figuring out what can run in parallel automatically. Works well if you structure your functions right, but it's easy to accidentally create bottlenecks.

The Questions Everyone Actually Asks

Q

Why does my Dagger build take forever the first time?

A

This is the #1 complaint I hear. Dagger has to download the Dagger Engine container (400MB+), pull all your base images through its proxy, and build every layer from scratch. The caching documentation doesn't mention that first runs are always slow. Budget 10-20 minutes for first-time setup, then subsequent runs will be faster. If you're switching between projects frequently, you'll hit this cold start penalty repeatedly.

Q

How do I debug when my Dagger pipeline fails with some cryptic container error?

A

Use dagger call your-function --help first to see what parameters you're missing. For runtime failures, dagger call your-function terminal drops you into the failing container so you can poke around. The debugging guide is actually helpful here, unlike most documentation. The interactive terminal feature is legitimately useful for figuring out filesystem issues and environment problems.

Q

Why is the Dagger daemon eating all my RAM?

A

The engine architecture runs a persistent daemon that caches everything. On my machine, it uses 3-4GB even when idle. There's no good way to limit this except killing the engine when you're not using it. Run dagger engine stop to free up memory, but you'll lose all cached layers and have to rebuild from scratch next time. It's a trade-off between performance and resource usage.

Q

Can I run Dagger without Docker Desktop?

A

Technically yes with Docker CE, but Docker Desktop makes everything easier. On Linux, make sure your user is in the docker group or you'll get permission denied errors every time you try to run dagger call. Windows with WSL2 is a complete nightmare. I spent an entire Saturday debugging why I kept getting Error: failed to get current container: rpc error: code = Unknown desc = could not create build session: buildkit: failed to solve: failed to read dockerfile even though my Dockerfile was perfectly fine. Turns out it was Docker socket permissions in WSL2 that nobody has figured out how to fix properly. Just use GitHub Actions and save your sanity.

Q

My cache keeps getting invalidated for no reason. What gives?

A

Cache invalidation is poorly documented and the rules aren't intuitive. I had a Node.js project where adding a single package.json dependency invalidated the entire Docker layer cache because Dagger couldn't figure out that COPY package*.json /app/ was the same operation as before. The most common gotcha: mounting your source directory at different points in the pipeline. I spent 2 days debugging why our Go builds went from 45 seconds back to 8 minutes randomly. Turns out someone changed .WithMountedDirectory("/src", source) to .WithMountedDirectory("/app", source) in a different function, and that broke the entire cache chain even though the files were identical.

Q

How do I handle secrets without them showing up in logs?

A

Use the Secret type in your functions, don't just pass strings:

func (m *MyModule) Deploy(apiKey *dagger.Secret) error {
    return dag.Container().
        From("alpine").
        WithSecretVariable("API_KEY", apiKey).
        WithExec([]string{"deploy.sh"})
}

Secrets are encrypted in transit and at rest, and won't appear in container logs. But if you accidentally echo $API_KEY in a script, it's still visible. Be careful.

Q

Is Dagger actually faster than GitHub Actions?

A

Dagger Cache Performance After Warmup

For repeated builds with good caching, yes. For one-off builds or frequently changing codebases, no. The performance depends entirely on cache hit rates.

Your mileage will vary based on your project structure, dependency stability, and how often you're building from scratch. Don't expect automatic speed improvements.

Q

Why does everyone keep mentioning BuildKit? What is it?

A

BuildKit is Docker's advanced build engine that Dagger uses underneath. It handles the DAG execution, layer caching, and parallelization that makes Dagger fast. You don't need to understand BuildKit to use Dagger, but knowing it exists helps explain why Dagger behaves the way it does. When Dagger is slow, it's usually because BuildKit is doing something expensive.

Q

Can I use Dagger with my existing Jenkins/GitHub Actions setup?

A

Yes, but it's weird. You can call Dagger from a GitHub Action or Jenkins job, but you're essentially running a container orchestrator inside your CI system. Most teams either fully commit to Dagger or stick with their existing setup. Half-migrations create more complexity than they solve.

Q

Should I migrate my team to Dagger?

A

Probably not, unless you're having real problems with your current CI/CD. If GitHub Actions or Jenkins work fine for your team, the learning curve isn't worth it. Consider Dagger if you're debugging "works on my machine" issues weekly, managing complex multi-service builds, or your current CI/CD is genuinely limiting productivity. Otherwise, stick with what works.

Performance Reality: My Test Results

Service

GitHub Actions Build Time

Dagger Cold Build Time

Dagger Cached Build Time

Notes

Go API (5 services)

4-6 minutes usually

15 minutes

45-90 seconds

Actually faster when the cache isn't fucked.

Node.js SPA

3-4 minutes

8-15 minutes

30-60 seconds

Good for repeated builds if you're not constantly changing dependencies.

Python Django

6-8 minutes

15-25 minutes

2-4 minutes

Mixed results

  • sometimes great, sometimes cache breaks for no reason.

Static Site (Hugo)

1-2 minutes

5-8 minutes

1-3 minutes

Honestly slower overall because most time is copying 2GB of images, not installing dependencies.

Java Spring

8-12 minutes (Jenkins)

20-30 minutes

2-5 minutes

Big wins after cache warmup, but that initial setup cost hurt.

The Migration Disasters and Success Stories

Now for the real talk: how do teams actually fare when they try to adopt Dagger?

Let me tell you about the three production Dagger deployments I've seen up close

  • one spectacular failure, one moderate success, and one that's still limping along.

Team A: The Spectacular Failure (6-person startup)

GitHub Actions Dagger Integration

This team tried to migrate their entire Rails deployment pipeline to Dagger without understanding what they were getting into.

They had a simple Git

Hub Actions workflow that worked fine, but the CTO read some blog posts and decided Dagger was "the future."

Three weeks in, they were still debugging why their Redis cache wasn't starting properly in the Dagger containers. The secret management was confusing everyone because it works differently from GitHub Actions secrets. Environment variable handling and secret mounting follow different patterns than traditional CI/CD platforms.

They spent more time fighting Dagger than shipping features.

Security Lesson: Dagger's secret management works differently from GitHub Actions secrets.

The final straw was when their production deployment failed on a Friday night because the Dagger Engine ran out of disk space

  • the cache had grown to 47GB without any cleanup
  • and took down the entire CI/CD system.

The error message was just Error: buildkit: failed to solve: failed to allocate space, which gave them no clue what was actually wrong.

They spent 3 hours debugging container registries and network issues before realizing it was a simple disk space problem. Rolled back to GitHub Actions first thing Monday morning.

Lesson: Don't migrate your entire pipeline if your current setup works.

Dagger is for teams with real CI/CD pain, not teams looking for shiny new tools.

Team B: The Moderate Success (50-person company, monorepo)

These guys had legitimate problems: a polyglot monorepo with Java, Node.js, and Go services.

Their Jenkins setup was breaking weekly, and "works on my machine" incidents were eating 20% of their sprint capacity.

They spent 2 months migrating incrementally, starting with just the Go services. The local development parity was immediately helpful

  • when builds failed, developers could reproduce the exact failure locally instead of pushing trial-and-error commits.

The incremental migration approach they followed is documented in Dagger's guides, and polyglot support made it easier to handle their mixed-language codebase.

Six months later, their build times are roughly the same as before, but their debugging time is dramatically lower. They estimate saving 5-8 hours per week in environment-related troubleshooting. The BuildKit caching helps, but the real win is consistency.

The downside: their infrastructure costs went up about 15% due to the Dagger Engine resource requirements and cache storage.

They're break-even on total cost when you factor in developer time savings.

Team C: Still Limping Along (Enterprise, 200+ engineers)

This team has been "migrating to Dagger" for 8 months.

They have some services running on Dagger, others still on their legacy system, and a few that use both depending on the deployment environment.

The technical challenges aren't the problem

  • the Go SDK works fine, the performance is good once cached.

The problem is organizational. Half the team loves the debugging experience, half thinks it's unnecessarily complex. They can't get consensus on whether to fully commit or abandon the migration.

The scaling issue is real for them.

They're running multiple Dagger engines and cache management is becoming a nightmare. Storage costs are ballooning because they don't have good cache eviction policies.

Their advice: "Don't start a migration unless you can commit to finishing it.

Half-migrated is worse than not starting."

The Security Reality

Let's talk about the elephant in the room: Dagger needs elevated privileges to run the Docker daemon.

In enterprise environments with strict security policies, this is a non-starter.

I've seen security teams reject Dagger deployments because:

  • The engine runs as root
  • It needs access to the Docker socket
  • Container escapes are theoretically possible
  • The cache storage isn't encrypted at rest by default

If your org has a "no root containers" policy, Dagger won't work.

Period.

Resource Usage Reality Check

The documentation doesn't mention the real resource requirements.

Based on my experience:

  • RAM: 4-8GB per Dagger Engine instance under load
  • Disk: 10-50GB for cache storage, depending on project size
  • CPU:

High during builds, but idles well

  • Network: Substantial bandwidth for image pulls on cold starts

We had to upgrade our CI runners from 2GB to 8GB RAM because the Dagger Engine + Build

Kit + our builds consistently used 6-7GB.

Budget accordingly.

Dagger's memory usage is different from traditional CI/CD systems. GitHub Actions spin up fresh environments for each job, but Dagger keeps persistent state that grows over time. You'll need to actively manage cache storage and memory.

When to Actually Consider Dagger

Skip the marketing hype. Dagger makes sense for:

  1. Teams with real environment drift problems
    • if "works on my machine" is costing you sprints
  2. Complex multi-service builds
    • monorepos with 5+ services in different languages
  3. Teams comfortable with containers
    • if Docker/Kubernetes is already part of your stack
  4. Frequent build scenarios
    • 50+ builds per day where caching matters

Don't bother if:

  • Your current CI/CD works fine
  • You're a small team (under 10 engineers)
  • the learning curve will eat your sprint velocity
  • You don't have container expertise
  • Security policies prevent elevated privileges

Learning curve is 2-4 weeks for experienced developers, longer if your team doesn't know containers well. Budget that time and don't expect productivity gains in month one. Expect things to be slower initially while everyone figures out how Dagger actually works.

Essential Dagger Resources and Further Reading